Red Deer—Mountain View
Red Deer—Mountain View is a federal electoral district in Alberta, Canada, that has been represented in the House of Commons of Canada since 2015.
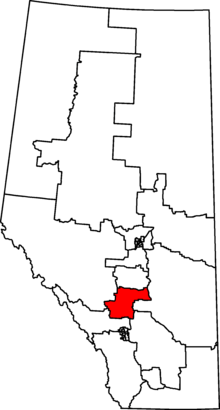 Red Deer—Mountain View in relation to other Alberta federal electoral districts as of the 2013 Representation Order. | |||
| Federal electoral district | |||
| Legislature | House of Commons | ||
| MP |
Conservative | ||
| District created | 2013 | ||
| First contested | 2015 | ||
| Last contested | 2019 | ||
| District webpage | profile, map | ||
| Demographics | |||
| Population (2011)[1] | 110,793 | ||
| Electors (2019) | 89,098 | ||
| Area (km²)[2] | 7,659 | ||
| Pop. density (per km²) | 14.5 | ||
| Census divisions | Division No. 6, Division No. 8 | ||
| Census subdivisions | Carstairs, Didsbury, Innisfail, Mountain View, Olds, Penhold, Red Deer, Red Deer County, Sundre | ||
Red Deer—Mountain View was created by the 2012 federal electoral boundaries redistribution and was legally defined in the 2013 representation order. It came into effect upon the call of the 42nd Canadian federal election, scheduled for October 2015.[3] It was created mostly out of the southern half of Red Deer, combined with small portions of Crowfoot and Wild Rose.[4]
Members of Parliament
This riding has elected the following members of the House of Commons of Canada:
| Parliament | Years | Member | Party | |
|---|---|---|---|---|
| Red Deer—Mountain View Riding created from Crowfoot, Red Deer, and Wild Rose |
||||
| 42nd | 2015–2019 | Earl Dreeshen | Conservative | |
| 43rd | 2019–present | |||
Election results
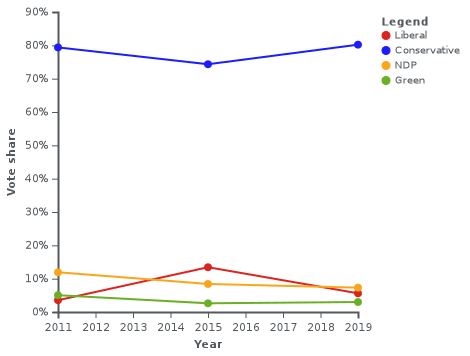
Graph of election results in Red Deer—Mountain View (minor parties that never got 2% of the vote or didn't run consistently are omitted)
| 2019 Canadian federal election | ||||||||
|---|---|---|---|---|---|---|---|---|
| Party | Candidate | Votes | % | ±% | Expenditures | |||
| Conservative | Earl Dreeshen | 54,765 | 80.2 | +5.87 | ||||
| New Democratic | Logan Garbanewski | 4,946 | 7.3 | -1.11 | ||||
| Liberal | Gary Tremblay | 3,795 | 5.6 | -7.83 | ||||
| People's | Paul Mitchell | 2,637 | 3.9 | - | ||||
| Green | Conner Borlé | 2,026 | 3.0 | +0.39 | ||||
| Total valid votes/Expense limit | 68,169 | 100.0 | ||||||
| Total rejected ballots | 278 | |||||||
| Turnout | 68,447 | 76.8 | ||||||
| Eligible voters | 89,098 | |||||||
| Conservative hold | Swing | +3.49 | ||||||
| Source: Elections Canada[5][6] | ||||||||
| 2015 Canadian federal election | ||||||||
|---|---|---|---|---|---|---|---|---|
| Party | Candidate | Votes | % | ±% | Expenditures | |||
| Conservative | Earl Dreeshen | 46,245 | 74.33 | -5.04 | $75,604.03 | |||
| Liberal | Chandra Lescia Kastern | 8,356 | 13.43 | +9.89 | $9,454.54 | |||
| New Democratic | Paul Harris | 5,233 | 8.41 | -3.49 | $13,948.08 | |||
| Green | Simon Oleny | 1,621 | 2.61 | -2.44 | – | |||
| Libertarian | James Walper | 445 | 0.72 | – | $1,554.01 | |||
| Pirate | Scott Milne | 312 | 0.50 | – | $155.90 | |||
| Total valid votes/Expense limit | 62,212 | 100.00 | $225,554.46 | |||||
| Total rejected ballots | 135 | 0.22 | – | |||||
| Turnout | 62,347 | 71.88 | – | |||||
| Eligible voters | 86,737 | |||||||
| Conservative hold | Swing | -7.46 | ||||||
| Source: Elections Canada[7][8] | ||||||||
| 2011 federal election redistributed results[9] | |||
|---|---|---|---|
| Party | Vote | % | |
| Conservative | 37,507 | 79.37 | |
| New Democratic | 5,626 | 11.91 | |
| Green | 2,384 | 5.04 | |
| Liberal | 1,673 | 3.54 | |
| Others | 65 | 0.14 | |
References
- Statistics Canada: 2012
- Statistics Canada: 2012
- Timeline for the Redistribution of Federal Electoral Districts
- Report – Alberta
- "List of confirmed candidates". Elections Canada. Retrieved October 4, 2019.
- "Election Night Results". Elections Canada. Retrieved November 6, 2019.
- "October 19, 2015 Election Results — Red Deer—Mountain View (Validated results)". Elections Canada. 22 October 2015. Retrieved 4 November 2015.
- Elections Canada – Preliminary Election Expenses Limits for Candidates
- Pundits' Guide to Canadian Elections
This article is issued from Wikipedia. The text is licensed under Creative Commons - Attribution - Sharealike. Additional terms may apply for the media files.