Edmonton—Wetaskiwin
Edmonton—Wetaskiwin is a federal electoral district in Alberta, Canada, that has been represented in the House of Commons of Canada since 2015.
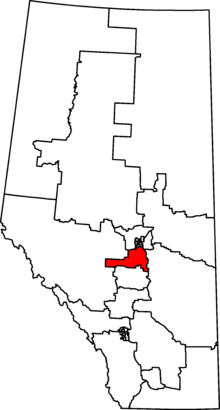 Edmonton—Wetaskiwin in relation to other Alberta federal electoral districts as of the 2013 Representation Order. | |||
| Federal electoral district | |||
| Legislature | House of Commons | ||
| MP |
Conservative | ||
| District created | 2013 | ||
| First contested | 2015 | ||
| Last contested | 2019 | ||
| District webpage | profile, map | ||
| Demographics | |||
| Population (2016)[1] | 158,749 | ||
| Electors (2019) | 122,984 | ||
| Area (km²)[2] | 4,947 | ||
| Pop. density (per km²) | 32.1 | ||
| Census divisions | Division No. 11 | ||
| Census subdivisions | Beaumont, Devon, Edmonton, Leduc, Leduc County, Millet, Wetaskiwin, Wetaskiwin No. 10 | ||
Edmonton—Wetaskiwin was created by the 2012 federal electoral boundaries redistribution and was legally defined in the 2013 representation order. It came into effect upon the call of the 42nd Canadian federal election, scheduled for 19 October 2015.[3] It was created out of parts of Edmonton—Leduc, Wetaskiwin, Edmonton—Mill Woods—Beaumont and Vegreville—Wainwright.[4]
According to the 2016 census Edmonton—Wetaskiwin is the most populated riding in Canada, with more than 54,000 residents more than the national average of 104,000. Its population grew at a rate of 43.5% since the 2011 census (on which the 2013 representation order was based).[5]
Demographics
- According to the Canada 2016 Census
- Languages: (2016) 76.2% English, 3.0% Tagalog, 2.8% Punjabi, 2.0% French, 1.6% Mandarin, 1.5% German, 1.1% Spanish, 1.1% Cantonese, 1.0% Urdu, 0.9% Gujarati, 0.9% Korean, 0.8% Hindi, 0.6% Arabic[6]
Members of Parliament
This riding has elected the following members of the House of Commons of Canada:
| Parliament | Years | Member | Party | |
|---|---|---|---|---|
| Edmonton—Wetaskiwin Riding created from Edmonton—Leduc, Edmonton—Mill Woods—Beaumont, Vegreville—Wainwright and Wetaskiwin |
||||
| 42nd | 2015–2019 | Mike Lake | Conservative | |
| 43rd | 2019–present | |||
Election results

| 2019 Canadian federal election | ||||||||
|---|---|---|---|---|---|---|---|---|
| Party | Candidate | Votes | % | ±% | Expenditures | |||
| Conservative | Mike Lake | 63,346 | 72.4 | +6.63 | ||||
| Liberal | Richard Wong | 10,802 | 12.4 | -9.05 | ||||
| New Democratic | Noah Garver | 9,820 | 11.2 | +1.48 | ||||
| Green | Emily Drzymala | 1,660 | 1.9 | -0.43 | ||||
| People's | Neil Doell | 1,616 | 1.8 | - | ||||
| Veterans Coalition | Travis Calliou | 211 | 0.2 | - | ||||
| Total valid votes/Expense limit | 87,455 | 100.0 | ||||||
| Total rejected ballots | 392 | 0.4 | +0.1 | |||||
| Turnout | 87,847 | 71.4 | +2.8 | |||||
| Eligible voters | 122,984 | |||||||
| Conservative hold | Swing | +7.84 | ||||||
| Source: Elections Canada[7][8] | ||||||||
| 2015 Canadian federal election | ||||||||
|---|---|---|---|---|---|---|---|---|
| Party | Candidate | Votes | % | ±% | Expenditures | |||
| Conservative | Mike Lake | 44,949 | 65.77 | -9.80 | $108,058.16 | |||
| Liberal | Jacqueline Biollo | 14,660 | 21.45 | +15.73 | $10,463.94 | |||
| New Democratic | Fritz K. Bitz | 6,645 | 9.72 | -4.55 | $12,140.06 | |||
| Green | Joy-Ann Hut | 1,595 | 2.33 | -1.76 | $1,420.42 | |||
| Libertarian | Brayden Whitlock | 495 | 0.72 | – | – | |||
| Total valid votes/Expense limit | 68,344 | 100.00 | $243,641.10 | |||||
| Total rejected ballots | 197 | 0.29 | – | |||||
| Turnout | 68,541 | 69.58 | – | |||||
| Eligible voters | 98,502 | |||||||
| Conservative hold | Swing | -12.76 | ||||||
| Source: Elections Canada[9][10] | ||||||||
| 2011 federal election redistributed results[11] | |||
|---|---|---|---|
| Party | Vote | % | |
| Conservative | 31,194 | 75.57 | |
| New Democratic | 5,891 | 14.27 | |
| Liberal | 2,363 | 5.72 | |
| Green | 1,690 | 4.09 | |
| Others | 143 | 0.35 | |
References
- Statistics Canada: 2016
- Statistics Canada: 2011
- Timeline for the Redistribution of Federal Electoral Districts
- Report – Alberta
- "Population and Dwelling Count Highlight Tables, 2016 Census". Statistics Canada. Retrieved 2017-02-09.
- https://www12.statcan.gc.ca/census-recensement/2016/dp-pd/dt-td/Rp-eng.cfm?LANG=E&APATH=3&DETAIL=0&DIM=0&FL=A&FREE=0&GC=0&GID=0&GK=0&GRP=1&PID=109979&PRID=10&PTYPE=109445&S=0&SHOWALL=0&SUB=888&Temporal=2016,2017&THEME=118&VID=0&VNAMEE=&VNAMEF=
- "List of confirmed candidates". Elections Canada. Retrieved 4 October 2019.
- "Election Night Results". Elections Canada. Retrieved November 7, 2019.
- "October 19, 2015 Election Results — Edmonton—Wetaskiwin (Validated results)". Elections Canada. 21 October 2015. Retrieved 4 November 2015.
- Elections Canada – Preliminary Election Expenses Limits for Candidates Archived August 15, 2015, at the Wayback Machine
- Pundits' Guide to Canadian Elections