Edmonton—Mill Woods—Beaumont
Edmonton—Mill Woods—Beaumont (originally known as Edmonton—Beaumont) was a federal electoral district in Alberta, Canada, that was represented in the House of Commons of Canada from 2004 to 2015.
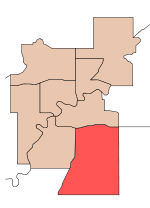
Edmonton—Mill Woods—Beaumont in relation to other federal electoral districts in Edmonton | |
| Defunct federal electoral district | |
| Legislature | House of Commons |
| District created | 2003 |
| District abolished | 2013 |
| First contested | 2004 |
| Last contested | 2011 |
| District webpage | profile, map |
| Demographics | |
| Population (2011)[1] | 137,228 |
| Electors (2011) | 80,250 |
| Area (km²)[2] | 178.25 |
| Census divisions | Division No. 11 |
| Census subdivisions | Edmonton, Leduc County, Beaumont |
Geography
Edmonton–Mill Woods–Beaumont includes the neighbourhoods of Tweddle Place, Michaels Park, Richfield, Lee Ridge, Tipaskan, Kameyosek, Meyonohk, Satoo, Ekota, Menisa, Greenview, Hillview, Tawa, Meyokumin, Sakaw, Jackson Heights, Kiniski Gardens, Flynn Dell, Minchau, Weinlos, Bisset, Daly Grove, Pollard Meadows, Crawford Plains, Larkspur, The Meadows, Wildrose, Ellerslie, Wernerville and Meadows Area in the City of Edmonton, the Town of Beaumont and the small part of Leduc County that is located between Edmonton and Beaumont. The area of the district is 175 km².
History
The electoral district was created as "Edmonton–Beaumont" in 2003 from the vast majority of Edmonton Southeast, a small part of Wetaskiwin, and a fraction of Elk Island.
In 2004, it was renamed "Edmonton–Mill Woods–Beaumont".
Members of Parliament
This riding has elected the following Members of Parliament:
| Parliament | Years | Member | Party | |
|---|---|---|---|---|
| Edmonton—Beaumont Riding created from Edmonton Southeast, Wetaskiwin and Elk Island |
||||
| 38th | 2004–2005 | David Kilgour | Liberal | |
| 2005–2006 | Independent | |||
| Riding renamed — Edmonton—Mill Woods—Beaumont | ||||
| 39th | 2006–2008 | Mike Lake | Conservative | |
| 40th | 2008–2011 | |||
| 41st | 2011–2015 | |||
| Riding dissolved into Edmonton Mill Woods and Edmonton—Wetaskiwin | ||||
Elections results
Edmonton–Mill Woods–Beaumont, 2006–present
| 2011 Canadian federal election | ||||||||
|---|---|---|---|---|---|---|---|---|
| Party | Candidate | Votes | % | ±% | Expenditures | |||
| Conservative | Mike Lake | 27,857 | 61.04 | +0.72 | $44,902 | |||
| New Democratic | Nadine Bailey | 10,875 | 23.83 | +8.71 | $11,236 | |||
| Liberal | Mike Butler | 5,066 | 11.10 | -7.40 | ||||
| Green | Christa Baxter | 1,364 | 2.99 | -2.69 | $1,705 | |||
| Pirate | Brent Schaffrick | 374 | 0.82 | * | $2,461 | |||
| Communist | Naomi Rankin | 100 | 0.22 | -0.16 | $562 | |||
| Total valid votes/Expense limit | 45,636 | 99.58 | ||||||
| Total rejected ballots | 191 | 0.42 | +0.07 | |||||
| Turnout | 45,827 | 53.13 | +1.03 | |||||
| Eligible voters | 85,259 | – | – | |||||
| Conservative hold | Swing | -4.00 | ||||||
| 2008 Canadian federal election | ||||||||
|---|---|---|---|---|---|---|---|---|
| Party | Candidate | Votes | % | ±% | Expenditures | |||
| Conservative | Mike Lake | 25,130 | 60.32 | +1.70 | $80,034 | |||
| Liberal | Indira Saroya | 7,709 | 18.51 | -2.64 | $82,941 | |||
| New Democratic | Mike Butler | 6,297 | 15.12 | +0.57 | $4,620 | |||
| Green | David Allan Hrushka | 2,366 | 5.68 | +1.21 | ||||
| Communist | Naomi Rankin | 157 | 0.38 | +0.19 | $395 | |||
| Total valid votes/Expense limit | 41,659 | 100.00 | $84,984 | |||||
| Total rejected ballots | 146 | 0.35 | +0.07 | |||||
| Turnout | 41,805 | 52.0 | -10.3 | |||||
| 2006 Canadian federal election | ||||||||
|---|---|---|---|---|---|---|---|---|
| Party | Candidate | Votes | % | ±% | Expenditures | |||
| Conservative | Mike Lake | 27,191 | 58.62 | +16.13 | $67,482 | |||
| Liberal | Amarjit Grewal | 9,809 | 21.15 | -21.67 | $73,522 | |||
| New Democratic | Neal Gray | 6,749 | 14.55 | +4.85 | $10,297 | |||
| Green | Kate Harrington | 2,073 | 4.47 | -0.19 | $1,347 | |||
| Independent | Kyle McLeod | 477 | 1.03 | N/A | $8,055 | |||
| Communist | Naomi Rankin | 85 | 0.18 | -0.15 | $280 | |||
| Total valid votes | 46,384 | 100.00 | ||||||
| Total rejected ballots | 131 | 0.28 | +0.16 | |||||
| Turnout | 46,515 | 62.3 | -2.6 | |||||
Edmonton–Beaumont, 2004–2006
| 2004 Canadian federal election | ||||||||
|---|---|---|---|---|---|---|---|---|
| Party | Candidate | Votes | % | ±% | Expenditures | |||
| Liberal | David Kilgour | 17,555 | 42.82 | – | $65,152 | |||
| Conservative | Tim Uppal | 17,421 | 42.49 | – | $66,701 | |||
| New Democratic | Paul Reikie | 3,975 | 9.70 | – | $4,138 | |||
| Green | Michael Garfinkle | 1,911 | 4.65 | – | $788 | |||
| Communist | Naomi Rankin | 135 | 0.33 | – | $751 | |||
| Total valid votes | 40,997 | 100.00 | ||||||
| Total rejected ballots | 181 | 0.44 | ||||||
| Turnout | 41,178 | 59.67 | ||||||
See also
- List of Canadian federal electoral districts
- Alberta federal electoral districts
- Past Canadian electoral districts
References
- "(Code 48011) Census Profile". 2011 census. Statistics Canada. 2012. Retrieved 2011-03-06.
Notes
- Statistics Canada: 2012
- Statistics Canada: 2012
External links
- Riding history for Edmonton—Beaumont (2003 - 2004) from the Library of Parliament
- Riding history for Edmonton—Mill Woods—Beaumont (2004 - present) from the Library of Parliament
- Expenditures - 2008
- Expenditures - 2004
.png)
.png)