Cabucgayan, Biliran
Cabucgayan, officially the Municipality of Cabucgayan (Waray: Bungto san Cabucgayan; Cebuano: Lungsod sa Cabucgayan; Tagalog: Bayan ng Cabucgayan), is a 5th class municipality in the province of Biliran, Philippines. According to the 2015 census, it has a population of 20,788 people.[4]
Cabucgayan | |
|---|---|
| Municipality of Cabucgayan | |
 Map of Biliran with Cabucgayan highlighted | |
OpenStreetMap 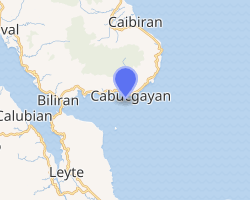
| |
.svg.png) Cabucgayan Location within the Philippines | |
| Coordinates: 11°28′N 124°34′E | |
| Country | |
| Region | Eastern Visayas (Region VIII) |
| Province | Biliran |
| District | Lone district |
| Founded | September 29, 1949 |
| Barangays | 13 (see Barangays) |
| Government | |
| • Type | Sangguniang Bayan |
| • Mayor | Marisol A. Masbang |
| • Vice Mayor | Gemma G. Adobo |
| • Congressman | Gerardo J. Espina Jr. |
| • Municipal Council | Councilors
|
| • Electorate | 14,967 voters (2019) |
| Area | |
| • Total | 54.19 km2 (20.92 sq mi) |
| Elevation | 2.9 m (9.5 ft) |
| Population (2015 census)[4] | |
| • Total | 20,788 |
| • Density | 380/km2 (990/sq mi) |
| • Households | 4,715 |
| Economy | |
| • Income class | 5th municipal income class |
| • Poverty incidence | 35.28% (2015)[5] |
| • Revenue (₱) | 60,609,478.33 (2016) |
| Time zone | UTC+8 (PST) |
| ZIP code | 6550 |
| PSGC | |
| IDD : area code | +63 (0)53 |
| Climate type | tropical monsoon climate |
| Native languages | Cebuano Waray Tagalog |
| Website | www |
History
Cabucgayan derived its name from the snail called bukgay. In the Waray-Waray language, to make a singular noun into a plural noun, the article ka is added before the word and the article an after the word. Kabukgayan, therefore, means a place where there are many snails.
This municipality was created on September 29, 1949 when President Elpidio Quirino issued Executive Order no. 271.[6]
Geography
Cabucgayan is located at the south-eastern section of Biliran Island, and is approximately 19 kilometres (12 mi) south from Caibiran, 33 kilometres (21 mi) away from the provincial capital Naval, and 118 kilometres (73 mi) away from Tacloban, the provincial capital of Leyte. Cabucgayan is bound on the north by Caibiran, east by the Villareal Bay, south by Carigara Bay, and west by the municipality of Biliran
According to the Philippine Statistics Authority, the municipality has a land area of 54.19 square kilometres (20.92 sq mi) [2] constituting 10.11% of the 536.01-square-kilometre- (206.95 sq mi) total area of Biliran.
Barangays
Cabucgayan is politically subdivided into 13 barangays.[7]
| PSGC | Barangay | Population | ±% p.a. | |||
|---|---|---|---|---|---|---|
| 2015[4] | 2010[8] | |||||
| 087803001 | Balaquid | 12.9% | 2,688 | 2,499 | 1.40% | |
| 087803002 | Baso | 7.5% | 1,563 | 1,411 | 1.97% | |
| 087803003 | Bunga | 19.4% | 4,041 | 3,835 | 1.00% | |
| 087803004 | Caanibongan | 1.3% | 270 | 272 | −0.14% | |
| 087803005 | Casiawan | 6.1% | 1,274 | 1,109 | 2.68% | |
| 087803007 | Esperanza (Poblacion) | 5.2% | 1,071 | 1,284 | −3.39% | |
| 087803008 | Langgao | 6.2% | 1,299 | 1,164 | 2.11% | |
| 087803009 | Libertad | 6.7% | 1,402 | 1,332 | 0.98% | |
| 087803010 | Looc | 13.3% | 2,758 | 2,389 | 2.77% | |
| 087803011 | Magbangon (Poblacion) | 7.7% | 1,611 | 1,503 | 1.33% | |
| 087803012 | Pawikan | 7.1% | 1,480 | 1,471 | 0.12% | |
| 087803013 | Salawad | 2.6% | 546 | 542 | 0.14% | |
| 087803014 | Talibong | 3.8% | 785 | 810 | −0.60% | |
| Total | 20,788 | 19,621 | 1.11% | |||
Climate
It belongs to the two types of climate, Type II and Type IV. It is characterized by pronounced rainfall periodically accompanied by trade winds and storms during the months of January, June, July, November and December while the minimum monthly rainfall occurs in February, March, April and May.
The total land area dedicated to agriculture is 2,905 hectares (7,180 acres) or 59.63% of the total land area. The three major forest products are timber, rattan and wild abaca.
| Climate data for Cabucgayan, Biliran | |||||||||||||
|---|---|---|---|---|---|---|---|---|---|---|---|---|---|
| Month | Jan | Feb | Mar | Apr | May | Jun | Jul | Aug | Sep | Oct | Nov | Dec | Year |
| Average high °C (°F) | 28 (82) |
29 (84) |
30 (86) |
31 (88) |
31 (88) |
30 (86) |
30 (86) |
30 (86) |
30 (86) |
29 (84) |
29 (84) |
29 (84) |
30 (85) |
| Average low °C (°F) | 23 (73) |
22 (72) |
22 (72) |
23 (73) |
24 (75) |
25 (77) |
25 (77) |
25 (77) |
25 (77) |
24 (75) |
24 (75) |
23 (73) |
24 (75) |
| Average precipitation mm (inches) | 73 (2.9) |
56 (2.2) |
75 (3.0) |
71 (2.8) |
114 (4.5) |
174 (6.9) |
172 (6.8) |
163 (6.4) |
167 (6.6) |
161 (6.3) |
158 (6.2) |
125 (4.9) |
1,509 (59.5) |
| Average rainy days | 15.2 | 12.5 | 16.2 | 17.3 | 23.9 | 27.3 | 28.4 | 26.9 | 26.9 | 27.1 | 23.8 | 19.3 | 264.8 |
| Source: Meteoblue [9] | |||||||||||||
Demographics
| Population census of Cabucgayan | ||||||||||||||||||||||||||||||||||||||||
|---|---|---|---|---|---|---|---|---|---|---|---|---|---|---|---|---|---|---|---|---|---|---|---|---|---|---|---|---|---|---|---|---|---|---|---|---|---|---|---|---|
|
| |||||||||||||||||||||||||||||||||||||||
| Source: Philippine Statistics Authority[4][8][10][11] | ||||||||||||||||||||||||||||||||||||||||
In the 2015 census, Cabucgayan had a population of 20,788.[4] The population density was 380 inhabitants per square kilometre (980/sq mi).
References
- "Municipality". Quezon City, Philippines: Department of the Interior and Local Government. Retrieved 31 May 2013.
- "Province: Biliran". PSGC Interactive. Quezon City, Philippines: Philippine Statistics Authority. Retrieved 12 November 2016.
- "Cabucgayan, Biliran Profile". PhilAtlas.com. Retrieved 15 June 2020.
- Census of Population (2015). "Region VIII (Eastern Visayas)". Total Population by Province, City, Municipality and Barangay. PSA. Retrieved 20 June 2016.
- "PSA releases the 2015 Municipal and City Level Poverty Estimates". Quezon City, Philippines. Retrieved 12 October 2019.
- "Executive Order No. 271; Creating Certain Portions of the Municipalities of Biliran and Caibiran, Province of Leyte, Into an Independent Municipality Under the Name of Cabucgayan". Official Gazette of the Republic of the Philippines. Malacañang, Manila, Philippines. 29 September 1949. Retrieved 17 December 2016.
- "Municipal: Cabucgayan, Biliran". PSGC Interactive. Quezon City, Philippines: Philippine Statistics Authority. Retrieved 8 January 2016.
- Census of Population and Housing (2010). "Region VIII (Eastern Visayas)". Total Population by Province, City, Municipality and Barangay. NSO. Retrieved 29 June 2016.
- "Cabucgayan: Average Temperatures and Rainfall". Meteoblue. Retrieved 29 February 2020.
- Censuses of Population (1903–2007). "Region VIII (Eastern Visayas)". Table 1. Population Enumerated in Various Censuses by Province/Highly Urbanized City: 1903 to 2007. NSO.
- "Province of Biliran". Municipality Population Data. Local Water Utilities Administration Research Division. Retrieved 17 December 2016.
External links
Places adjacent to Cabucgayan, Biliran | ||||||||||
|---|---|---|---|---|---|---|---|---|---|---|
| ||||||||||
| Municipalities | |
|---|---|