Brighton and Hove City Council elections
Brighton and Hove City Council is a unitary authority in East Sussex, England. It was created as Brighton and Hove Borough Council on 1 April 1997 replacing Brighton and Hove Borough Councils. It was granted city status in 2001.
Brighton Borough Council elections and Hove Borough Council elections took place in alternating patters from 1974 when Local Government reorganisation last took place.
Political control
Since the first election to the council in 1996 political control of the council has been held by the following parties:[1]
| Party in control | Party in minority lead | ||||
|---|---|---|---|---|---|
| Labour | 1996–2003 | ||||
| No overall control | 2003–present | Labour | 2003–2007 | ||
| Conservative | 2007–2011 | ||||
| Green Party § | 2011–2015 | ||||
| Labour | 2015–present | ||||
§ first Green led council in the United Kingdom[2]
Council elections
See Brighton Borough Council elections or Hove Borough Council elections for election prior to 1996
- 1996 Brighton and Hove Borough Council election
- 1999 Brighton and Hove Borough Council election
- 2003 Brighton and Hove City Council election (New ward boundaries)[3][4][5]
- 2007 Brighton and Hove City Council election
- 2011 Brighton and Hove City Council election
- 2015 Brighton and Hove City Council election
- 2019 Brighton and Hove City Council election
Overview
Election Results
| Year | Conservative | Green | Labour | Liberal Democrats | Independent | |||||
| 2019 | 14 | 19 | 20 | 0 | 1 | |||||
| 2015 | 20 | 11 | 23 | 0 | 0 | |||||
| 2011 | 18 | 23 | 13 | 0 | 0 | |||||
| 2007 | 26 | 12 | 13 | 2 | 1 | |||||
| 2003 | 20 | 6 | 24 | 3 | 1 | |||||
| 1999 | 27 | 3 | 45 | 3 | 0 | |||||
| 1996 | 23 | 1 | 54 | 0 | 0 | |||||
| Party | Seats | Council Composition May 2019 | ||||||||||||||||||||||||||||||||||||||||||||||||||||||||||||
|---|---|---|---|---|---|---|---|---|---|---|---|---|---|---|---|---|---|---|---|---|---|---|---|---|---|---|---|---|---|---|---|---|---|---|---|---|---|---|---|---|---|---|---|---|---|---|---|---|---|---|---|---|---|---|---|---|---|---|---|---|---|---|
| 1996 | 1999 | 2003 | 2007 | 2011 | 2015 | 2019 | ||||||||||||||||||||||||||||||||||||||||||||||||||||||||
| Green | 1 | 3 | 6 | 12 | 23 | 11 | 19 | |||||||||||||||||||||||||||||||||||||||||||||||||||||||
| Conservative | 23 | 27 | 20 | 26 | 18 | 20 | 14 | |||||||||||||||||||||||||||||||||||||||||||||||||||||||
| Labour | 54 | 45 | 24 | 13 | 13 | 23 | 20 | |||||||||||||||||||||||||||||||||||||||||||||||||||||||
| Independent | 0 | 0 | 1 | 1 | 0 | 0 | 1 | |||||||||||||||||||||||||||||||||||||||||||||||||||||||
| Liberal Democrats | 0 | 3 | 2 | 0 | 0 | 0 | 0 | |||||||||||||||||||||||||||||||||||||||||||||||||||||||
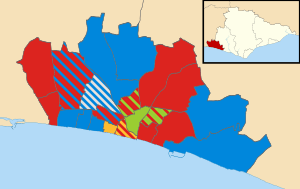
District result maps
 2003 results map
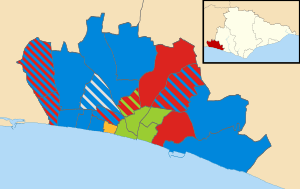 2007 results map
 2011 results map
 2015 results map
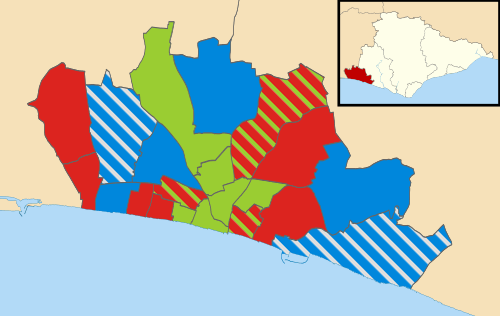 2019 results map
By-election results
Overview
| By-election | Date | Incumbent party | Result | ||
|---|---|---|---|---|---|
| Wish | 1 May 1997 | Labour | Labour | ||
| Hollingbury | 24 July 1997 | Labour | Labour | ||
| Portslade South | 7 May 1998 | Labour | Labour | ||
| Rottingdean | 7 May 1998 | Conservative | Conservative | ||
| Tenantry | 1 September 1999 | Labour | Labour | ||
| Goldsmid | 7 June 2001 | Conservative | Labour | ||
| Patcham | 11 April 2002 | Conservative | Conservative | ||
| Westdene | 16 May 2002 | Conservative | Conservative | ||
| Hangleton and Knoll | 7 October 2004 | Labour | Conservative | ||
| Regency | 13 December 2007 | Green | Green | ||
| Goldsmid | 23 July 2009 | Conservative | Green | ||
| St Peter's and North Laine | 8 July 2010 | Green | Green | ||
| Westbourne | 22 December 2011 | Conservative | Conservative | ||
| East Brighton | 18 October 2012 | Labour | Labour | ||
| Hanover and Elm Grove | 11 July 2013 | Green | Labour | ||
| East Brighton | 4 August 2016 | Labour | Labour | ||
| East Brighton | 8 February 2018 | Labour | Labour | ||
1995–1999
| Party | Candidate | Votes | % | ± | |
|---|---|---|---|---|---|
| Labour | 2,054 | 43.5 | -2.3 | ||
| Conservative | 1,771 | 37.5 | -2.2 | ||
| Hove Conservative | 562 | 11.9 | +11.9 | ||
| Green | 255 | 5.4 | -0.8 | ||
| Natural Law | 84 | 1.8 | +1.8 | ||
| Majority | 283 | 6.0 | |||
| Turnout | 4,726 | ||||
| Labour hold | Swing | ||||
| Party | Candidate | Votes | % | ± | |
|---|---|---|---|---|---|
| Labour | 1,131 | 60.8 | -6.3 | ||
| Conservative | 432 | 23.2 | +9.6 | ||
| Green | 101 | 5.4 | -4.4 | ||
| Independent | 95 | 5.1 | +5.1 | ||
| Liberal Democrats | 68 | 3.7 | -5.7 | ||
| Socialist Labour | 32 | 1.7 | +1.7 | ||
| Majority | 699 | 37.6 | |||
| Turnout | 1,859 | ||||
| Labour hold | Swing | ||||
| Party | Candidate | Votes | % | ± | |
|---|---|---|---|---|---|
| Labour | Les Hamilton | 1,290 | 62.5 | +3.2 | |
| Conservative | Ted Kemble | 483 | 23.4 | -2.7 | |
| Liberal Democrats | Nigel Donovan | 217 | 10.5 | -0.6 | |
| Green | Nigel Baker | 74 | 3.6 | +0.1 | |
| Majority | 807 | 39.1 | |||
| Turnout | 1,990 | 30.0 | |||
| Labour hold | Swing | ||||
| Party | Candidate | Votes | % | ± | |
|---|---|---|---|---|---|
| Conservative | David Smith | 1,724 | 58.8 | +6.1 | |
| Labour | Mark Bunting | 803 | 27.4 | +3.8 | |
| Liberal Democrats | Harold de Souza | 319 | 10.9 | -3.3 | |
| Green | Peter Poole | 84 | 2.9 | -0.5 | |
| Majority | 921 | 31.4 | |||
| Turnout | 2,930 | 38.0 | |||
| Conservative hold | Swing | ||||
1999–2003
| Party | Candidate | Votes | % | ± | |
|---|---|---|---|---|---|
| Labour | 789 | 51.9 | -4.2 | ||
| Conservative | 383 | 25.2 | +7.8 | ||
| Green | 147 | 9.7 | -7.5 | ||
| Independent | 117 | 7.7 | +7.7 | ||
| Liberal Democrats | 52 | 3.4 | -6.0 | ||
| Independent | 33 | 2.2 | +2.2 | ||
| Majority | 406 | 26.7 | |||
| Turnout | 1,521 | 19.5 | |||
| Labour hold | Swing | ||||
| Party | Candidate | Votes | % | ± | |
|---|---|---|---|---|---|
| Labour | Vincent Meegan | 1,690 | 37.0 | -16.2 | |
| Conservative | 1,640 | 35.9 | +0.2 | ||
| Liberal Democrats | 577 | 12.6 | +12.6 | ||
| Green | 481 | 10.5 | -0.6 | ||
| ProLife Alliance | 119 | 2.6 | +2.6 | ||
| UKIP | 57 | 1.2 | +1.2 | ||
| Majority | 50 | 1.1 | |||
| Turnout | 4,564 | ||||
| Labour gain from Conservative | Swing | ||||
| Party | Candidate | Votes | % | ± | |
|---|---|---|---|---|---|
| Conservative | Brian Pidgeon | 1,352 | 59.5 | +4.3 | |
| Labour | Elizabeth Stewart | 463 | 20.5 | -10.1 | |
| Liberal Democrats | Trefor Hunter | 336 | 14.9 | +6.6 | |
| Green | Elizabeth Wakefield | 107 | 4.7 | -0.9 | |
| Majority | 889 | 39.0 | |||
| Turnout | 2,258 | 32.1 | |||
| Conservative hold | Swing | ||||
| Party | Candidate | Votes | % | ± | |
|---|---|---|---|---|---|
| Conservative | Ken Norman | 1,347 | 55.5 | +3.2 | |
| Labour | Malcolm Prescott | 645 | 26.6 | -0.9 | |
| Liberal Democrats | Don McBeth | 234 | 9.6 | +0.1 | |
| Green | Richard Mallender | 199 | 8.2 | -2.5 | |
| Majority | 702 | 28.9 | |||
| Turnout | 2,425 | 31.0 | |||
| Conservative hold | Swing | ||||
2003–2007
| Party | Candidate | Votes | % | ± | |
|---|---|---|---|---|---|
| Conservative | Dawn Barnett | 1,535 | 42.1 | +3.4 | |
| Labour | Eddy Sears | 1,165 | 32.0 | -8.3 | |
| Liberal Democrats | Mark Barnard | 618 | 17.0 | +8.8 | |
| Green | Elizabeth Wakefield | 170 | 4.7 | -2.4 | |
| Independent | Janet Berridge-Brown | 156 | 4.3 | +1.9 | |
| Majority | 370 | 10.1 | |||
| Turnout | 3,644 | 35.3 | |||
| Conservative gain from Labour | Swing | ||||
2007–2011
| Party | Candidate | Votes | % | ± | |
|---|---|---|---|---|---|
| Green | Jason Kitcat | 749 | 41.6 | +8.7 | |
| Conservative | Robert Nemeth | 397 | 22.1 | +2.1 | |
| Labour | Delia Forester | 376 | 20.9 | -0.6 | |
| Liberal Democrats | Simon Doyle | 148 | 8.2 | -9.1 | |
| Independent | Tony Davenport | 130 | 7.2 | -1.1 | |
| Majority | 352 | 19.5 | |||
| Turnout | 1,800 | 23.0 | |||
| Green hold | Swing | ||||
| Party | Candidate | Votes | % | ± | |
|---|---|---|---|---|---|
| Green | Alexandra Phillips | 1,456 | 38.5 | +17.2 | |
| Conservative | Andrew Wealls | 1,104 | 29.1 | +1.1 | |
| Labour | Lis Telcs | 816 | 21.6 | -4.4 | |
| Liberal Democrats | Howard Spencer | 280 | 7.4 | -7.8 | |
| UKIP | Maria McCallum | 129 | 3.4 | +3.4 | |
| Majority | 352 | 9.3 | |||
| Turnout | 3,792 | 32.9 | -4.6 | ||
| Green gain from Conservative | Swing | ||||
| Party | Candidate | Votes | % | ± | |
|---|---|---|---|---|---|
| Green | Lizzie Deane | 1,816 | 56.8 | +2.5% | |
| Labour | Tom French | 880 | 27.5 | +4.3% | |
| Conservative | Rob Buckwell | 365 | 11.4 | -0.7% | |
| Liberal Democrats | Trefor Hunter | 103 | 3.2 | -4.9% | |
| Independent | Gerald O’Brien | 32 | 1.0 | -1.3% | |
| Majority | 936 | 29.3 | -1.8% | ||
| Turnout | 3,196 | 24.1 | -10% | ||
| Green hold | Swing | ||||
2011–2015
| Party | Candidate | Votes | % | ± | |
|---|---|---|---|---|---|
| Conservative | Graham Cox | 1,027 | 39.3 | +0.9 | |
| Labour | Nigel Jenner | 826 | 31.6 | +2.2 | |
| Green | Louisa Greenbaum | 645 | 24.6 | +0.1 | |
| Liberal Democrats | Gareth Jones | 45 | 1.7 | -5.5 | |
| UKIP | Paul Perrin | 36 | 1.4 | +1.4 | |
| TUSC | Pip Tindall | 20 | 0.8 | +0.8 | |
| The European Citizens Party | Susan Collard | 13 | 0.5 | -0.1 | |
| Majority | 201 | 7.7 | |||
| Turnout | 2,612 | 35.0 | -10.5% | ||
| Conservative hold | Swing | ||||
| Party | Candidate | Votes | % | ± | |
|---|---|---|---|---|---|
| Labour | Chaun Wilson | 1596 | 56.1 | +6.59 | |
| Conservative | Joe Miller | 531 | 18.6 | -4.36 | |
| Green | Carlie Nicole Goldsmith | 456 | 16.0 | -5.49 | |
| UKIP | Sabiha Choudhury | 148 | 5.2 | +5.2 | |
| Liberal Democrats | Dominic Felix Sokalski | 59 | 2.1 | -2.78 | |
| TUSC | Jon Redford | 55 | 1.9 | +0.63 | |
| Majority | 1,065 | 37.3 | |||
| Turnout | 2,857 | 26.2% | -13.3% | ||
| Labour hold | Swing | ||||
| Party | Candidate | Votes | % | ± | |
|---|---|---|---|---|---|
| Labour | Emma Daniel | 1396 | 39.8 | +8.00 | |
| Green | David Stuart Gibson | 1358 | 38.7 | -14.43 | |
| Conservative | Robert John Knight | 275 | 7.8 | -1.02 | |
| UKIP | Patricia Ann Mountain | 250 | 7.1 | +7.13 | |
| TUSC | Phil Clarke | 172 | 4.9 | +1.88 | |
| Liberal Democrats | Lev Eakins | 56 | 1.6 | -1.56 | |
| Majority | 38 | 1.1 | |||
| Turnout | 3,520 | 29.2% | |||
| Labour gain from Green | Swing | ||||
2015-2019
| Party | Candidate | Votes | % | ± | |
|---|---|---|---|---|---|
| Labour | Lloyd Russell-Moyle | 1,488 | 57.5 | +11.1 | |
| Conservative | David Plant | 514 | 19.9 | -2.6 | |
| Green | Mitch Alexander | 286 | 11.1 | -8.5 | |
| UKIP | Leigh Farrow | 152 | 5.9 | N/A | |
| Liberal Democrats | Andrew England | 116 | 4.5 | -3.4 | |
| Independent | Ramon Sammut | 31 | 1.2 | N/A | |
| Majority | 974 | 37.6 | |||
| Turnout | 2,594 | 24.48 | |||
| Labour hold | Swing | ||||
| Party | Candidate | Votes | % | ± | |
|---|---|---|---|---|---|
| Labour | Nancy Platts | 1,889 | 67.5 | +10.0 | |
| Conservative | Edward Wilson | 481 | 17.2 | -2.7 | |
| Green | Ed Baker | 316 | 11.3 | +0.2 | |
| Liberal Democrats | George Taylor | 114 | 4.1 | -0.4 | |
| Majority | 1,408 | 50.3 | |||
| Turnout | 2,800 | 27.34 | |||
| Labour hold | Swing | ||||
References
- "Brighton & Hove". BBC News Online. Retrieved 8 October 2009.
- "Go Green for first Green-led council in UK". www.greenparty.org.uk. Retrieved 20 December 2016.
- legislation.gov.uk - The City of Brighton and Hove (Electoral Changes) Order 2001. Retrieved on 4 October 2015.
- "Your Local Councillors". Brighton & Hove City Council. Archived from the original on 30 January 2009. Retrieved 8 October 2009.
- "Councillors & Meetings". Brighton & Hove City Council. Archived from the original on 25 August 2009. Retrieved 8 October 2009.
- "Vote 2003 – Local elections – Brighton & Hove". BBC News. Retrieved 23 August 2010.
- "Council election results 2007". Brighton & Hove City Council. Archived from the original on 9 October 2007. Retrieved 23 August 2010.
- "How you voted". The Argus. Brighton. 8 May 1998. p. 12.
- "Tories win city by-election". The Argus. 12 April 2002. Retrieved 8 October 2009.
- "Byelection woe for Labour". guardian.co.uk. 17 May 2002. Retrieved 8 October 2009.
- "Tories make post-conference council gains". guardian.co.uk. 8 October 2004. Retrieved 8 October 2009.
- "Greens win Regency by-election". The Argus. 13 December 2007. Retrieved 8 October 2009.
- "Regency Ward By-Election". Brighton & Hove City Council. Retrieved 8 October 2009.
- "Brighton and Hove Greens win key Goldsmid council by-election". The Argus. 24 July 2009. Retrieved 8 October 2009.
- "Greens retain seat at Brighton and Hove City Council by-election". The Argus. 9 July 2010. Retrieved 9 July 2010.
- "Declaration of Result of Poll – Westbourne" (PDF). Brighton and Hove City Council. 22 December 2011. Archived from the original (PDF) on 31 August 2012. Retrieved 23 December 2011.
- "Declaration of Result of Poll – East Brighton" (PDF). Brighton and Hove City Council. 18 October 2012. Retrieved 25 October 2012.
- "Labour holds East Brighton in by-election". brightonandhovenews.org. 5 August 2016. Retrieved 12 April 2018.
- "East Brighton ward by-election 2018 - Brighton & Hove City Council". www.brighton-hove.gov.uk. Retrieved 12 April 2018.
External links
| East Sussex County Council | |
|---|---|
| Brighton and Hove City Council | |
| Eastbourne Borough Council | |
| Hastings Borough Council | |
| Lewes District Council | |
| Rother District Council | |
| Wealden District Council | |
| Brighton Borough Council |
|
| Hove Borough Council |
|
| |
City of Brighton and Hove | |||||||||||||
|---|---|---|---|---|---|---|---|---|---|---|---|---|---|
| Topics | |||||||||||||
| Events | |||||||||||||
| Culture | |||||||||||||
| Politics | |||||||||||||
| Transport |
| ||||||||||||
| Media | |||||||||||||
| Sport |
| ||||||||||||
| Buildings | |||||||||||||
| Parks | |||||||||||||
| Areas |
| ||||||||||||
| |||||||||||||
This article is issued from Wikipedia. The text is licensed under Creative Commons - Attribution - Sharealike. Additional terms may apply for the media files.