2020 Atlantic hurricane season
The 2020 Atlantic hurricane season is an ongoing event in the annual cycle of tropical cyclone formation. The season officially started on June 1 and ends on November 30, dates that conventionally delimit the period of each year when most tropical cyclones form in the Atlantic basin. However, the formation of tropical cyclones is possible at any time, as shown by the formations of Tropical Storms Arthur and Bertha, on May 16 and 27, respectively, marking the sixth consecutive year with pre-season systems. This also marks the first time since 2016 that two or more named storms developed before the start of the season, and the first time since 2012 that two or more named storms formed in the month of May. In addition, this is the first season in the satellite era to have three systems form before or on June 1, as well as being the season with the earliest third named storm on record, upon the naming of Tropical Storm Cristobal on June 2. The previous record was held by 2016's Tropical Storm Colin, which formed on June 5. Later, on June 23, Tropical Storm Dolly was named, becoming the third earliest fourth named storm on record, behind 2012's Tropical Storm Debby and 2016's Tropical Storm Danielle.
| 2020 Atlantic hurricane season | |
|---|---|
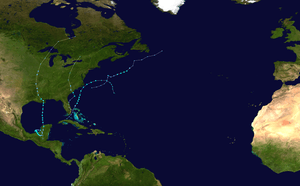 Season summary map | |
| Seasonal boundaries | |
| First system formed | May 16, 2020 |
| Last system dissipated | Season ongoing |
| Strongest storm | |
| Name | Arthur |
| • Maximum winds | 60 mph (95 km/h) (1-minute sustained) |
| • Lowest pressure | 991 mbar (hPa; 29.26 inHg) |
| Seasonal statistics | |
| Total depressions | 4 |
| Total storms | 4 |
| Hurricanes | 0 |
| Major hurricanes (Cat. 3+) | 0 |
| Total fatalities | 5 total |
| Total damage | > $543 million (2020 USD) |
| Related articles | |
Due to the ongoing COVID-19 pandemic, officials in the United States have expressed concerns about the hurricane season potentially exacerbating the effects of the pandemic.[1] Evacuations would be significantly hindered due to fears of contracting the virus and social distancing rules would break down when giving aid to hurricane-affected areas.
Seasonal forecasts
| Source | Date | Named storms |
Hurricanes | Major hurricanes |
Ref |
| Average (1981–2010) | 12.1 | 6.4 | 2.7 | [2] | |
| Record high activity | 28 | 15 | 7 | [3] | |
| Record low activity | 4 | 2† | 0† | [3] | |
| ––––––––––––––––––––––––––––––––––––––––––––––––––––––– | |||||
| TSR | December 19, 2019 | 15 | 7 | 4 | [4] |
| CSU | April 2, 2020 | 16 | 8 | 4 | [5] |
| TSR | April 7, 2020 | 16 | 8 | 3 | [6] |
| UA | April 13, 2020 | 19 | 10 | 5 | [7] |
| TWC | April 15, 2020 | 18 | 9 | 4 | [8] |
| NCSU | April 17, 2020 | 18–22 | 8–11 | 3–5 | [9] |
| SMN | May 20, 2020 | 15–19 | 7–9 | 3–4 | [10] |
| UKMO* | May 20, 2020 | 13* | 7* | 3* | [11] |
| NOAA | May 21, 2020 | 13–19 | 6–10 | 3–6 | [12] |
| TSR | May 28, 2020 | 17 | 8 | 3 | [13] |
| CSU | June 4, 2020 | 19 | 9 | 4 | [14] |
| UA | June 12, 2020 | 17 | 11 | 4 | [15] |
| ––––––––––––––––––––––––––––––––––––––––––––––––––––––– | |||||
| Actual activity |
4 | 0 | 0 | ||
| * June–November only † Most recent of several such occurrences. (See all) | |||||
Forecasts of hurricane activity are issued before each hurricane season by noted hurricane experts such as Philip J. Klotzbach and his associates at Colorado State University; and separately by NOAA forecasters.
Klotzbach's team (formerly led by William M. Gray) defined the average (1981 to 2010) hurricane season as featuring 12.1 tropical storms, 6.4 hurricanes, 2.7 major hurricanes (storms reaching at least Category 3 strength in the Saffir-Simpson Hurricane Scale), and an accumulated cyclone energy (ACE) index of 106 units.[5] NOAA defines a season as above-normal, near-normal or below-normal by a combination of the number of named storms, the number reaching hurricane strength, the number reaching major hurricane strength, and the ACE Index.[16]
Pre-season forecasts
On December 19, 2019, Tropical Storm Risk (TSR), a public consortium consisting of experts on insurance, risk management, and seasonal climate forecasting at University College London, issued an extended-range forecast predicting a slightly above-average hurricane season. In its report, the organization called for 15 named storms, 7 hurricanes, 4 major hurricanes, and an ACE index of 105 units. This forecast was based on the prediction of near-average trade winds and slightly warmer than normal sea surface temperatures (SSTs) across the tropical Atlantic as well as a neutral El Niño–Southern Oscillation (ENSO) phase in the equatorial Pacific.[4] On April 2, 2020, forecasters at Colorado State University echoed predictions of an above-average season, forecasting 16 named storms, 8 hurricanes, 4 major hurricanes, and an ACE index of 150 units. The organization posted significantly heightened probabilities for hurricanes tracking through the Caribbean and hurricanes striking the U.S. coastline.[5] TSR updated their forecast on April 7, predicting 16 named storms, 8 hurricanes, 3 major hurricanes, and an ACE index of 130 units.[6] On April 13, the University of Arizona (UA) predicted a potentially hyperactive hurricane season: 19 named storms, 10 hurricanes, 5 major hurricanes, and accumulated cyclone energy index of 163 units.[7] A similar prediction of 18 named storms, 9 hurricanes, and 4 major hurricanes was released by The Weather Company on April 15.[8] Following that, the North Carolina State University released a similar forecast on April 17, also calling for a possibly hyperactive season with 18–22 named storms, 8–11 hurricanes and 3–5 major hurricanes.[9]
On May 20, Mexico's Servicio Meteorológico Nacional released their forecast for an above-average season with 15–19 named storms, 7–9 hurricanes and 3–4 major hurricanes.[10] The UK Met Office released their outlook that same day, predicting average activity with 13 tropical storms, 7 hurricanes, and 3 major hurricanes expected to develop between June and November 2020. They also predicted an ACE index of around 110 units.[11] NOAA issued their forecast on May 21, calling for a 60% chance of an above-normal season with 13–19 named storms, 6–10 hurricanes, 3–6 major hurricanes, and an ACE index between 110% and 190% of the median. They cited the ongoing warm phase of the Atlantic Multidecadal Oscillation and the expectation of continued ENSO-neutral or even La Niña conditions during the peak of the season as factors that would increase activity.[12]
Seasonal summary
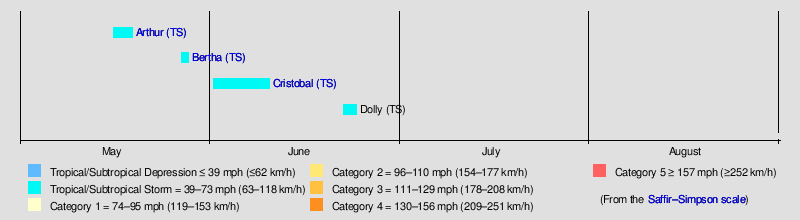
Tropical cyclogenesis began in the month of May, with Tropical Storms Arthur and Bertha. This was the first occurrence of two pre-season tropical storms in the Atlantic since 2016. The season's third tropical storm named Cristobal formed on June 1, coinciding with the official start of the Atlantic hurricane season. Later, Tropical Storm Dolly formed on June 22, not being named until the next day.
The accumulated cyclone energy (ACE) index for the 2020 Atlantic hurricane season, as of 03:00 UTC June 24, is 5.4025 units.[nb 1] Broadly speaking, ACE is a measure of the power of a tropical or subtropical storm multiplied by the length of time it existed. It is only calculated for full advisories on specific tropical and subtropical systems reaching or exceeding wind speeds of 39 mph (63 km/h).
Systems
Tropical Storm Arthur
| Tropical storm (SSHWS) | |
  | |
| Duration | May 16 – May 19 |
|---|---|
| Peak intensity | 60 mph (95 km/h) (1-min) 991 mbar (hPa) |
On May 12, the National Hurricane Center noted an area of low pressure was expected to develop over subsequent days northeast of the Bahamas.[17] Early on May 14, the NHC began to monitor an area of shower and thunderstorm activity over the Straits of Florida for development.[18] The system moved generally northeast into the region of the Bahamas while steadily organizing, becoming the season's first tropical depression at 21:00 UTC on May 16.[19] Another reconnaissance aircraft investigated the system several hours later and found supporting evidence for the NHC to upgrade the depression to Tropical Storm Arthur at 03:00 UTC on May 17.[20] Featuring the formation of a pre-season tropical storm, the 2020 Atlantic hurricane season became the sixth consecutive season with a tropical cyclone before the official June 1 start date.[21] The system managed to intensify slightly off the coast of Florida and Georgia. Even though the system was moving through the warmest waters of the Gulf Stream,[22] the satellite appearance began to degrade as it neared the coast of North Carolina, plagued by dry air and moderate wind shear.[23] However, Arthur reorganized early on May 18 and even strengthened slightly before making a close pass to the Outer Banks.[24] Later that day, the storm moved into an area of higher wind shear, exposing its center of circulation and marking the beginning of its extratropical transition,[25] a process Arthur completed by 15:00 UTC May 19, well east of southern Virginia.[26]
Passing within 20 nautical miles of the Outer Banks, the storm caused tropical storm force wind gusts and a single report of sustained tropical storm force winds at Alligator River Bridge.[25]
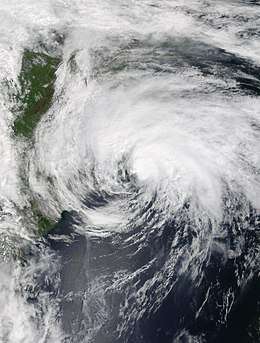
Tropical Storm Bertha
| Tropical storm (SSHWS) | |
  | |
| Duration | May 27 – May 28 |
|---|---|
| Peak intensity | 50 mph (85 km/h) (1-min) 1004 mbar (hPa) |
On May 25, the NHC began to track thunderstorms associated with an elongated surface trough located over Florida and the adjoining Atlantic Ocean for potential development into a tropical cyclone, but did not expect formation due to strong upper-level winds.[27] However, contrary to predictions, the system organized after moving northwards, which in turn was contributed to an increase convection and winds within the system. Based on NWS Doppler radar data from Charleston and buoy data, the NHC initiated advisories on Tropical Storm Bertha at 12:00 UTC on May 27.[28] Bertha continued to strengthen despite its proximity to land.[29] One hour after the first advisory was issued, Bertha made landfall on the South Carolina coast with winds of 50 mph (80 km/h).[29] From formation until landfall, Bertha had an unusually small field of gale-force winds, stretching only 25 miles from the center.[30] Bertha began to weaken rapidly once inland, becoming a tropical depression just hours after landfall.[31] Bertha quickly degenerated to a post-tropical remnant over West Virginia at 9:00 UTC on May 28.[32] Bertha quickly enlarged as it became extratropical. Its remnants caused heavy rainfall and thunderstorms in the Great Lakes region before being absorbed by a larger extratropical system on May 29.
The precursor disturbance to Bertha caused a significant, multi-day rainfall event across South Florida, with accumulations of 8–10 in (200–250 mm) across several locations, and with a maximum 72-hour accumulation of 14.19 in (360 mm) in Miami.[33] The city observed a 24-hour total of 7.4 in (190 mm), more than doubling the previous daily rainfall record.[34] In and around Miami, the rains flooded homes and roadways, especially in close proximity to canals.[35] Some homes even reported partial roof collapses throughout Hallandale Beach and Hollywood as a result of the heavy precipitation.[36] Local police in El Portal asked that the South Florida Water Management District open floodgates to relieve flooding in those canals.[37] In Hialeah, several vehicles were stranded in flooded roadways, prompting several water rescues.[35] Days of heavy rainfall prompted local National Weather Service offices to issue flash flood warnings, and sporadic severe thunderstorms prompted additional advisories. An EF1 tornado caused primarily tree and fencing damage in southern Miami, though several campers were also overturned.[38] Gusts associated with the disturbance in Florida topped out at 51 mph (82 km/h) near Key Biscayne.[39] Even as the system progressed north away from Florida, the outer fringes of Bertha contributed to stormy weather across the state on May 27, forcing the postponement of the planned Crew Dragon Demo-2 launch.[40] In South Carolina, one death occurred by drowning due to rip currents.[41] One death, a drowning, related to rip currents in Myrtle Beach[42] and USD$200 million in damage were caused by Bertha.[43]
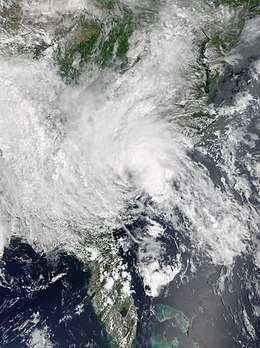
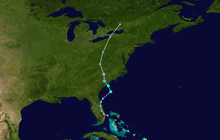
Tropical Storm Cristobal
| Tropical storm (SSHWS) | |
 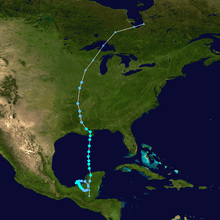 | |
| Duration | June 1 – June 10 |
|---|---|
| Peak intensity | 60 mph (95 km/h) (1-min) 992 mbar (hPa) |
On May 31, the NHC started to note that Tropical Depression Two-E in the Eastern Pacific, later to be known as Tropical Storm Amanda, would have the potential to redevelop in the Bay of Campeche.[44] Amanda would then make landfall in Guatemala, its low-level circulation dissipating by 21:00 UTC that day. Its remnants moved north-northwest to the Bay of Campeche and began to re-develop over the Yucatan Peninsula.[45] At 21:00 UTC on June 1, the remnants of Amanda redeveloped into Tropical Depression Three over the Bay of Campeche. The depression very slowly moved west over the Bay of Campeche and intensified into a tropical storm at 15:15 UTC June 2, and it was named Cristobal.[46][47] This marked the earliest third named storm in the Atlantic, beating the previous record set by Tropical Storm Colin which became a tropical storm on June 5, 2016.[48] Throughout the remainder of the day, Cristobal's windfield became more symmetrical and well defined,[49] and it gradually strengthened with falling barometric pressure as the storm meandered towards the Mexican coastline.[50] Cristobal made landfall as a strong tropical storm just west of Ciudad del Carmen at 13:35 UTC on June 3 at its peak intensity of 60 mph (95 km/h).[51] Cristobal moved very slowly inland, and it weakened back down to tropical depression status as the overall structure of the storm deteriorated while it remained quasi-stationary over southeastern Mexico.[52]
The storm began accelerating northwards on June 5 as an arced band of convection began to develop over the northern and eastern sides of the storm.[53] By 18:00 UTC that day, despite being situated inland over the Yucatan peninsula, Cristobal had reintensified back to tropical storm status.[54] As Cristobal moved further north into the Gulf of Mexico, dry air and interaction with a upper-level trough to the east began to strip Cristobal of any central convection, with most of the convection being displaced east and north of the center.[55][56] Just after 22:00 UTC on June 7, Cristobal made landfall over southeastern Louisiana. Cristobal weakened to a tropical depression the next day as it moved inland over the state.[57] Cristobal, however, survived as a depression as it moved up the Mississippi River Valley until finally becoming extratropical at 3:00 UTC on June 10 over Iowa.[58]
On June 1, the government of Mexico issued a tropical storm warning from Campeche westward to Puerto de Veracruz.[59] Residents at risk were evacuated. 9,000 Mexican National Guard members were summoned to aid in preparations and repairs.[60] Significant rain fell across much of Southern Mexico and Central America. Wave heights up to 9.8 ft (3 m) high closed ports for several days. In El Salvador, a mudslide caused 7 people to go missing. Up to 9.6 in (243 mm) of rain fell in the Yucatan Peninsula, flooding sections of a highway. Street flooding occurred as far away as Nicaragua.[60] On June 5, while Cristobal was still a tropical depression, a tropical storm watch was issued from Punta Herrero to Rio Lagartos by the government of Mexico[61] as well as for another area from Intracoastal City, Louisiana to the Florida-Alabama border, issued by the National Weather Service.[62] These areas were later upgraded to warnings and for the Gulf Coast, the warning was extended to the Okaloosa/Walton County line.
Tropical Storm Dolly
| Tropical storm (SSHWS) | |
 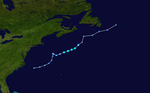 | |
| Duration | June 22 – June 24 |
|---|---|
| Peak intensity | 45 mph (75 km/h) (1-min) 1002 mbar (hPa) |
On June 19, the NHC began monitoring an area of disturbed weather off the Southeastern US coast for possible subtropical development in the short-term.[63] Slowly moving northwest, the system developed into a more defined non-tropical low pressure system by early on June 21.[64] However at the time, the low pressure system was not considered likely to develop due to unfavorable sea surface temperatures.[65] The system's circulation slowly grew more defined throughout the day and some thunderstorms began to develop near the circulation, but the system exited the warmer waters of the Gulf Stream later that same evening and began to lose any convection that developed.[66] Contrary to predictions, the low moved south back into the Gulf Stream in the afternoon of June 22 after struggling to develop convection, and new thunderstorm activity began to fire near the circulation.[67] The low's convective activity rapidly became more defined and well-organized while the circulation became closed, prompting the National Hurricane Center to upgrade the system into Subtropical Depression Four at around 21:00 UTC on June 22.[68] On June 23, the system's wind field had contracted significantly, becoming more characteristic of a tropical cyclone, while also strengthening further with winds to gale force, allowing the NHC to upgrade the system and designate it as Tropical Storm Dolly at approximately 16:15 UTC with winds of 45 mph (75 km/h).[69] This event marked the third earliest occurrence of the fourth named storm in the calendar year on record, behind only Tropical Storm Debby of 2012 and Tropical Storm Danielle of 2016.[3][70] Dolly was also the farthest north forming system on record before July 1 in the Atlantic, and the second farthest north forming named storm on record in the North Atlantic before August 1.[71] However, Dolly's peak intensity proved to be short lived as its central convection began to diminish while it drifted over colder ocean waters, and the storm consequently weakened.[72] At 15:00 UTC on June 24, Dolly became a post-tropical cyclone, with any remaining convection displaced well to the system's south and the remaining circulation exposed.[73]
Storm names
The following list of names will be used for named storms that form in the North Atlantic in 2020. Retired names, if any, will be announced by the World Meteorological Organization during the joint 42nd and 43rd Sessions of the RA IV Hurricane Committee in the spring of 2021 (in concurrence with any names from the 2019 season).[74] The names not retired from this list will be used again in the 2026 season. This is the same list used in the 2014 season, as no names were retired from that year.
|
|
Season effects
This is a table of all of the storms that have formed in the 2020 Atlantic hurricane season. It includes their duration, names, landfall(s) – denoted by bold location names, damages, and death totals. Deaths in parentheses are additional and indirect (an example of an indirect death would be a traffic accident), but were still related to that storm. Damage and deaths include totals while the storm was extratropical, a wave, or a low, and all of the damage figures are in 2020 USD.
| Saffir–Simpson scale | ||||||
| TD | TS | C1 | C2 | C3 | C4 | C5 |
| Storm name |
Dates active | Storm category
at peak intensity |
Max 1-min wind mph (km/h) |
Min. press. (mbar) |
Areas affected | Damage (USD) |
Deaths | Refs | ||
|---|---|---|---|---|---|---|---|---|---|---|
| Arthur | May 16 – 19 | Tropical storm | 60 (95) | 991 | Florida, The Bahamas, North Carolina, Bermuda | Minimal | None | |||
| Bertha | May 27 – 28 | Tropical storm | 50 (85) | 1004 | Florida, The Bahamas, East Coast of the United States | >$200 million | 1 | [43][41] | ||
| Cristobal | June 1 – 10 | Tropical storm | 60 (95) | 992 | Central America, Mexico, Central United States, Eastern Canada | $343 million | 4 | [75][76][77] | ||
| Dolly | June 22 – 24 | Tropical storm | 45 (75) | 1002 | New England, Bermuda, Canada | None | None | |||
| Season aggregates | ||||||||||
| 4 systems | May 16 – Present | 60 (95) | 991 | >$543 million | 5 | |||||
See also
- Tropical cyclones in 2020
- Atlantic hurricane season
- 2020 Pacific hurricane season
- 2020 Pacific typhoon season
- 2020 North Indian Ocean cyclone season
- South-West Indian Ocean cyclone seasons: 2019–20, 2020–21
- Australian region cyclone seasons: 2019–20, 2020–21
- South Pacific cyclone seasons: 2019–20, 2020–21
Notes
- The totals represent the sum of the squares for every (sub)tropical storm's intensity of over 33 knots (38 mph, 61 km/h), divided by 10,000. Calculations are provided at Talk:2020 Atlantic hurricane season/ACE calcs.
References
- McGrath, Kimberly Miller and Gareth. "Hurricanes in a pandemic: 'Absolutely that's our nightmare scenario'". USA TODAY. Retrieved April 4, 2020.
- "Background Information: The North Atlantic Hurricane Season". Climate Prediction Center. National Oceanic and Atmospheric Administration. August 9, 2012. Retrieved December 13, 2019.
- "Atlantic hurricane best track (HURDAT version 2)" (Database). United States National Hurricane Center. May 25, 2020.
- Mark Saunders; Adam Lea (December 19, 2019). "Extended Range Forecast for Atlantic Hurricane Activity in 2020" (PDF). University College London. Tropical Storm Risk. Retrieved December 19, 2019.
- Phil Klotzbach; Michael Bell; Jhordanne Jones (April 2, 2020). Extended Range Forecast of Atlantic Seasonal Hurricane Activity and Landfall Strike Probability for 2020 (PDF) (Report). Colorado State University. Retrieved April 2, 2020.
- Mark Saunders; Adam Lea (April 7, 2020). "April Forecast Update for North Atlantic Hurricane Activity in 2020" (PDF). University College London. Tropical Storm Risk. Retrieved April 8, 2020.
- Kyle Davis; Xubin Zeng (April 14, 2020). "University of Arizona (UA) April Forecast for North Atlantic Hurricane Activity in 2020" (PDF). University of Arizona. University of Arizona. Retrieved April 14, 2020.
- Brian Donegan; Jonathan Belles (April 16, 2020). "2020 Atlantic Hurricane Season Expected to Be More Active Than Usual, The Weather Company Outlook Says". The Weather Channel. Retrieved April 16, 2020.
- Tracey Peake; Lian Xie (April 17, 2020). "2020 Hurricane Season Will Be Active, NC State Researchers Predict". North Carolina State University. Retrieved April 17, 2020.
- "Pronóstico de Ciclones Tropicales 2020". SMN. May 20, 2020. Retrieved May 20, 2020.
- "North Atlantic tropical storm seasonal forecast 2020". Met Office. May 20, 2020. Retrieved May 20, 2020.
- "NOAA 2020 Atlantic Hurricane Season Outlook". Climate Prediction Center. May 21, 2020. Retrieved May 21, 2020.
- "Pre-Season Forecast for North Atlantic Hurricane Activity in 2020" (PDF). Tropical Storm Risk. May 28, 2020. Retrieved May 28, 2020.
- "EXTENDED RANGE FORECAST OF ATLANTIC SEASONAL HURRICANE ACTIVITY AND LANDFALL STRIKE PROBABILITY FOR 2020" (PDF). Colorado State University. June 4, 2020. Retrieved June 4, 2020.
- Kyle Davis; Xubin Zeng (June 12, 2020). "University of Arizona (UA) June Forecast for North Atlantic Hurricane Activity in 2020". University of Arizona. Retrieved June 13, 2020.
- "NOAA's Atlantic Hurricane Season Classifications". National Oceanic and Atmospheric Administration. National Hurricane Center. May 22, 2008. Retrieved December 13, 2019.
- Andrew Latto (May 12, 2020). "NHC Graphical Outlook Archive". National Hurricane Center. Retrieved May 16, 2020.
- Daniel Brown (May 14, 2020). "NHC Graphical Outlook Archive". National Hurricane Center. Retrieved May 16, 2020.
- John Cangialosi (May 16, 2020). "Tropical Depression One Discussion Number 1". National Hurricane Center. Retrieved May 16, 2020.
- Stacy Stewart (May 16, 2020). "Tropical Storm Arthur Discussion Number 2". National Hurricane Center. Retrieved May 16, 2020.
- "Tropical Storm Arthur Forms Off Southeast Coast; Tropical Storm Watch Issued". The Weather Channel. May 16, 2020. Retrieved May 16, 2020.
- "Tropical Storm Arthur Discussion 6". nhc.noaa.gov. Retrieved May 18, 2020.
- "Tropical Storm Arthur Discussion 5". nhc.noaa.gov. Retrieved May 18, 2020.
- "Tropical Storm Arthur Discussion 8". nhc.noaa.gov. Retrieved May 18, 2020.
- "Tropical Storm Arthur Forecast Discussion". nhc.noaa.gov. Retrieved May 18, 2020.
- "Post-Tropical Cyclone Arthur Forecast Discussion". nhc.noaa.gov. Retrieved May 19, 2020.
- "NHC Graphical Outlook Archive". nhc.noaa.gov. Retrieved May 27, 2020.
- "Tropical Storm BERTHA". nhc.noaa.gov. Retrieved May 27, 2020.
- "Tropical Storm BERTHA". nhc.noaa.gov. Retrieved May 27, 2020.
- "Tropical Storm BERTHA". nhc.noaa.gov. Retrieved May 28, 2020.
- https://www.nhc.noaa.gov/text/refresh/MIATCPAT2+shtml/271746.shtml
- https://www.nhc.noaa.gov/text/refresh/MIAWPCAT2+shtml/280835.shtml
- 72-hour Precipitation Reports (Updated by County) (Report). Iowa Environmental Mesonet. National Weather Service Weather Forecast Office in Miami, Florida. May 27, 2020. Retrieved May 27, 2020.
- Lois Solomon; Victoria Ballard; Rafael Olmeda; Wayne Roustan (May 27, 2020). "Bertha downgraded to tropical depression; relentless rain to continue in saturated South Florida". Sun-Sentinel. Retrieved May 27, 2020.
- Christian De La Rosa; Liane Morejon (May 26, 2020). "Steady downpours bring costly flooding across South Florida". WPLG. Retrieved May 27, 2020.
- Liane Morejon; Janine Stanwood; Christian De La Rosa; Saira Anwer; Amanda Batchelor (May 25, 2020). "Flash flood warning in effect: South Floridians deal with rainfall, tornado, dangerous roads". WPLG. Retrieved May 27, 2020.
- Brent Cameron; Sheldon Fox; Katrina Bush (May 26, 2020). "Flooded streets in Broward, Miami-Dade cause multiple cars to stall as storms batter South Florida". WSVN. Retrieved May 27, 2020.
- NWS Damage Survey for 05/25/2020 Redlands Tornado Event Update 1 (Report). Iowa Environmental Mesonet. National Weather Service Weather Forecast Office in Miami, Florida. May 26, 2020. Retrieved May 27, 2020.
- 48-hour Highest Wind Reports (Report). Iowa Environmental Mesonet. National Weather Service Weather Forecast Office in Miami, Florida. May 26, 2020. Retrieved May 27, 2020.
- Jacob Bogage; Christian Davenport (May 27, 2020). "SpaceX's Falcon 9 rocket launch is scrubbed due to weather". The Washington Post. Retrieved May 27, 2020.
- Summer Dashe (May 27, 2020). "Drowning reported in Myrtle Beach Wednesday after Tropical Storm Bertha hit coast". Retrieved May 30, 2020.
- Anstaett, Colter (May 28, 2020). "More rain threatens parts of Henry County hit hard by weekend flash flooding". WSLS. Retrieved June 3, 2020.
- http://thoughtleadership.aonbenfield.com//Documents/20200609_analytics-if-may-global-recap.pdf?utm_source=slipcase&utm_medium=affiliate&utm_campaign=slipcase
- "NHC Graphical Outlook Archive". nhc.noaa.gov. Retrieved June 1, 2020.
- "NHC Graphical Outlook Archive". nhc.noaa.gov. Retrieved June 1, 2020.
- "Tropical Depression Three Forecast Discussion". nhc.noaa.gov. Retrieved June 2, 2020.
- "Tropical Storm Cristobal Update Statement". nhc.noaa.gov. Retrieved June 2, 2020.
- Phil Klotzbach [@philklotzbach] (June 2, 2020). "#Cristobal has formed in the Bay of Campeche - the 3rd Atlantic named storm of the 2020 season. This is the earliest date for an Atlantic 3rd named storm formation on record (since 1851). Old record was Colin on June 5, 2016" (Tweet). Retrieved June 2, 2020 – via Twitter.
- "Tropical Storm CRISTOBAL". nhc.noaa.gov. Retrieved June 3, 2020.
- "Tropical Storm CRISTOBAL". nhc.noaa.gov. Retrieved June 3, 2020.
- "Tropical Storm Cristobal Update Statement". nhc.noaa.gov. June 3, 2020. Retrieved June 3, 2020.
- "Tropical Depression Cristobal Forecast Discussion Number 12". nhc.noaa.gov. Retrieved June 4, 2020.
- "Tropical Depression Cristobal Forecast Discussion". nhc.noaa.gov. Retrieved June 5, 2020.
- "National Hurricane Center". web.archive.org. June 5, 2020. Retrieved June 5, 2020.
- "Tropical Storm Cristobal Discussion Number 19". National Hurricane Center.
- "Tropical Storm Cristobal Discussion Number 21". National Hurricane Center.
- https://www.nhc.noaa.gov/text/refresh/MIATCDAT3+shtml/080836.shtml
- https://www.nhc.noaa.gov/archive/2020/al03/al032020.public.034.shtml?
- "National Hurricane Center". web.archive.org. June 1, 2020. Retrieved June 1, 2020.
- "Cristobal makes landfall in Mexico, could dump up to 30 inches of rain before heading for US".
- "Tropical Depression Cristobal Update Statement". nhc.noaa.gov. Retrieved June 5, 2020.
- "Tropical Depression Cristobal Public Advisory". nhc.noaa.gov. Retrieved June 5, 2020.
- "Tropical Weather Outlook 800 PM EDT Fri Jun 19 2020".
- "Tropical Weather Outlook 800 AM EDT Sun Jun 21 2020".
- Bianchi, Chris. "Tropics Update: Possible System in North Atlantic?". WeatherNation. Retrieved June 22, 2020.
- "Tropical Weather Outlook 800 PM EDT Sun Jun 21 2020".
- "Tropical Weather Outlook 200 PM EDT Mon Jun 22 2020".
- "Subtropical Depression Four Discussion Number 1". National Hurricane Center.
- Berg, Ronnie; Brown, Daniel P. (June 23, 2020). "Tropical Storm Dolly Update Statement". National Hurricane Center and Central Pacific Hurricane Center. National Oceanic and Atmospheric Administration. Retrieved June 23, 2020.
- Klotzbach, Philip [@philklotzbach] (June 23, 2020). "Dolly has formed in the North Atlantic - the 3rd earliest 4th Atlantic named storm formation on record (since 1851). Danielle is earliest on 6/20/2016. Debby is 2nd earliest on 6/23/2012 at 12 UTC. Dolly in 2020 formed on June 23 at 1615 UTC. hurricane" (Tweet). Retrieved June 23, 2020 – via Twitter.
- "https://twitter.com/splillo/status/1275472951815499777". Twitter. Retrieved June 23, 2020. External link in
|title=(help) - "Tropical Storm Dolly Public Advisory". nhc.noaa.gov. Retrieved June 24, 2020.
- "Post-Tropical Cyclone Dolly Discussion Number 9". nhc.noaa.gov. Retrieved June 24, 2020.
- "Why 2019's Hurricane Dorian Wasn't Retired by the World Meteorological Organization". The Weather Channel. Retrieved April 2, 2020.
- Ortiz, Graciela H.; Graniel, Gabriel (June 7, 2020). "Reportan dos muertos por afectaciones de "Cristóbal" en sureste". La Jordana (in Spanish). Retrieved June 8, 2020.
- "Tormenta tropical "Cristóbal" deja un muerto en Chiapas" (in Spanish). El Universal. June 4, 2020. Retrieved June 4, 2020.
- "Tropical Storm Cristobal spawns damaging tornado in Orlando; Louisiana brothers, 8 and 10, killed in rip current". FOX News. June 7, 2020. Retrieved June 7, 2020.
External links
| Wikimedia Commons has media related to 2020 Atlantic hurricane season. |