2019 Galway County Council election
A Galway County Council election was held in County Galway in Ireland on 24 May 2019 as part of that year's local elections. All 39 councillors were elected for a five-year term of office from 7 local electoral areas (LEAs) by single transferable vote.
| |||||||||||||||||||||||||||||||||||||
All 39 seats to Galway County Council 20 seats needed for a majority | |||||||||||||||||||||||||||||||||||||
|---|---|---|---|---|---|---|---|---|---|---|---|---|---|---|---|---|---|---|---|---|---|---|---|---|---|---|---|---|---|---|---|---|---|---|---|---|---|
| |||||||||||||||||||||||||||||||||||||
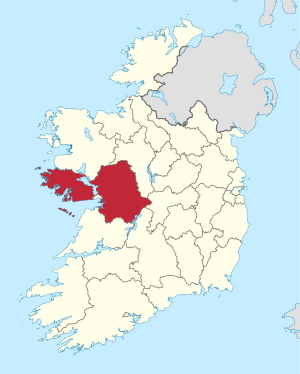 Map showing the area of Galway County Council | |||||||||||||||||||||||||||||||||||||
| |||||||||||||||||||||||||||||||||||||
Following a recommendation of the 2018 Boundary Committee, the boundaries of the LEAs were altered from those used in the 2014 elections. Its terms of reference required no change in the total number of councillors but set a maximum LEA size of seven councillors, which three of the 2014 LEAs exceeded. Other changes were necessitated by population shifts revealed by the 2016 census.[1][2]
This is expected to be the last election to Galway County Council as plans were announced in 2018 to merge the County and City Councils by 2021.[3]
Fianna Fáil had a very good election in winning 3 additional seats and increasing their vote by over 5%. Fine Gael lost a seat to fall to 11 but also increased their vote. The Greens gained 1 seat in Conamara and Republican Sinn Féin retained their single seat. Sinn Féin lost 2 seats to be reduced to just 1 member. However, Gabe Cronelly who had quit the party since 2014 was re-elected as an Independent.
Results by party
| Party | Seats | ± | First Pref. votes | FPv% | ±% | |
|---|---|---|---|---|---|---|
| Fianna Fáil | 15 | 25,369 | 32.80% | |||
| Fine Gael | 11 | 23,869 | 30.86% | |||
| Sinn Féin | 1 | 3,721 | 4.81% | |||
| Green Party | 1 | 1,482 | 1.92% | |||
| Republican Sinn Féin | 1 | 971 | 1.26% | |||
| Aontú | 0 | 1,128 | 1.46% | |||
| Renua | 0 | 505 | 0.65% | |||
| Inds. 4 Change | 0 | 429 | 0.55% | |||
| Social Democrats | 0 | 407 | 0.53% | |||
| Labour Party | 0 | 206 | 0.27% | |||
| Independent | 10 | 19,262 | 24.90% | |||
| Totals | 39 | 77,349 | 100% | |||
Tomás Ó Curraoin appeared on the ballot as an independent (non-party) but is a member of Republican Sinn Féin and is the sole public representative of that party.
Results by LEA
Athenry–Oranmore
| Athenry–Oranmore — 7 Seats[4] | ||||||||||||||
|---|---|---|---|---|---|---|---|---|---|---|---|---|---|---|
| Party | Candidate | FPv% | Count 1 | Count 2 | Count 3 | Count 4 | Count 5 | Count 6 | Count 7 | Count 8 | Count 9 | Count 10 | ||
| Independent | James Charity[c 1] | 14.32% | 1,792 | |||||||||||
| Fianna Fáil | Albert Dolan | 13.74% | 1,720 | |||||||||||
| Independent | Jim Cuddy[c 1] | 11.64% | 1,457 | 1,530 | 1,540 | 1,630 | ||||||||
| Independent | Gabe Cronnelly[c 1] | 9.80% | 1,226 | 1,235 | 1,253 | 1,280 | 1,289 | 1,418 | 1,512 | 1,547 | 1,800 | |||
| Fine Gael | David Collins | 9.29% | 1,163 | 1,182 | 1,203 | 1,216 | 1,219 | 1,250 | 1,295 | 1,413 | 1,560 | 1,596 | ||
| Fine Gael | Liam Carroll | 7.07% | 885 | 899 | 904 | 926 | 926 | 956 | 1,003 | 1,041 | 1,186 | 1,224 | ||
| Fianna Fáil | Michael Hannon | 6.02% | 753 | 785 | 810 | 820 | 830 | 853 | 864 | |||||
| Fianna Fáil | Shelly Herterich Quinn | 5.95% | 745 | 750 | 788 | 820 | 824 | 853 | 916 | 1,141 | 1,326 | 1,404 | ||
| Fine Gael | Helen Jennings | 5.86% | 734 | 738 | 749 | 792 | 793 | 842 | 910 | 933 | ||||
| Independent | Josette Farrell | 5.17% | 647 | 664 | 667 | 696 | 710 | 750 | 886 | 1,105 | 1,138 | 1,148 | ||
| Sinn Féin | Louis O'Hara | 4.05% | 507 | 519 | 535 | 555 | 556 | |||||||
| Green Party | Kenneth Keavey | 3.97% | 497 | 528 | 532 | 591 | 595 | 679 | ||||||
| Labour Party | Marian Spelman | 1.65% | 206 | 213 | 216 | |||||||||
| Renua | Amanda McManus | 1.46% | 183 | 187 | 188 | |||||||||
| Electorate: 23,796 Valid: 12,515 Spoilt: 202 Quota: 1,565 Turnout: 12,717 (53.44%) | ||||||||||||||
Ballinasloe
| Ballinasloe — 6 Seats[5] | ||||||||||||
|---|---|---|---|---|---|---|---|---|---|---|---|---|
| Party | Candidate | FPv% | Count 1 | Count 2 | Count 3 | Count 4 | Count 5 | Count 6 | Count 7 | Count 8 | ||
| Independent | Tim Broderick[c 1] | 17.83% | 2,362 | |||||||||
| Fianna Fáil | Michael Connolly[c 1] | 16.36% | 2,168 | |||||||||
| Fine Gael | Peter Keaveney[c 1] | 12.32% | 1,632 | 1,651 | 1,691 | 1,698 | 1,794 | 1,807 | 1,831 | 1,898 | ||
| Independent | Declan Geraghty | 11.63% | 1,541 | 1,580 | 1,626 | 1,637 | 1,722 | 1,741 | 1,778 | 1,808 | ||
| Sinn Féin | Dermot Connolly[c 1] | 10.47% | 1,387 | 1,500 | 1,519 | 1,603 | 1,614 | 1,748 | 1,932 | |||
| Independent | Aisling Dolan† | 8.17% | 1,082 | 1,142 | 1,160 | 1,259 | 1,275 | 1,422 | 1,571 | 1,841 | ||
| Fine Gael | Aidan Donohue[c 1] | 6.38% | 845 | 944 | 980 | 1,001 | 1,022 | 1,059 | 1,090 | 1,352 | ||
| Fine Gael | Michael Finnerty[c 1] | 5.26% | 697 | 720 | 733 | 749 | 752 | 784 | 875 | |||
| Fianna Fáil | Mike Kelly | 3.86% | 511 | 536 | 575 | 609 | 693 | 724 | ||||
| Social Democrats | Ken Campbell | 3.07% | 407 | 446 | 456 | 496 | 498 | |||||
| Independent | Harriett Bruce | 2.35% | 311 | 344 | 354 | |||||||
| Fianna Fáil | Kenneth O'Brien | 2.32% | 308 | 326 | 369 | 374 | ||||||
| Electorate: 23,513 Valid: 13,251 Spoilt: 211 Quota: 1,894 Turnout: 13,462 (57.25%) | ||||||||||||
Conamara North
| Conamara North — 4 Seats[6] | |||||||||
|---|---|---|---|---|---|---|---|---|---|
| Party | Candidate | FPv% | Count 1 | Count 2 | Count 3 | Count 4 | Count 5 | ||
| Independent | Thomas Welby[c 1] | 29.42% | 2,140 | ||||||
| Fine Gael | Eileen Mannion[c 1] | 19.25% | 1,400 | 1,590 | |||||
| Fianna Fáil | Gerry King | 18.56% | 1,350 | 1,437 | 1,464 | ||||
| Fianna Fáil | Seamus Walsh[c 1] | 13.91% | 1,012 | 1,281 | 1,312 | 1,363 | 1,467 | ||
| Independent | Josie Conneely | 8.59% | 625 | 668 | 696 | 749 | 984 | ||
| Sinn Féin | Tom Healy[c 1] | 8.02% | 583 | 644 | 663 | 705 | |||
| Independent | Críostóir Breathnach | 2.24% | 163 | 198 | 212 | ||||
| Electorate: 13,633 Valid: 7,273 Spoilt: 142 Quota: 1,455 Turnout: 7,415 (54.39%) | |||||||||
Conamara South
| Conamara South — 5 Seats[7] | ||||||||
|---|---|---|---|---|---|---|---|---|
| Party | Candidate | FPv% | Count 1 | Count 2 | Count 3 | Count 4 | ||
| Fine Gael | Padraig Mac An Iomaire | 15.71% | 1,408 | 1,472 | 1,535 | |||
| Fianna Fáil | Noel Thomas[c 1] | 13.51% | 1,211 | 1,244 | 1,327 | 1,515 | ||
| Fianna Fáil | Dáithí Ó Cualáin | 13.01% | 1,166 | 1,250 | 1,324 | 1,408 | ||
| Fianna Fáil | Máirtín Lee | 11.34% | 1,016 | 1,056 | 1,124 | 1,207 | ||
| Green Party | Alastair McKinstry | 10.99% | 985 | 1,117 | 1,216 | 1,436 | ||
| Republican Sinn Féin | Tomás Ó Curraoin[c 1] | 10.84% | 971 | 1,117 | 1,268 | 1,396 | ||
| Fine Gael | Ann Flaherty | 9.73% | 872 | 904 | 992 | |||
| Fianna Fáil | MacDara Hosty | 7.57% | 678 | 694 | ||||
| Sinn Féin | Kevin O'Hara | 5.68% | 509 | |||||
| Independent | Críostóir Breathnach | 1.26% | 113 | |||||
| Independent | Patrick Feeney | 0.36% | 32 | |||||
| Electorate: 18,232 Valid: 8,961 Spoilt: 203 Quota: 1,494 Turnout: 9,164 (50.26%) | ||||||||
Tomás Ó Curraoin appeared on the ballot as an independent (non-party) but is a member of Republican Sinn Féin and is the sole public representative of that party.
Gort–Kinvara
| Gort–Kinvara — 5 Seats[8] | ||||||||||||
|---|---|---|---|---|---|---|---|---|---|---|---|---|
| Party | Candidate | FPv% | Count 1 | Count 2 | Count 3 | Count 4 | Count 5 | Count 6 | Count 7 | Count 8 | ||
| Fine Gael | Joe Byrne[c 1] | 27.08% | 2,751 | |||||||||
| Fine Gael | P.J. Murphy | 15.90% | 1,615 | 1,896 | ||||||||
| Fianna Fáil | Martina Kinane[c 1] | 14.56% | 1,479 | 1,555 | 1,569 | 1,619 | 1,631 | 1,680 | 1,736 | |||
| Fianna Fáil | Gerry Finnerty[c 1] | 8.05% | 818 | 968 | 996 | 1,016 | 1,141 | 1,153 | 1,261 | 1,354 | ||
| Fianna Fáil | Kevin Fahey | 7.99% | 812 | 921 | 935 | 960 | 1,036 | 1,054 | 1,162 | 1,275 | ||
| Fine Gael | Fionn Kiely | 5.88% | 597 | 736 | 820 | 846 | 873 | 940 | 994 | |||
| Independent | Geraldine Donohue | 5.29% | 537 | 623 | 642 | 690 | 777 | 909 | 1,095 | 1,328 | ||
| Inds. 4 Change | Cormac Macgowan | 4.22% | 429 | 461 | 466 | 515 | 546 | |||||
| Independent | Hubert Geoghegan | 4.01% | 407 | 481 | 495 | 557 | 616 | 702 | ||||
| Independent | Declan Diviney | 3.84% | 390 | 463 | 474 | 501 | ||||||
| Renua | Emma O'Connell | 3.17% | 322 | 360 | 374 | |||||||
| Electorate: 17.335 Valid: 10,157 Spoilt: 178 Quota: 1,693 Turnout: 10,335 (59.62%) | ||||||||||||
Loughrea
| Loughrea — 5 Seats[9] | ||||||||||||
|---|---|---|---|---|---|---|---|---|---|---|---|---|
| Party | Candidate | FPv% | Count 1 | Count 2 | Count 3 | Count 4 | Count 5 | Count 6 | Count 7 | Count 8 | ||
| Fine Gael | Michael 'Mogie' Maher[c 1] | 20.82% | 2,152 | |||||||||
| Fine Gael | Jimmy McClearn[c 1] | 19.74% | 2,041 | |||||||||
| Fianna Fáil | Shane Curley | 15.29% | 1,581 | 1,742 | ||||||||
| Fianna Fáil | Ivan Canning[c 2] | 15.13% | 1,564 | 1,589 | 1,747 | |||||||
| Independent | Pat Hynes[c 1] | 9.17% | 948 | 1,052 | 1,101 | 1,105 | 1,111 | 1,190 | 1,339 | 1,560 | ||
| Fianna Fáil | Pat Flanagan | 7.14% | 738 | 814 | 840 | 845 | 853 | 889 | 942 | 1,128 | ||
| Aontú | Joe Campbell | 6.39% | 661 | 674 | 727 | 736 | 737 | 774 | 847 | |||
| Sinn Féin | Annemarie Roche | 3.21% | 332 | 353 | 375 | 378 | 379 | 467 | ||||
| Independent | Eoin Madden | 3.11% | 321 | 349 | 358 | 360 | 362 | |||||
| Electorate: 18,729 Valid: 10,338 Spoilt: 165 Quota: 1,724 Turnout: 10,503 (56.08%) | ||||||||||||
Tuam
| Tuam — 7 Seats[10] | |||||||||||
|---|---|---|---|---|---|---|---|---|---|---|---|
| Party | Candidate | FPv% | Count 1 | Count 2 | Count 3 | Count 4 | Count 5 | Count 6 | Count 7 | ||
| Fine Gael | Pete Roche[c 1] | 16.36% | 2,430 | ||||||||
| Fianna Fáil | Joe Sheridan | 10.39% | 1,544 | 1,588 | 1,602 | 1,649 | 1,726 | 1,841 | 1,846 | ||
| Fianna Fáil | Donagh Mark Killilea[c 1] | 10.24% | 1,521 | 1,607 | 1,636 | 1,698 | 1,893 | ||||
| Fianna Fáil | Mary Hoade[c 1] | 9.80% | 1,455 | 1,487 | 1,492 | 1,529 | 1,553 | 1,840 | 1,841 | ||
| Fine Gael | Andrew Reddington | 9.35% | 1,389 | 1,449 | 1,454 | 1,512 | 1,533 | 1,689 | 1,690 | ||
| Fine Gael | Tom McHugh[c 1] | 8.47% | 1,258 | 1,376 | 1,394 | 1,442 | 1,509 | 1,676 | 1,680 | ||
| Fianna Fáil | Colm Keaveney | 8.21% | 1,219 | 1,271 | 1,297 | 1,458 | 1,630 | 1,754 | 1,761 | ||
| Independent | Billy Connelly[c 2] | 7.53% | 1,118 | 1,152 | 1,165 | 1,253 | 1,298 | ||||
| Independent | Karey McHugh[c 1] | 6.25% | 929 | 1,020 | 1,067 | 1,242 | 1,571 | 1,806 | 1,824 | ||
| Independent | Shaun Cunniffe[c 1] | 5.80% | 862 | 886 | 935 | 1,036 | |||||
| Aontú | Martin Ward | 3.14% | 467 | 477 | 491 | ||||||
| Sinn Féin | Stíofán De Lundres Ó Dálaigh | 2.71% | 403 | 414 | 438 | ||||||
| Independent | Thomas (T.P.) Niland | 1.62% | 241 | 251 | |||||||
| Independent | Dermot Ryan | 0.12% | 18 | 19 | |||||||
| Electorate: 25,125 Valid: 14,854 Spoilt: 213 Quota: 1,857 Turnout: 15,067 (59.97%) | |||||||||||
Footnotes
- Outgoing councillor elected in 2014.
- Outgoing councillor coopted subsequent to the 2014 election.
Changes since 2019
- † On 29 November 2019, Councillor Aisling Dolan announced that she had joined Fine Gael and was appointed as a candidate for the following general election in the Roscommon-Galway constituency. Midwest Radio: Councillor Aisling Dolan to contest next General Election in Roscommon-Galway constituency as a Fine Gael candidate
References
Footnotes
- Republican Sinn Féin is not a registered party used on ballot papers or in council proceedings.
Citations
- Local Electoral Area Boundary Committee No. 1 (13 June 2018). "Report 2018" (PDF). Government Publications. pp. 40–43, 146. ISBN 978-1-4064-2990-9. Retrieved 8 May 2019.
- Phelan, John Paul (19 December 2018). "S.I. No. 618/2018 - County of Galway Local Electoral Areas Order 2018". electronic Irish Statute Book (eISB). Retrieved 8 May 2019.
- Kelly, Briain (7 June 2018). "City and County councils will merge by 2021". Galway Daily. Retrieved 17 May 2019.
- "Local Election 2019 — Athenry–Oranmore LEA" (PDF). Galway County Council. Retrieved 19 June 2019.
- "Local Election 2019 — Ballinasloe LEA" (PDF). Galway County Council. Retrieved 19 June 2019.
- "Local Election 2019 — Conamara North LEA" (PDF). Galway County Council. Retrieved 19 June 2019.
- "Local Election 2019 — Conamara South LEA" (PDF). Galway County Council. Retrieved 19 June 2019.
- "Local Election 2019 — Gort–Kinvara LEA" (PDF). Galway County Council. Retrieved 19 June 2019.
- "Local Election 2019 — Loughrea LEA" (PDF). Galway County Council. Retrieved 19 June 2019.
- "Local Election 2019 — Tuam LEA" (PDF). Galway County Council. Retrieved 19 June 2019.
Sources
- "Galway County Council - Local Election candidates". RTÉ. 13 May 2019. Retrieved 15 May 2019.