2019 Monaghan County Council election
An election to Monaghan County Council took place on 24 May 2019 as part of that year's local elections. All 18 councillors were elected for a five-year term of office from 3 local electoral areas (LEAs) by single transferable vote. The 2018 LEA boundary review committee kept the LEAs used in the 2014 elections, adjusting the boundaries and moving one seat from Ballybay–Clones LEA to Monaghan LEA.
| |||||||||||||||||||||||||||||||||
All 18 seats to Monaghan County Council 10 seats needed for a majority | |||||||||||||||||||||||||||||||||
|---|---|---|---|---|---|---|---|---|---|---|---|---|---|---|---|---|---|---|---|---|---|---|---|---|---|---|---|---|---|---|---|---|---|
| |||||||||||||||||||||||||||||||||
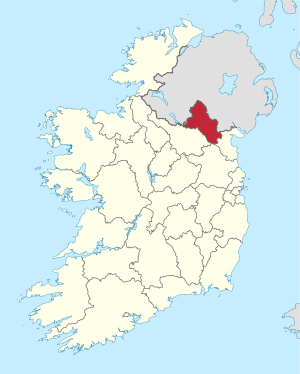 Map showing the area of Monaghan County Council | |||||||||||||||||||||||||||||||||
| |||||||||||||||||||||||||||||||||
Bucking a trend elsewhere Sinn Féin slightly increased their vote in Monaghan. However this did not prevent the party from losing a seat in the Carrickmacross-Castleblayney LEA but Sinn Féin would still remain the largest party. The Sinn Féin loss was to former Carrickmacross TC Cllr, Mary Kerr-Conlon. However the Fine Gael vote in Monaghan fell by over 5% a consequence of Hugh McElvaney retaining his seat in Ballybay-Clones as an Independent.
Results by party
| Party | Seats | ± | First Pref. votes | FPv% | ±% | |
|---|---|---|---|---|---|---|
| Sinn Féin | 6 | 9,238 | 34.38% | |||
| Fine Gael | 5 | 6,568 | 24.44% | |||
| Fianna Fáil | 4 | 6,609 | 24.60% | |||
| Green Party | 0 | 676 | 2.52% | |||
| Aontú | 0 | 354 | 1.32% | |||
| Independent | 3 | 3,425 | 12.75% | |||
| Totals | 18 | 26,870 | 100% | |||
Candidates by LEA
Ballybay–Clones
| Ballybay–Clones — 5 Seats | |||||||
|---|---|---|---|---|---|---|---|
| Party | Candidate | FPv% | Count 1 | Count 2 | Count 3 | ||
| Fianna Fáil | Séamus Coyle[c 1] | 28.57% | 2,346 | ||||
| Sinn Féin | Pat Treanor[c 1] | 17.40% | 1,429 | ||||
| Fine Gael | Richard John Truell[c 2] | 15.89% | 1,305 | 1,525 | |||
| Fine Gael | Séan Gilliland[c 2] | 14.42% | 1,184 | 1,412 | |||
| Independent | Hugh McElvaney[c 1] | 13.87% | 1,139 | 1,357 | 1,419 | ||
| Sinn Féin | Rosie Smyth O'Harte | 9.84% | 808 | 1,119 | 1,213 | ||
| Electorate: 14,767 Valid: 8,211 Spoilt: 168 Quota: 1,369 Turnout: 8,379 (57%) | |||||||
Carrickmacross–Castleblayney
| Carrickmacross–Castleblayney — 6 Seats | |||||||||||
|---|---|---|---|---|---|---|---|---|---|---|---|
| Party | Candidate | FPv% | Count 1 | Count 2 | Count 3 | Count 4 | Count 5 | Count 6 | Count 7 | ||
| Sinn Féin | Colm Carthy[c 2] | 14.60% | 1,401 | ||||||||
| Sinn Féin | Noel Keelan[c 1] | 14.34% | 1,376 | ||||||||
| Fine Gael | Aidan Campbell[c 1] | 14.22% | 1,364 | 1,365 | 1,401 | ||||||
| Fianna Fáil | P.J. O'Hanlon[c 1] | 14.03% | 1,346 | 1,350 | 1,372 | ||||||
| Sinn Féin | Jackie Crowe[c 1] | 9.87% | 947 | 961 | 1,005 | 1,108 | 1,129 | 1,173 | |||
| Fine Gael | Mary Kerr-Conlon | 7.84% | 752 | 755 | 796 | 813 | 1,024 | 1,237 | 1,247 | ||
| Fianna Fáil | Aoife McCooey | 7.66% | 735 | 736 | 765 | 868 | 905 | 1,192 | 1,197 | ||
| Fianna Fáil | Rory Owen McEvoy | 6.42% | 616 | 620 | 642 | 677 | 748 | ||||
| Fine Gael | Patrick Cassidy | 4.28% | 411 | 412 | 432 | 441 | |||||
| Aontú | James Duffy | 3.69% | 354 | 354 | 378 | ||||||
| Green Party | Conan Connolly | 3.03% | 291 | 293 | |||||||
| Electorate: 17,286 Valid: 9,593 Spoilt: 192 Quota: 1,371 Turnout: 9,785 (57%) | |||||||||||
Monaghan
| Monaghan — 7 Seats | |||||||||||||||
|---|---|---|---|---|---|---|---|---|---|---|---|---|---|---|---|
| Party | Candidate | FPv% | Count 1 | Count 2 | Count 3 | Count 4 | Count 5 | Count 6 | Count 7 | Count 8 | Count 9 | Count 10 | Count 11 | ||
| Sinn Féin | Cathy Bennett[c 1] | 14.24% | 1,291 | ||||||||||||
| Independent | Seamus Treanor[c 1] | 12.71% | 1,152 | ||||||||||||
| Fianna Fáil | Raymond Aughey[c 2] | 12.03% | 1,091 | 1,107 | 1,109 | 1,116 | 1,131 | 1,151 | |||||||
| Sinn Féin | Brian McKenna[c 1] | 9.91% | 898 | 951 | 953 | 954 | 967 | 977 | 1,003 | 1,004 | 1,033 | 1,146 | |||
| Fine Gael | David Maxwell[c 1] | 9.39% | 851 | 854 | 855 | 855 | 856 | 868 | 942 | 944 | 987 | 1,003 | 1,281 | ||
| Independent | Paudge Connolly[c 1] | 8.10% | 734 | 747 | 751 | 757 | 770 | 816 | 839 | 840 | 922 | 990 | 1,082 | ||
| Sinn Féin | Seán Conlon[c 1] | 7.49% | 679 | 711 | 713 | 718 | 753 | 783 | 795 | 798 | 844 | 1,018 | 1,074 | ||
| Fianna Fáil | Emer Brennan | 5.24% | 475 | 483 | 484 | 487 | 491 | 506 | 531 | 536 | 602 | 623 | 673 | ||
| Fine Gael | Barra Flynn | 4.80% | 435 | 439 | 440 | 444 | 449 | 462 | 524 | 526 | 589 | 595 | |||
| Sinn Féin | Catriona Moen | 4.51% | 409 | 420 | 421 | 421 | 432 | 441 | 456 | 456 | 480 | ||||
| Green Party | Mícheál Callaghan | 4.25% | 385 | 392 | 393 | 397 | 417 | 428 | 445 | 446 | |||||
| Fine Gael | Fiona McCaffrey Jones | 2.93% | 266 | 269 | 269 | 271 | 272 | 280 | |||||||
| Independent | Thomas Hagan | 2.04% | 185 | 188 | 190 | 203 | 225 | ||||||||
| Independent | Alvin McGlone | 1.69% | 153 | 153 | 157 | 163 | |||||||||
| Independent | Paddy Grenham | 0.44% | 40 | 40 | 40 | ||||||||||
| Independent | James Mee | 0.24% | 22 | 23 | 23 | ||||||||||
| Electorate: 18,421 Valid: 9,066 Spoilt: 206 Quota: 1,134 Turnout: 9,272 (50%) | |||||||||||||||
Footnotes
- Outgoing councillor elected in 2014.
- Outgoing councillor coopted subsequent to the 2014 election.
References
Sources
- "Monaghan County Council - Local Election candidates". RTÉ. 14 May 2019. Retrieved 15 May 2019.
- "2019 Local Elections County Monaghan Final Results". Monaghan County Council. 27 May 2019. Retrieved 19 June 2019.
- Local Electoral Area Boundary Committee No. 1 (13 June 2018). "Report 2018" (PDF). Government Publications. pp. 88–91, 158. ISBN 978-1-4064-2990-9. Retrieved 8 May 2019.
- Phelan, John Paul (19 December 2018). "S.I. No. 629/2018 — County of Monaghan Local Electoral Areas Order 2018". electronic Irish Statute Book (eISB). Retrieved 8 May 2019.
| Preceded by 2014 Monaghan County Council election |
Monaghan County Council elections | Succeeded by 2024 Monaghan County Council election |