2019 Donegal County Council election
An election to Donegal County Council took place on 24 May 2019 as part of the Irish local elections. 37 councillors were elected for a five-year term of office from 7 local electoral areas (LEAs) by single transferable vote.
| |||||||||||||||||||||||||||||||||
All 37 seats to Donegal County Council 19 seats needed for a majority | |||||||||||||||||||||||||||||||||
|---|---|---|---|---|---|---|---|---|---|---|---|---|---|---|---|---|---|---|---|---|---|---|---|---|---|---|---|---|---|---|---|---|---|
| |||||||||||||||||||||||||||||||||
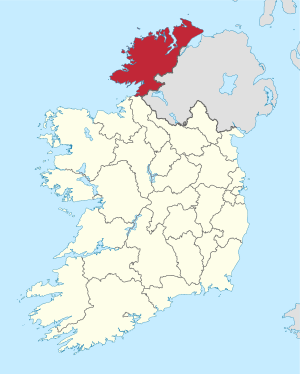 Map showing the area of Donegal County Council | |||||||||||||||||||||||||||||||||
Following a recommendation of the 2018 Boundary Committee, the boundaries of the LEAs were altered from those used in the 2014 elections.[1][2] Its terms of reference required no change in the total number of councillors but set a lower maximum LEA size of seven councillors, whereas Donegal in 2015 had LEAs of 10 and 9 seats. Other changes were necessitated by population shifts revealed by the 2016 census.
Fianna Fáil gained an additional seat to reach 12 and also saw a slight increase in their vote share. Anthony Molloy - who captained the Donegal GAA team to the 1992 All-Ireland Senior Football Championship - won a seat for the party, as did rally driver Manus Kelly (both for the first time). However, Seamus O Domhnaill - Fianna Fáil's outgoing Cathaoirleach - was a notable casualty, as was former Senator Enda Bonner.
Unlike other performances around the State, Sinn Féin actually gained a seat in Donegal; increasing their numbers by 1 to 10 seats while seeing a slight reduction in vote share. Fine Gael retained 6 seats overall, while Independents saw a reduction of 2 seats. One Independent elected was John O'Donnell, who attracted controversy following an RTÉ Investigates programme into Irish Councillors.
Results by party
| Party | Seats | ± | 1st pref | FPv% | ±% | |
|---|---|---|---|---|---|---|
| Fianna Fáil | 12 | 21,142 | 29.35% | |||
| Sinn Féin | 10 | 13,953 | 19.37% | |||
| Fine Gael | 6 | 13,327 | 18.50% | |||
| Labour Party | 1 | 1,927 | 2.68% | |||
| Aontú | 0 | 2,265 | 3.14% | |||
| People Before Profit | 0 | 284 | 0.39% | |||
| Renua | 0 | 279 | 0.39% | |||
| Independent | 8 | 18,857 | 26.18% | |||
| Total | 37 | 72,034 | 100.0% | |||
Results by LEA
Buncrana
| Buncrana — 5 Seats[3] | |||||||||||||
|---|---|---|---|---|---|---|---|---|---|---|---|---|---|
| Party | Candidate | FPv% | Count 1 | Count 2 | Count 3 | Count 4 | Count 5 | Count 6 | Count 7 | Count 8 | Count 9 | ||
| Fianna Fáil | Paul Canning* | 20.31% | 1,720 | ||||||||||
| Fianna Fáil | Rena Donaghey* | 16.96% | 1,436 | ||||||||||
| Sinn Féin | Jack Murray* | 16.70% | 1,414 | ||||||||||
| Independent | Nicholas Crossan* | 13.97% | 1,183 | 1,257 | 1,263 | 1,275 | 1,339 | 1,410 | 1,411 | 1,527 | |||
| Sinn Féin | Terry Crossan | 9.54% | 808 | 880 | 902 | 903 | 928 | 995 | 996 | 1,012 | 1,098 | ||
| Fine Gael | Mickey Doherty* | 6.28% | 532 | 588 | 599 | 601 | 608 | 624 | 624 | 739 | 835 | ||
| Independent | Frankie Lavelle | 4.40% | 373 | 399 | 405 | 408 | 507 | 565 | 565 | 597 | |||
| Fine Gael | Michelle McKenna | 3.75% | 318 | 353 | 356 | 359 | 371 | 403 | 403 | ||||
| Aontú | Joe Murphy | 3.59% | 304 | 319 | 329 | 331 | |||||||
| Independent | Sinéad Stewart | 3.41% | 289 | 315 | 337 | 338 | 367 | ||||||
| Independent | Mark McKinney | 1.09% | 92 | 96 | |||||||||
| Electorate: 16,798 Valid: 8,469 Spoilt: 143 Quota: 1,412 Turnout: 51.27% | |||||||||||||
Carndonagh
| Carndonagh — 4 Seats[4] | ||||||||||
|---|---|---|---|---|---|---|---|---|---|---|
| Party | Candidate | FPv% | Count 1 | Count 2 | Count 3 | Count 4 | Count 5 | Count 6 | ||
| Fianna Fáil | Martin McDermott* | 34.59% | 2,501 | |||||||
| Labour Party | Martin Farren* | 19.11% | 1,383 | 1,435 | 1,470 | |||||
| Sinn Féin | Albert Doherty* | 15.91% | 1,151 | 1,413 | 1,460 | 1,460 | ||||
| Fine Gael | Bernard McGuinness* | 14.41% | 1,043 | 1,323 | 1,355 | 1,362 | 1,368 | 1,448 | ||
| Fianna Fáil | Marie Duffy | 8.67% | 627 | 1,022 | 1,057 | 1,060 | 1,066 | 1,156 | ||
| Independent | Tracy Cullen | 3.90% | 282 | 311 | 347 | 352 | 352 | |||
| Aontú | Mary Rose Doherty | 2.69% | 195 | 226 | ||||||
| Independent | Arthur Desmond McGuinness | 0.75% | 54 | 58 | ||||||
| Electorate: 14,062 Valid: 7,236 Spoilt: 94 Quota: 1,448 Turnout: 52.13% | ||||||||||
Donegal
| Donegal — 6 Seats[5] | ||||||||||||||||||
|---|---|---|---|---|---|---|---|---|---|---|---|---|---|---|---|---|---|---|
| Party | Candidate | FPv% | Count 1 | Count 2 | Count 3 | Count 4 | Count 5 | Count 6 | Count 7 | Count 8 | Count 9 | Count 10 | Count 11 | Count 12 | Count 13 | Count 14 | ||
| Independent | Niamh Kennedy* | 10.77% | 1,540 | 1,544 | 1,568 | 1,585 | 1,661 | 1,682 | 1,749 | 1,759 | 1,938 | 2,031 | 2,322 | |||||
| Sinn Féin | Noel Jordan* | 10.74% | 1,535 | 1,550 | 1,557 | 1,573 | 1,598 | 1,609 | 1,690 | 1,693 | 1,731 | 1,873 | 2,033 | 2,087 | ||||
| Fianna Fáil | Michéal Naughton* | 8.34% | 1,192 | 1,205 | 1,213 | 1,224 | 1,227 | 1,235 | 1,236 | 1,413 | 1,536 | 1,612 | 1,648 | 1,661 | 1,742 | 1,924 | ||
| Fine Gael | Barry Sweeny | 7.81% | 1,116 | 1,126 | 1,151 | 1,215 | 1,217 | 1,263 | 1,264 | 1,353 | 1,360 | 1,376 | 1,424 | 1,432 | 1,917 | 1,958 | ||
| Fine Gael | John McNulty | 6.84% | 978 | 978 | 978 | 980 | 1,106 | 1,106 | 1,148 | 1,153 | 1,199 | 1,214 | 1,393 | 1,453 | 1,463 | 1,547 | ||
| Independent | Tom Conaghan* | 6.60% | 944 | 979 | 987 | 993 | 1,000 | 1,004 | 1,017 | 1,028 | 1,058 | 1,272 | 1,373 | 1,397 | 1,435 | 1,831 | ||
| Sinn Féin | Michael McMahon | 6.29% | 900 | 902 | 924 | 973 | 974 | 1,186 | 1,190 | 1,446 | 1,462 | 1,470 | 1,474 | 1,478 | 1,749 | 1,798 | ||
| Independent | Seamus Maguire* | 6.07% | 868 | 880 | 896 | 907 | 923 | 927 | 939 | 939 | 961 | 1,106 | 1,163 | 1,176 | 1,194 | |||
| Independent | Billy Grimes | 6.07% | 868 | 873 | 895 | 951 | 952 | 989 | 989 | 1,043 | 1,050 | 1,057 | 1,067 | 1,075 | ||||
| Fine Gael | John J Boyle | 5.53% | 791 | 793 | 793 | 795 | 810 | 810 | 886 | 888 | 970 | 1,001 | ||||||
| Independent | Pauric Kennedy | 5.14% | 735 | 751 | 754 | 760 | 760 | 763 | 780 | 783 | 802 | |||||||
| Fianna Fáil | Philip McGlynn | 3.64% | 521 | 522 | 528 | 533 | 533 | 576 | 582 | |||||||||
| Fianna Fáil | Eimear McGuinness | 3.48% | 497 | 498 | 502 | 506 | 527 | 527 | 591 | 631 | ||||||||
| Fianna Fáil | Roger Meehan | 3.38% | 483 | 484 | 485 | 487 | 503 | 504 | ||||||||||
| Independent | Diarmaid Doherty | 2.72% | 389 | 394 | 399 | 432 | 432 | |||||||||||
| Independent | Seán Ó Beirne | 2.27% | 325 | 325 | 329 | 331 | ||||||||||||
| People Before Profit | Cyril Brennan | 1.99% | 284 | 288 | 319 | |||||||||||||
| Independent | Valerie McNulty | 1.36% | 194 | 196 | ||||||||||||||
| Independent | Justin Coughlin | 0.97% | 138 | |||||||||||||||
| Electorate: 23,075 Valid: 14,298 Spoilt: 165 Quota: 2,043 Turnout: 62.68% | ||||||||||||||||||
Glenties
| Glenties — 6 Seats[6] | |||||||||||||
|---|---|---|---|---|---|---|---|---|---|---|---|---|---|
| Party | Candidate | FPv% | Count 1 | Count 2 | Count 3 | Count 4 | Count 5 | Count 6 | Count 7 | Count 8 | Count 9 | ||
| Independent | Micheál Choilm Mac Giolla Easbuig* | 15.80% | 2,007 | ||||||||||
| Sinn Féin | John Sheamuis Ó Fearraigh* | 11.25% | 1,429 | 1,464 | 1,501 | 1,558 | 1,740 | 1,750 | 1,782 | 2,050 | |||
| Sinn Féin | Maire Therese Gallagher* | 8.57% | 1,089 | 1,103 | 1,152 | 1,241 | 1,286 | 1,324 | 1,615 | 1,658 | 1,693 | ||
| Fianna Fáil | Noreen McGarvey | 8.01% | 1,018 | 1,023 | 1,043 | 1,103 | 1,155 | 1,171 | 1,402 | 1,499 | 1,506 | ||
| Fine Gael | Michael McClafferty | 7.97% | 1,012 | 1,033 | 1,038 | 1,061 | 1,314 | 1,341 | 1,376 | 1,721 | 1,799 | ||
| Fianna Fáil | Seamus O Domhnaill* | 7.71% | 979 | 1,071 | 1,079 | 1,095 | 1,153 | 1,161 | 1,222 | ||||
| Sinn Féin | Brian Carr | 7.26% | 922 | 932 | 934 | 978 | 988 | 1,211 | 1,263 | 1,282 | 1,290 | ||
| Fianna Fáil | Anthony Molloy | 7.21% | 916 | 928 | 932 | 964 | 999 | 1,400 | 1,574 | 1,702 | 1,713 | ||
| Fianna Fáil | Enda Bonner* | 7.03% | 893 | 914 | 926 | 975 | 1,023 | 1,056 | |||||
| Independent | Liam Whyte | 6.47% | 822 | 844 | 856 | 910 | 934 | ||||||
| Fine Gael | Evelyn Sweeney | 5.7% | 724 | 737 | 758 | 822 | |||||||
| Labour Party | Seamus Rodgers | 4.28% | 544 | 562 | 584 | ||||||||
| Aontú | Liam Mulligan | 2.75% | 349 | ||||||||||
| Electorate: 23,165 Valid: 12,704 Spoilt: 147 Quota: 1,815 Turnout: 55.48% | |||||||||||||
Letterkenny
| Letterkenny — 7 Seats[7] | |||||||||||||
|---|---|---|---|---|---|---|---|---|---|---|---|---|---|
| Party | Candidate | FPv% | Count 1 | Count 2 | Count 3 | Count 4 | Count 5 | Count 6 | Count 7 | Count 8 | Count 9 | ||
| Fianna Fáil | Ciaran Brogan* | 13.41% | 1,570 | ||||||||||
| Fine Gael | Jimmy Kavanagh* | 10.53% | 1,233 | 1,245 | 1,255 | 1,271 | 1,312 | 1,367 | 1,701 | ||||
| Fianna Fáil | Donal Coyle | 10.18% | 1,192 | 1,209 | 1,211 | 1,231 | 1,249 | 1,273 | 1,348 | 1,389 | 1,444 | ||
| Independent | Michael McBride* | 9.75% | 1,141 | 1,155 | 1,159 | 1,174 | 1,297 | 1,360 | 1,430 | 1,464 | |||
| Independent | Kevin Bradley | 8.48% | 993 | 1,009 | 1,024 | 1,050 | 1,127 | 1,210 | 1,294 | 1,347 | 1,465 | ||
| Fianna Fáil | Manus Mandy Kelly†† | 7.74% | 906 | 924 | 932 | 948 | 1,003 | 1,028 | 1,124 | 1,171 | 1,374 | ||
| Aontú | Mary T Sweeney | 7.31% | 856 | 860 | 876 | 906 | 932 | 974 | 1,041 | 1,057 | 1,108 | ||
| Sinn Féin | Gerry McMonagle* | 7.17% | 839 | 845 | 873 | 903 | 926 | 972 | 995 | 1,003 | 1,398 | ||
| Sinn Féin | Adrian Glackin* | 6.83% | 799 | 804 | 813 | 838 | 877 | 935 | 957 | 969 | |||
| Fine Gael | Bernie Moran | 6.33% | 741 | 746 | 750 | 762 | 794 | 885 | |||||
| Independent | Thoiba Ahmed | 4.48% | 525 | 527 | 571 | 637 | 653 | ||||||
| Independent | Charlie McClafferty | 3.92% | 459 | 464 | 471 | 491 | |||||||
| Independent | Cathal McGlynn | 2.14% | 251 | 252 | 294 | ||||||||
| Independent | Finnian O'Donnell | 1.72% | 201 | 202 | |||||||||
| Electorate: 22,826 Valid: 11,706 Spoilt: 130 Quota: 1,464 Turnout: 51.85% | |||||||||||||
Lifford–Stranorlar
| Lifford–Stranorlar — 6 Seats[8] | ||||||||||||
|---|---|---|---|---|---|---|---|---|---|---|---|---|
| Party | Candidate | FPv% | Count 1 | Count 2 | Count 3 | Count 4 | Count 5 | Count 6 | Count 7 | Count 8 | ||
| Fine Gael | Martin Harley* | 17.16% | 1,688 | |||||||||
| Fianna Fáil | Patrick McGowan* | 16.32% | 1,606 | |||||||||
| Sinn Féin | Gary Doherty* | 15.97% | 1,571 | |||||||||
| Fianna Fáil | Gerry Crawford* | 13.92% | 1,369 | 1,393 | 1,468 | |||||||
| Fine Gael | Frank McBrearty Jnr*† | 9.81% | 965 | 1,016 | 1,041 | 1,052 | 1,058 | 1,079 | 1,131 | 1,208 | ||
| Sinn Féin | Liam Doherty* | 7.56% | 744 | 776 | 799 | 924 | 929 | 974 | 1,036 | 1,195 | ||
| Fine Gael | Garvan Connolly | 7.25% | 713 | 811 | 846 | 857 | 969 | 893 | 950 | 1,041 | ||
| Independent | Alan McMenamin | 4.82% | 474 | 514 | 531 | 537 | ||||||
| Renua | Maghnus Monaghan | 2.84% | 279 | 289 | 296 | 301 | 310 | 317 | ||||
| Aontú | John Hartnett | 2.27% | 223 | 231 | 238 | 240 | 245 | 264 | ||||
| Independent | Michael De Ward | 2.09% | 206 | 225 | 236 | 241 | 244 | |||||
| Electorate: 20,389 Valid: 9,838 Spoilt: 160 Quota: 1,406 Turnout: 49.01% | ||||||||||||
Milford
| Milford — 3 Seats[9] | |||||||||
|---|---|---|---|---|---|---|---|---|---|
| Party | Candidate | FPv% | Count 1 | Count 2 | Count 3 | Count 4 | Count 5 | ||
| Independent | John O'Donnell* | 25.17% | 1,959 | ||||||
| Fianna Fáil | Liam Blaney* | 22.05% | 1,716 | 1,812 | 1,968 | ||||
| Independent | Ian McGarvey* | 10.34% | 805 | 893 | 1,062 | 1,219 | 1,522 | ||
| Sinn Féin | Maria Doherty | 9.66% | 752 | 780 | 885 | 1,035 | |||
| Fine Gael | Noel McBride | 9.61% | 748 | 793 | 845 | ||||
| Fine Gael | Eimer Friel | 9.32% | 725 | 747 | 886 | 1,213 | 1,412 | ||
| Independent | Declan Meehan | 8.70% | 677 | 722 | |||||
| Aontú | Dermot Hardy | 4.34% | 338 | ||||||
| Independent | Charlie McGinley | 0.81% | 63 | ||||||
| Electorate: 12,066 Valid: 7,783 Spoilt: 75 Quota: 1,946 Turnout: 65.13% | |||||||||
Changes since 2019
- † Immediately after the 2019 local elections, Lifford-Stranorlar Fine Gael Cllr Frank McBrearty Jnr resigned from the party and became an Independent. He claimed he had been bullied and was not made feel welcome by former colleagues in Fine Gael. He then announced he was going to sue the party for post-traumatic stress disorder. Irish Examiner: Frank McBrearty to sue FG for post-traumatic stress disorder
- †† On 23 June 2019, Letterkenny Fianna Fáil Cllr Manus Mandy Kelly was tragically killed while participating in the Donegal International Rally. RTÉ News: Man killed in Donegal International Rally crash named as Manus Kelly On 25 November his father, Donal, was co-opted to fill the vacancy.
References
Citations
- Local Electoral Area Boundary Committee No. 1 (13 June 2018). "Report 2018" (PDF). Government Publications. pp. 36–39, 145. ISBN 978-1-4064-2990-9. Retrieved 8 May 2019.
- Phelan, John Paul (19 December 2018). "S.I. No. 613/2018 - County of Donegal Local Electoral Areas Order 2018". electronic Irish Statute Book (eISB). Retrieved 8 May 2019.
- "Buncrana LEA Counts 1-9" (PDF). donegalcoco.ie. Donegal County Council. Retrieved 28 May 2019.
- "Cardonagh LEA Counts 1-10" (PDF). donegalcoco.ie. Donegal County Council. Retrieved 28 May 2019.
- "Local Elections Results 2019". donegalcoco.ie. Donegal County Council. Retrieved 28 May 2019.
- "Glenties LEA Counts 1-9" (PDF). donegalcoco.ie. Donegal County Council. Retrieved 28 May 2019.
- "Letterkenny LEA Counts 1-9" (PDF). donegalcoco.ie. Donegal County Council. Retrieved 28 May 2019.
- "Lifford-Stranorlar LEA Counts 1-8" (PDF). donegalcoco.ie. Donegal County Council. Retrieved 28 May 2019.
- "Mildford LEA Counts 1-5" (PDF). donegalcoco.ie. Donegal County Council. Retrieved 28 May 2019.
Sources
- "Donegal County Council - Local Election candidates". RTÉ. 13 May 2019. Retrieved 15 May 2019.