2019 Mayo County Council election
A Mayo County Council election was held in County Mayo, Ireland on 24 May 2019 as part of that year's local elections. All 30 councillors were elected for a five-year term of office from 6 local electoral areas (LEAs) by single transferable vote.
| |||||||||||||||||||||||||||||||||
All 30 seats to Mayo County Council 16 seats needed for a majority | |||||||||||||||||||||||||||||||||
|---|---|---|---|---|---|---|---|---|---|---|---|---|---|---|---|---|---|---|---|---|---|---|---|---|---|---|---|---|---|---|---|---|---|
| |||||||||||||||||||||||||||||||||
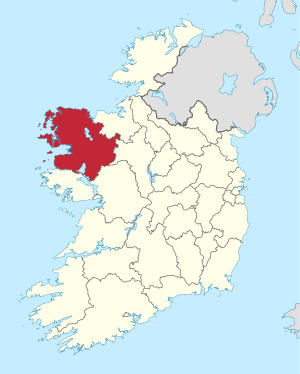 Map showing the area of Mayo County Council | |||||||||||||||||||||||||||||||||
| |||||||||||||||||||||||||||||||||
The 2018 LEA boundary review committee significantly altered the LEAs used in the 2014 elections. Its terms of reference required no change in the total number of councillors but set a maximum LEA size of seven councillors, less than the eight seats of two 2014 LEAs. Other changes were necessitated by population shifts revealed by the 2016 census.
Results by party
| Party | Seats | ± | 1st pref | FPv% | ±% | |
|---|---|---|---|---|---|---|
| Fine Gael | 12 | 23,420 | 37.25% | |||
| Fianna Fáil | 11 | 18,823 | 29.93% | |||
| Sinn Féin | 1 | 4,633 | 7.37% | |||
| Aontú | 0 | 1,319 | 2.10% | |||
| Green Party | 0 | 628 | 1.00% | |||
| People Before Profit | 0 | 437 | 0.69% | |||
| Renua | 0 | 315 | 0.50% | |||
| Social Democrats | 0 | 185 | 0.29% | |||
| Labour Party | 0 | 143 | 0.23% | |||
| Independent | 6 | 12,976 | 20.64% | |||
| Totals | 30 | 62,880 | 100% | |||
Candidates by LEA
Ballina
| Ballina — 6 Seats | ||||||||||||
|---|---|---|---|---|---|---|---|---|---|---|---|---|
| Party | Candidate | FPv% | Count 1 | Count 2 | Count 3 | Count 4 | Count 5 | Count 6 | Count 7 | Count 8 | ||
| Fine Gael | John O'Hara[c 1] | 17.30% | 2,123 | |||||||||
| Independent | Mark Duffy | 17.08% | 2,095 | |||||||||
| Fianna Fáil | Annie May Reape[c 1] | 11.11% | 1,363 | 1,498 | 1,576 | 1,599 | 1,628 | 1,747 | 1,772 | |||
| Fianna Fáil | Michael Loftus[c 1] | 10.76% | 1,320 | 1,334 | 1,353 | 1,356 | 1,371 | 1,402 | 1,655 | 1,774 | ||
| Independent | Seamus Weir[c 1] | 9.53% | 1,169 | 1,220 | 1,256 | 1,278 | 1,321 | 1,428 | 1,469 | 1,646 | ||
| Fianna Fáil | Eamon Moore | 9.01% | 1,105 | 1,116 | 1,126 | 1,135 | 1,161 | 1,170 | 1,327 | 1,436 | ||
| Fine Gael | Jarlath Munnelly[c 1] | 7.76% | 952 | 992 | 1,014 | 1,035 | 1,072 | 1,095 | 1,186 | 1,510 | ||
| Fine Gael | Kieran Gill | 5.85% | 718 | 745 | 757 | 763 | 767 | 776 | ||||
| Fine Gael | Aileen Horkan | 4.66% | 572 | 638 | 720 | 771 | 783 | 895 | 1,042 | |||
| Independent | Willie Nolan | 3.16% | 388 | 400 | 448 | 471 | 512 | |||||
| Sinn Féin | Michael Regan | 2.27% | 279 | 286 | 298 | 319 | ||||||
| Social Democrats | Tracey Smith | 1.51% | 185 | 192 | 215 | |||||||
| Electorate: 20,353 Valid: 12,269 Spoilt: 185 Quota: 1,753 Turnout: 12,454 (61.19%) | ||||||||||||
Belmullet
| Belmullet — 3 Seats | ||||||
|---|---|---|---|---|---|---|
| Party | Candidate | FPv% | Count 1 | Count 2 | ||
| Fine Gael | Gerry Coyle[c 1] | 25.52% | 1,806 | |||
| Fianna Fáil | Paul McNamara[c 1] | 23.96% | 1,696 | 2,095 | ||
| Fianna Fáil | Seán Carey | 22.66% | 1,604 | 1,753 | ||
| Sinn Féin | Teresa Whelan[c 2] | 15.43% | 1,092 | 1,227 | ||
| Fine Gael | Breege Grealis | 9.26% | 655 | |||
| Independent | Jay Heneghan | 3.17% | 224 | |||
| Electorate: 11,279 Valid: 7,077 Spoilt: 123 Quota: 1,770 Turnout: 7,200 (63.84%) | ||||||
Castlebar
| Castlebar — 7 Seats | |||||||||||||||||
|---|---|---|---|---|---|---|---|---|---|---|---|---|---|---|---|---|---|
| Party | Candidate | FPv% | Count 1 | Count 2 | Count 3 | Count 4 | Count 5 | Count 6 | Count 7 | Count 8 | Count 9 | Count 10 | Count 11 | Count 12 | Count 13 | ||
| Independent | Michael Kilcoyne[c 1] | 18.72% | 2,592 | ||||||||||||||
| Fianna Fáil | Blackie K. Gavin[c 1] | 12.85% | 1,779 | ||||||||||||||
| Fianna Fáil | Al McDonnell[c 1] | 10.97% | 1,519 | 1,658 | 1,661 | 1,671 | 1,679 | 1,697 | 1,710 | 1,748 | |||||||
| Fine Gael | Ger Deere | 9.23% | 1,278 | 1,387 | 1,396 | 1,402 | 1,412 | 1,426 | 1,464 | 1,492 | 1,535 | 1,571 | 1,653 | 1,915 | |||
| Fine Gael | Cyril Burke | 8.61% | 1,192 | 1,258 | 1,259 | 1,262 | 1,270 | 1,276 | 1,288 | 1,303 | 1,314 | 1,334 | 1,395 | 1,523 | 1,609 | ||
| Fianna Fáil | Martin McLoughlin[c 2] | 6.62% | 916 | 985 | 990 | 998 | 1,000 | 1,013 | 1,027 | 1,042 | 1,061 | 1,138 | 1,236 | 1,378 | 1,396 | ||
| Fine Gael | Donna Sheridan | 5.81% | 804 | 879 | 880 | 884 | 904 | 928 | 948 | 960 | 1,031 | 1,103 | 1,198 | 1,400 | 1,450 | ||
| Fine Gael | Eugene McCormack | 5.24% | 725 | 783 | 786 | 789 | 796 | 802 | 819 | 840 | 869 | 956 | 990 | ||||
| Independent | Harry Barrett | 4.48% | 620 | 733 | 740 | 745 | 775 | 795 | 839 | 874 | 1,000 | 1,055 | 1,189 | 1,273 | 1,303 | ||
| Sinn Féin | Joe McHale[c 2] | 4.35% | 602 | 665 | 671 | 673 | 678 | 687 | 698 | 725 | 793 | 888 | |||||
| Independent | Gerry Loftus | 3.99% | 552 | 587 | 593 | 595 | 601 | 611 | 618 | 643 | 668 | ||||||
| People Before Profit | Joe Daly | 3.16% | 437 | 482 | 487 | 488 | 505 | 520 | 530 | 545 | |||||||
| Renua | Michael Farrington | 2.27% | 315 | 333 | 334 | 335 | 340 | 342 | 350 | ||||||||
| Independent | Aidan Crowley | 1.27% | 176 | 207 | 208 | 209 | 215 | 221 | |||||||||
| Labour Party | Mohammed Kamal Uddin | 1.03% | 143 | 157 | 159 | 160 | |||||||||||
| Independent | Des Walsh | 1.03% | 142 | 156 | 164 | 165 | 170 | ||||||||||
| Independent | Anthony Vesey | 0.39% | 54 | 66 | |||||||||||||
| Electorate: 23,682 Valid: 13,847 Spoilt: 172 Quota: 1,731 Turnout: 14,019 (59.2%) | |||||||||||||||||
Claremorris
| Claremorris — 6 Seats | ||||||||||
|---|---|---|---|---|---|---|---|---|---|---|
| Party | Candidate | FPv% | Count 1 | Count 2 | Count 3 | Count 4 | Count 5 | Count 6 | ||
| Fine Gael | Patsy O'Brien[c 1] | 22.64% | 2,955 | |||||||
| Independent | Richard Finn[c 1] | 13.59% | 1,774 | 1,885 | ||||||
| Fianna Fáil | Damien Ryan[c 1] | 12.04% | 1,572 | 1,898 | ||||||
| Fine Gael | John Cribbin[c 1] | 11.47% | 1,497 | 1,536 | 1,553 | 1,694 | 1,696 | 1,785 | ||
| Fine Gael | Michael Burke[c 1] | 10.83% | 1,413 | 1,722 | 1,765 | 1,800 | 1,821 | 1,907 | ||
| Fine Gael | Tom Connolly[c 1] | 9.24% | 1,206 | 1,314 | 1,333 | 1,417 | 1,419 | 1,769 | ||
| Fianna Fáil | Michael Carty | 7.14% | 932 | 963 | 970 | 1,120 | 1,123 | 1,286 | ||
| Sinn Féin | Natasha Warde | 5.85% | 764 | 866 | 964 | 1,079 | 1,084 | |||
| Aontú | Paul Lawless | 5.19% | 677 | 710 | 748 | |||||
| Green Party | Margaret (Mags) Sheehan | 2.01% | 263 | 294 | ||||||
| Electorate: 21,103 Valid: 13,053 Spoilt: 165 Quota: 1,865 Turnout: 13,218 (62.64%) | ||||||||||
Swinford
| Swinford — 4 Seats | |||||||
|---|---|---|---|---|---|---|---|
| Party | Candidate | FPv% | Count 1 | Count 2 | Count 3 | ||
| Sinn Féin | Gerry Murray[c 1] | 23.21% | 1,896 | ||||
| Fianna Fáil | Michael Smyth[c 1] | 19.97% | 1,631 | 1,677 | |||
| Fine Gael | Neil Cruise[c 1] | 18.50% | 1,511 | 1,525 | 1,614 | ||
| Fianna Fáil | John Caulfield[c 1] | 15.87% | 1,296 | 1,370 | 1,635 | ||
| Fine Gael | Tom Lavin | 13.83% | 1,130 | 1,188 | 1,337 | ||
| Aontú | Tommy Horan | 7.86% | 642 | 699 | |||
| Independent | Sean Forkin | 0.76% | 62 | 75 | |||
| Electorate: 14,276 Valid: 8,168 Spoilt: 129 Quota: 1,634 Turnout: 8,297 (58.92%) | |||||||
Westport
| Westport — 4 Seats | |||||||||||
|---|---|---|---|---|---|---|---|---|---|---|---|
| Party | Candidate | FPv% | Count 1 | Count 2 | Count 3 | Count 4 | Count 5 | Count 6 | Count 7 | ||
| Independent | Christy Hyland[c 1] | 17.03% | 1,442 | 1,475 | 1,515 | 1,587 | 1,711 | ||||
| Fine Gael | Peter Flynn | 14.76% | 1,250 | 1,274 | 1,347 | 1,407 | 1,519 | 2,015 | |||
| Fianna Fáil | Brendan Mulroy[c 1] | 14.07% | 1,191 | 1,203 | 1,230 | 1,376 | 1,403 | 1,572 | 1,686 | ||
| Independent | John (Johno) O'Malley | 11.33% | 959 | 983 | 1,015 | 1,153 | 1,238 | 1,388 | 1,520 | ||
| Fianna Fáil | Chris Maxwell | 10.62% | 899 | 918 | 931 | 957 | 1,319 | 1,396 | 1,452 | ||
| Fine Gael | Austin Francis O'Malley | 9.80% | 830 | 855 | 873 | 888 | |||||
| Fine Gael | Teresa McGuire[c 1] | 9.48% | 803 | 816 | 875 | 927 | 1,036 | ||||
| Independent | Darragh McGee | 6.26% | 530 | 546 | 589 | ||||||
| Green Party | Cissy Nayiga | 4.31% | 365 | 376 | |||||||
| Independent | Shane Fitzgerald | 1.36% | 115 | ||||||||
| Independent | Frank McAlonan | 0.97% | 82 | ||||||||
| Electorate: 13,589 Valid: 8,466 Spoilt: 137 Quota: 1,694 Turnout: 8,603 (63.31%) | |||||||||||
Footnotes
- Outgoing councillor elected in 2014.
- Outgoing councillor coopted subsequent to the 2014 election.
References
Sources
- "Mayo County Council - Local Election candidates". RTÉ. 13 May 2019. Retrieved 15 May 2019.
- Local Electoral Area Boundary Committee No. 1 (13 June 2018). "Report 2018" (PDF). Government Publications. pp. 80–83, 156. ISBN 978-1-4064-2990-9. Retrieved 8 May 2019.
- Phelan, John Paul (19 December 2018). "S.I. No. 627/2018 — County of Mayo Local Electoral Areas Order 2018". electronic Irish Statute Book (eISB). Retrieved 8 May 2019.
- "Local Election Results, 2019". Mayo County Council. Retrieved 18 June 2019.<
This article is issued from Wikipedia. The text is licensed under Creative Commons - Attribution - Sharealike. Additional terms may apply for the media files.