2006 Richmond upon Thames London Borough Council election
Elections to the Richmond upon Thames London Borough Council were held on 4 May 2006. The whole council was up for election for the first time since the 2002 election. The Liberal Democrats regained control of the council which had been Conservative run from 2002.[1]
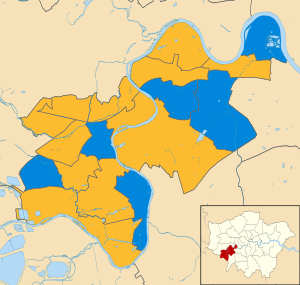
Map of the results of the 2006 Richmond upon Thames council election. Conservatives in blue and Liberal Democrats in yellow.
Election result
| Party | Seats | Gains | Losses | Net gain/loss | Seats % | Votes % | Votes | +/− | |
|---|---|---|---|---|---|---|---|---|---|
| Liberal Democrats | 35 | ||||||||
| Conservative | 18 | ||||||||
| Independent | 1 | ||||||||
Ward results
The electorate of each ward elects three councillors.
Barnes
| Party | Candidate | Votes | % | ± | |
|---|---|---|---|---|---|
| Conservative | Christine Percival | 1,891 | 18.0% | +.8% | |
| Conservative | Paul Hodgins | 1,847 | 17.6% | N/A | |
| Conservative | Benedict Stanberry | 1,749 | 16.6% | N/A | |
| Liberal Democrats | Barbara Westmoreland | 1,569 | 14.9% | +1.4% | |
| Liberal Democrats | Paul Dare | 1,531 | 14.6% | N/A | |
| Liberal Democrats | Marlene Emerson | 1,513 | 14.4% | N/A | |
| Labour | Ann Neimer | 147 | 1.4% | ||
| Labour | Frank Cooper | 146 | 1.4% | ||
| Labour | Ragna Garlake | 123 | 1.2% | ||
| Turnout | 3,578 (6645) |
53.85% | +12.8% | ||
East Sheen
Fulwell and Hampton Hill
Ham, Petersham, and Richmond Riverside
Hampton
Hampton North
Hampton Wick
Heathfield
Kew
Mortlake and Barnes Common
North Richmond
| Party | Candidate | Votes | % | ± | |
|---|---|---|---|---|---|
| Liberal Democrats | Celia Joan Hodges | 1,649 | 48.26 | ||
| Liberal Democrats | Jane Dodds | 1,605 | 46.97 | ||
| Liberal Democrats | Marc Leslie Cranfield-Adams | 1,579 | 46.21 | ||
| Conservative | Philip John Ingram | 1534 | 44.89 | ||
| Conservative | Mark St.John William Roscoe | 1509 | 44.16 | ||
| Conservative | Phillip Brian Taylor | 1494 | 43.72 | ||
| Labour | Derek George Somers | 227 | 6.64 | ||
| Christian Peoples Alliance | Enid Joy Kimmerling | 111 | 3.25 | ||
| Turnout | 3417 (6968) |
49.04 | |||
South Richmond
South Twickenham
St Margaret's and North Twickenham
Teddington
Twickenham Riverside
| Party | Candidate | Votes | % | ± | |
|---|---|---|---|---|---|
| Liberal Democrats | Mary Denise Catherine Carr | 1,838 | 56.76 | ||
| Liberal Democrats | David Stanley Francis Trigg | 1,728 | 53.37 | ||
| Liberal Democrats | Michael Robert Wilson | 1,600 | 49.41 | ||
| Conservative | Joe James Broughton | 992 | 30.64 | ||
| Conservative | Stuart Nigel Leamy | 950 | 29.34 | ||
| Conservative | Anatole Weinberger Pang | 855 | 26.41 | ||
| Green | Gillian Clara Thomas | 440 | 13.59 | ||
| Green | James Richard Page | 392 | 12.11 | ||
| Green | Henry Boscawen Leveson Gower | 321 | 9.91 | ||
| Labour | John Wanklyn Herring Grant | 159 | 4.91 | ||
| Labour | Sheila Doris Nixon | 141 | 4.35 | ||
| UKIP | Andrew James Constantine | 106 | 3.27 | ||
| Turnout | 3238 (6713) |
48.23 | |||
West Twickenham
| Party | Candidate | Votes | % | ± | |
|---|---|---|---|---|---|
| Liberal Democrats | Piers Ronald Allen | 1,610 | 44.61 | ||
| Liberal Democrats | Doreen Edith Helen Lee-Parsons | 1,524 | 42.23 | ||
| Liberal Democrats | Munira Sherali Hassam | 1,497 | 41.48 | ||
| Conservative | Lance Charles Quantril | 1403 | 38.88 | ||
| Conservative | James Jeffrey Duckenfield | 1335 | 36.99 | ||
| Conservative | Alan David Butler | 1321 | 36.60 | ||
| Labour | Damien James Egan | 472 | 13.08 | ||
| Labour | Christian Richmond | 407 | 11.28 | ||
| Labour | Matthew Patrick O'Mullane | 402 | 11.14 | ||
| Green | Jonathan Modral | 385 | 10.67 | ||
| Turnout | 3609 (6922) |
52.14 | |||
Whitton
See also
| Mayor of London | |
|---|---|
| London Assembly | |
| Inner London Education Authority | |
| Greater London Council | |
| London County Council | |
| Borough Councils | |
| Referendums | |
| |
References
- "London Borough of Richmond Upon Thames – Borough Council Election – 4th May 2006" (PDF). 4 May 2006. Retrieved 23 December 2019.
This article is issued from Wikipedia. The text is licensed under Creative Commons - Attribution - Sharealike. Additional terms may apply for the media files.