United States House of Representatives elections, 1872
|
| ||||||||||||||||||||||
| ||||||||||||||||||||||
All 292 seats to the United States House of Representatives 147 seats were needed for a majority | ||||||||||||||||||||||
|---|---|---|---|---|---|---|---|---|---|---|---|---|---|---|---|---|---|---|---|---|---|---|
| ||||||||||||||||||||||
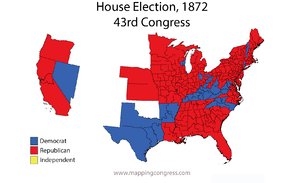 Map of U.S. House elections results from 1872 elections for 43rd Congress | ||||||||||||||||||||||
| ||||||||||||||||||||||
Elections to the United States House of Representatives were held in 1872 and 1873 for representatives to the 43rd Congress, coinciding with the re-election of President Ulysses S. Grant.
Grant's Republican Party increased its majority greatly at the expense of the opposition Democratic Party. The pro-industry outlook of the Republicans appealed to many Northern voters, especially as the post-war economy exploded, and this allowed the party to flourish as the Industrial Revolution grew more widespread. The Republicans also benefited from a continuing association with Civil War victory as well as disarray amongst Democratic leadership.
Election summaries
Following the 1870 Census, the House was reapportioned, initially adding 40 seats,[1] followed by a subsequent amendment to the apportionment act adding another seat to 9 states,[2] resulting in a total increase of 49 seats. No states lost seats, 10 states had no change, 13 states gained 1 seat each, 9 states gained 2 seats, 3 states gained 3 seats, 1 State gained 4 seats, and 1 State gained 5 seats. Prior to the supplemental act, two states (New Hampshire and Vermont) had each lost 1 seat. This was the first reapportionment after the repeal of the three-fifths compromise by the 14th Amendment
| 203 | 89 |
| Republican | Democratic |
| State | Type | Total seats |
Republican | Democratic | |||
|---|---|---|---|---|---|---|---|
| Seats | Change | Seats | Change | Seats | Change | ||
| Alabama | District + 2 at-large |
8 | 6[Note 4] | 2 | |||
| Arkansas | District + at-large |
4 | 4[Note 4] | 0 | |||
| California | District | 4 | 3 | 1 | |||
| Connecticut[Note 5] | District | 4 | 3 | 1 | |||
| Delaware | At-large | 1 | 1 | 0 | |||
| Florida | At-large | 2 | 2 | 0 | |||
| Georgia | District | 9 | 2 | 7 | |||
| Illinois | District | 19 | 14 | 5 | |||
| Indiana[Note 6] | District + 3 at-large |
13 | 10 | 3 | |||
| Iowa | District | 9 | 9 | 0 | |||
| Kansas | At-large | 3 | 3 | 0 | |||
| Kentucky | District | 10 | 0 | 10 | |||
| Louisiana | District + 1 at-large |
6 | 6[Note 4] | 0 | |||
| Maine[Note 6] | District | 5 | 5 | 0 | |||
| Maryland | District | 6 | 2 | 4 | |||
| Massachusetts | District | 11 | 11 | 0 | |||
| Michigan | District | 9 | 9 | 0 | |||
| Minnesota | District | 3 | 3 | 0 | |||
| Mississippi | District | 6 | 5 | 1 | |||
| Missouri | District | 13 | 4 | 9 | |||
| Nebraska[Note 6] | At-large | 1 | 1 | 0 | |||
| Nevada | At-large | 1 | 0 | 1 | |||
| New Hampshire[Note 5] | District | 3 | 2 | 1 | |||
| New Jersey | District | 7 | 6 | 1 | |||
| New York | District + 1 at-large |
33 | 24 | 9 | |||
| North Carolina[Note 6] | District | 8 | 3 | 5 | |||
| Ohio[Note 6] | District | 20 | 14[Note 4] | 6 | |||
| Oregon[Note 6] | At-large | 1 | 1 | 0 | |||
| Pennsylvania[Note 6] | District + 3 at-large |
27 | 22 | 5 | |||
| Rhode Island | District | 2 | 2 | 0 | |||
| South Carolina | District + 1 at-large |
5 | 5 | 0 | |||
| Tennessee | District + 1 at-large |
10 | 7 | 3 | |||
| Texas | District + 2 at-large |
6 | 0 | 6 | |||
| Vermont[Note 6] | District | 3 | 3 | 0 | |||
| Virginia | District | 9 | 4 | 5 | |||
| West Virginia[Note 6] | District | 3 | 1 | 2[Note 3] | |||
| Wisconsin | District | 8 | 6 | 2 | |||
| Total | 292 | 203[Note 7] 69.5% |
30.5% |
89[Note 3] 30.5% |
|||
Election dates
In 1845, Congress passed a law providing for a uniform nationwide date for choosing Presidential electors.[3] This law did not affect election dates for Congress, which remained within the jurisdiction of State governments, but over time, the States moved their Congressional elections to this date as well. In 1872–73, there were still 9 states with earlier election dates, and 2 states with later election dates:
- Early elections (1872):
- June 4 Oregon
- August 1 North Carolina
- August 27 West Virginia
- September 3 Vermont
- September 9 Maine
- October 8 Indiana, Nebraska, Ohio, Pennsylvania
- Late elections (1873):
- March 11, 1873 New Hampshire
- April 7, 1873 Connecticut
Alabama
Arkansas
California
A new seat was added, following the 1870 U.S. Census, bringing the delegation up from three to four Representatives.
| District | Incumbent | Party | First elected | Result | Candidates |
|---|---|---|---|---|---|
| California 1 | None (New seat) | New district. New member elected. Republican gain. |
√ Charles Clayton (Republican) 52.3% William A. Piper (Democratic) 47.7% | ||
| California 2 | Aaron Augustus Sargent | Republican | 1868 | Incumbent retired. New member elected. Republican hold. |
√ Horace F. Page (Republican) 51.8% Paschal Coggins (Democratic) 48.2% |
| California 3 | John M. Coghlan | Republican | 1871 | Incumbent lost re-election. New member elected. Democratic gain. |
√ John K. Luttrell (Democratic) 51.7% John M. Coghlan (Republican) 48.3% |
| California 4 | Sherman O. Houghton (Redistricted from the 1st district) |
Republican | 1871 | Incumbent re-elected. | √ Sherman O. Houghton (Republican) 53.6% E. J. C. Kewen (Democratic) 46.4% |
Florida
Florida gained a second seat after the 1870 census, but delayed districting until 1874, electing both Representatives at-large for this election.
| District | Incumbent | Party | First elected |
Result | Candidates |
|---|---|---|---|---|---|
| Florida at-large 2 seats on a general ticket |
Josiah T. Walls | Republican | 1870 | Incumbent re-elected. | √ William J. Purman (Republican) 26.3% Josiah T. Walls (Republican) 26.2% Silas L. Niblack (Democratic) 23.8% Charles W. Jones (Democratic) 23.7% |
| None (New seat) | New seat. New member elected. Republican gain. | ||||
Georgia
Illinois
Indiana
Iowa
Kentucky
Louisiana
Maine
Maryland
Massachusetts
Michigan
Minnesota
Mississippi
Missouri
Nevada
New Jersey
New York
North Carolina
Ohio
After redistricting and eleven retirements, only four of the nineteen incumbents were re-elected.
| District | Incumbent | Party | First elected |
Result | Candidates[4] |
|---|---|---|---|---|---|
| Ohio 1 | Ozro J. Dodds | Democratic | 1872 (Special) | Incumbent retired. New member elected. Democratic hold. |
√ Milton Sayler (Democratic) 58.4% Benjamin Eggleston (Republican) 41.6% |
| Ohio 2 | Job E. Stevenson | Republican | 1868 | Incumbent retired. New member elected. Liberal Republican gain. |
√ Henry B. Banning (Liberal Republican) 53.7% Rutherford B. Hayes (Republican) 46.3% |
| Ohio 3 | Lewis D. Campbell | Democratic | 1870 | Incumbent retired. New member elected. Republican gain. |
√ John Quincy Smith (Republican) 52.1% James W. Sohn (Democratic) 47.9% |
| Ohio 4 | John F. McKinney | Democratic | 1870 | Incumbent retired. New member elected. Republican gain. |
√ Lewis B. Gunckel (Republican) 53.1% John J. Winans (Democratic) 46.9% |
| Ohio 5 | Charles N. Lamison | Democratic | 1870 | Incumbent re-elected. | √ Charles N. Lamison (Democratic) 60.3% Samuel Lybrand (Republican) 39.7% |
| Ohio 6 | John Armstrong Smith | Republican | 1868 | Incumbent retired. New member elected. Republican hold. |
√ Isaac R. Sherwood (Republican) 51.5% Frank H. Hurd (Democratic) 48.5% |
| Ohio 7 | Samuel Shellabarger | Republican | 1870 | Incumbent retired. New member elected. Democratic gain. |
√ Lawrence T. Neal (Democratic) 52.5% John Thomas Wilson (Republican) 47.5% |
| John Thomas Wilson (Redistricted from the 11th district) |
Republican | 1866 | Incumbent lost re-election. Republican loss. | ||
| Ohio 8 | John Beatty | Republican | 1868 (Special) | Incumbent retired. New member elected. Republican hold. |
√ William Lawrence (Republican) 57.9% John P. Musson (Democratic) 42.1% |
| Ohio 9 | George W. Morgan (Redistricted from the 13th district) |
Democratic | 1868 | Incumbent lost re-election. New member elected. Republican gain. |
√ James W. Robinson (Republican) 50.8% George W. Morgan (Democratic) 49.2% |
| Ohio 10 | Charles Foster (Redistricted from the 9th district) |
Republican | 1870 | Incumbent re-elected. | √ Charles Foster (Republican) 51.2% Rush R. Sloane (Democratic) 48.8% |
| Erasmus D. Peck | Republican | 1870 (Special) | Incumbent retired. Republican loss. | ||
| Ohio 11 | None (New seat) | New district. New member elected. Republican gain. |
√ Hezekiah S. Bundy (Republican) 56.2% Samuel P. Nash (Democratic) 43.8% | ||
| Ohio 12 | Philadelph Van Trump | Democratic | 1866 | Incumbent retired. New member elected. Democratic hold. |
√ Hugh J. Jewett (Democratic) 58.8% James Taylor (Republican) 41.2% |
| Ohio 13 | None (New seat) | New district. New member elected. Democratic gain. |
√ Milton I. Southard (Democratic) 54.5% Lucius P. Marsh (Republican) 45.5% | ||
| Ohio 14 | James Monroe | Republican | 1870 | Re-districted Democratic gain. |
√ John Berry (Democratic) 57.9% Thomas E. Douglas (Republican) 42.1% |
| Ohio 15 | William P. Sprague | Republican | 1870 | Incumbent re-elected. | √ William P. Sprague (Republican) 52.0% Richard R. Hudson (Democratic) 48.0% |
| Ohio 16 | John Bingham | Republican | 1864 | Incumbent lost re-nomination. New member elected. Republican hold. |
√ Lorenzo Danford (Republican) 56.5% Christian L. Poorman (Democratic) 43.5% |
| Ohio 17 | Jacob A. Ambler | Republican | 1868 | Incumbent retired. New member elected. Republican hold. |
√ Laurin D. Woodworth (Republican) 54.0% Richard Brown (Democratic) 46.0% |
| Ohio 18 | William H. Upson | Republican | 1868 | Incumbent retired. New member elected. Republican hold. |
√ James Monroe (Republican) 58.7% Norton Strange Townshend (Democratic) 41.3% |
| Ohio 19 | James A. Garfield | Republican | 1862 | Incumbent re-elected. | √ James A. Garfield (Republican) 69.9% Milton Sutliff (Democratic) 30.1% |
| Ohio 20 | None (New seat) | New district. New member elected. Republican gain. |
√ Richard C. Parsons (Republican) 55.8% Selah Chamberlain (Democratic) 44.2% | ||
Oregon
Pennsylvania
Rhode Island
South Carolina
Tennessee
Texas
Vermont
Virginia
West Virginia
Wisconsin
See also
Notes
- ↑ In the majority of states; 11 states held elections on different dates between June 4, 1872 and April 7, 1873.
- ↑ Includes 4 Liberal Republicans.
- 1 2 3 Includes 1 Independent Democrat, John J. Davis, elected to WV-01.
- 1 2 3 4 Includes 1 Liberal Republican.
- 1 2 Elections held late.
- 1 2 3 4 5 6 7 8 9 Elections held early.
- ↑ Includes 4 Liberal Republicans.
References
Bibliography
- Dubin, Michael J. (March 1, 1998). United States Congressional Elections, 1788-1997: The Official Results of the Elections of the 1st Through 105th Congresses. McFarland and Company. ISBN 978-0786402830.
- Martis, Kenneth C. (January 1, 1989). The Historical Atlas of Political Parties in the United States Congress, 1789-1989. Macmillan Publishing Company. ISBN 978-0029201701.
- Moore, John L., ed. (1994). Congressional Quarterly's Guide to U.S. Elections (Third ed.). Congressional Quarterly Inc. ISBN 978-0871879967.
- "Party Divisions of the House of Representatives* 1789–Present". Office of the Historian, House of United States House of Representatives. Retrieved January 21, 2015.
External links
- Office of the Historian (Office of Art & Archives, Office of the Clerk, U.S. House of Representatives)