Stock market crash
A stock market crash is a sudden dramatic decline of stock prices across a significant cross-section of a stock market, resulting in a significant loss of paper wealth. Crashes[1] are driven by panic as much as by underlying economic factors. They often follow speculative stock market bubbles.
Stock market crashes are social phenomena where external economic events combine with crowd behavior and psychology in a positive feedback loop where selling by some market participants drives more market participants to sell. Generally speaking, crashes usually occur under the following conditions:[1] a prolonged period of rising stock prices and excessive economic optimism, a market where P/E ratios(Price-Earning ratio) exceed long-term averages, and extensive use of margin debt and leverage by market participants. Other aspects such as wars, large-corporation hacks, changes in federal laws and regulations, and natural disasters of highly economically productive areas may also influence a significant decline in the NYSE value of a wide range of stocks. All such stock drops may result in the rise of stock prices for corporations competing against the affected corporations.
There is no numerically specific definition of a stock market crash but the term commonly applies to steep double-digit percentage losses in a stock market index over a period of several days. Crashes are often distinguished from bear markets by panic selling and abrupt, dramatic price declines. Bear markets are periods of declining stock market prices that are measured in months or years. Crashes are often associated with bear markets, however, they do not necessarily go hand in hand. The crash of 1987, for example, did not lead to a bear market. Likewise, the Japanese bear market of the 1990s occurred over several years without any notable crashes.
History


Tulip Mania (in the mid-1630s) is often considered to be the first recorded speculative bubble. Historically, early stock market bubbles and crashes have also their roots in socio-politico-economic activities of the 17th-century Dutch Republic (the birthplace of the world's first formal stock exchange and market),[3][4][5][6][7] the Dutch East India Company (the world's first formally listed public company), and the Dutch West India Company (WIC/GWIC) in particular. As Stringham & Curott (2015) remarked, "Business ventures with multiple shareholders became popular with commenda contracts in medieval Italy (Greif, 2006, p. 286), and Malmendier (2009) provides evidence that shareholder companies date back to ancient Rome. Yet the title of the world's first stock market deservedly goes to that of seventeenth-century Amsterdam, where an active secondary market in company shares emerged. The two major companies were the Dutch East India Company and the Dutch West India Company, founded in 1602 and 1621. Other companies existed, but they were not as large and constituted a small portion of the stock market (Israel [1989] 1991, 109–112; Dehing and 't Hart 1997, 54; de la Vega [1688] 1996, 173)."[8]
Mathematical theory
The mathematical description of stock market movements has been a subject of intense interest. The conventional assumption has been that stock markets behave according to a random log-normal distribution.[9] Among others, mathematician Benoît Mandelbrot suggested as early as 1963 that the statistics prove this assumption incorrect.[10] Mandelbrot observed that large movements in prices (i.e. crashes) are much more common than would be predicted from a log-normal distribution. Mandelbrot and others suggested that the nature of market moves is generally much better explained using non-linear analysis and concepts of chaos theory.[11] This has been expressed in non-mathematical terms by George Soros in his discussions of what he calls reflexivity of markets and their non-linear movement.[12] George Soros said in late October 1987, 'Mr. Robert Prechter's reversal proved to be the crack that started the avalanche'.[13][14]
Research at the Massachusetts Institute of Technology suggests that there is evidence the frequency of stock market crashes follows an inverse cubic power law.[15] This and other studies such as Prof. Didier Sornette's work suggest that stock market crashes are a sign of self-organized criticality in financial markets.[16] In 1963, Mandelbrot proposed that instead of following a strict random walk, stock price variations executed a Lévy flight.[17] A Lévy flight is a random walk that is occasionally disrupted by large movements. In 1995, Rosario Mantegna and Gene Stanley analyzed a million records of the S&P 500 market index, calculating the returns over a five-year period.[18] Researchers continue to study this theory, particularly using computer simulation of crowd behaviour, and the applicability of models to reproduce crash-like phenomena.
Research at the New England Complex Systems Institute has found warning signs of crashes using new statistical analysis tools of complexity theory. This work suggests that the panics that lead to crashes come from increased mimicry in the market. A dramatic increase in market mimicry occurred during the whole year before each market crash of the past 25 years, including the recent financial crisis. When investors closely follow each other's cues, it is easier for panic to take hold and affect the market. This work is a mathematical demonstration of a significant advance warning sign of impending market crashes.[19][20]
A recent phenomenon, known as the RR Reversal, has also been well documented in recent years – where a rapidly increasing stock experiences an inexplicable and sudden pullback to the magnitude of 10 – 40% within a month.
Major crashes in the United States
Panic of 1907
In 1907 and in 1908, the NYSE fell by nearly 50% due to a variety of factors, led by the manipulation of copper stocks by the Knickerbocker company.[21] Shares of United Copper rose gradually up to October, and thereafter crashed, leading to panic.[22][23] A number of investment trusts and banks that had invested their money in the stock market fell and started to close down. Further bank runs were prevented due to the intervention of J.P.Morgan.[24] The panic continued to 1908 finally and led to the formation of the Federal reserve in 1913.[25]
Wall Street Crash of 1929
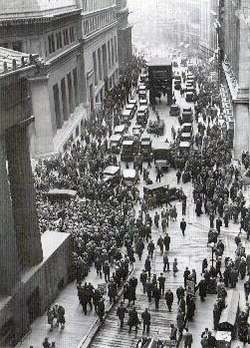
The economy had been growing for most of the Roaring Twenties. It was a technological golden age, as innovations such as the radio, automobile, aviation, telephone, and the power grid were deployed and adopted. Companies that had pioneered these advances, like Radio Corporation of America (RCA) and General Motors, saw their stocks soar. Financial corporations also did well, as Wall Street bankers floated mutual fund companies (then known as investment trusts) like the Goldman Sachs Trading Corporation. Investors were infatuated with the returns available in the stock market, especially by the use of leverage through margin debt.
On August 24, 1921, the Dow Jones Industrial Average stood at a value of 63.9. By September 3, 1929, it had risen more than sixfold, touching 381.2. It would not regain this level for another 25 years. By the summer of 1929, it was clear that the economy was contracting, and the stock market went through a series of unsettling price declines. These declines fed investor anxiety, and events came to a head on October 24, 28, and 29 (known respectively as Black Thursday, Black Monday, and Black Tuesday).
On Black Monday, the Dow Jones Industrial Average fell 38.33 points to 260, a drop of 12.8%. The deluge of selling overwhelmed the ticker tape system that normally gave investors the current prices of their shares. Telephone lines and telegraphs were clogged and were unable to cope. This information vacuum only led to more fear and panic. The technology of the New Era, previously much celebrated by investors, now served to deepen their suffering.
The following day, Black Tuesday, was a day of chaos. Forced to liquidate their stocks because of margin calls, overextended investors flooded the exchange with sell orders. The Dow fell 30.57 points to close at 230.07 on that day. The glamour stocks of the age saw their values plummet. Across the two days, the Dow Jones Industrial Average fell 23%.
By the end of the weekend of November 11, the index stood at 228, a cumulative drop of 40% from the September high. The markets rallied in succeeding months, but it was a temporary recovery that led unsuspecting investors into further losses. The Dow Jones Industrial Average lost 89% of its value before finally bottoming out in July 1932. The crash was followed by the Great Depression, the worst economic crisis of modern times, which plagued the stock market and Wall Street throughout the 1930s.
October 19, 1987
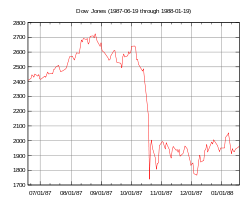
The mid-1980s were a time of strong economic optimism. From August 1982 to its peak in August 1987, the Dow Jones Industrial Average (DJIA) grew from 776 to 2722. The rise in market indices for the 19 largest markets in the world averaged 296 percent during this period. The average number of shares traded on the NYSE(New York Stock Exchange) had risen from 65 million shares to 181 million shares.[26]
The crash on October 19, 1987, a date that is also known as Black Monday, was the climactic culmination of a market decline that had begun five days before on October 14. The DJIA fell 3.81 percent on October 14, followed by another 4.60 percent drop on Friday, October 16. On Black Monday, the Dow Jones Industrials Average plummeted 508 points, losing 22.6% of its value in one day. The S&P 500 dropped 20.4%, falling from 282.7 to 225.06. The NASDAQ Composite lost only 11.3%, not because of restraint on the part of sellers, but because the NASDAQ market system failed. Deluged with sell orders, many stocks on the NYSE faced trading halts and delays. Of the 2,257 NYSE-listed stocks, there were 195 trading delays and halts during the day.[27] The NASDAQ market fared much worse. Because of its reliance on a "market making" system that allowed market makers to withdraw from trading, liquidity in NASDAQ stocks dried up. Trading in many stocks encountered a pathological condition where the bid price for a stock exceeded the ask price. These "locked" conditions severely curtailed trading. On October 19, trading in Microsoft shares on the NASDAQ lasted a total of 54 minutes.
The Crash was the greatest single-day loss that Wall Street had ever suffered in continuous trading up to that point. Between the start of trading on October 14 to the close on October 19, the DJIA lost 760 points, a decline of over 31 percent.
The 1987 Crash was a worldwide phenomenon. The FTSE 100 Index lost 10.8% on that Monday and a further 12.2% the following day. In the month of October, all major world markets declined substantially. The least affected was Austria (a fall of 11.4%) while the most affected was Hong Kong with a drop of 45.8%. Out of 23 major industrial countries, 19 had a decline greater than 20%.[28]
Despite fears of a repeat of the 1930s Depression, the market rallied immediately after the crash, posting a record one-day gain of 102.27 the very next day and 186.64 points on Thursday October 22. It took only two years for the Dow to recover completely; by September 1989, the market had regained all of the value it had lost in the 1987 crash. The Dow Jones Industrial Average gained six-tenths of a percent during the calendar year 1987.
No definitive conclusions have been reached on the reasons behind the 1987 Crash. Stocks had been in a multi-year bull run and market P/E ratios in the U.S. were above the post-war average. The S&P 500 was trading at 23 times earnings, a postwar high and well above the average of 14.5 times earnings.[29] Herd behavior and psychological feedback loops play a critical part in all stock market crashes but analysts have also tried to look for external triggering events. Aside from the general worries of stock market overvaluation, blame for the collapse has been apportioned to such factors as program trading, portfolio insurance and derivatives, and prior news of worsening economic indicators (i.e. a large U.S. merchandise trade deficit and a falling U.S. dollar, which seemed to imply future interest rate hikes).[30]
One of the consequences of the 1987 Crash was the introduction of the circuit breaker or trading curb on the NYSE. Based upon the idea that a cooling off period would help dissipate investor panic, these mandatory market shutdowns are triggered whenever a large pre-defined market decline occurs during the trading day.
Crash of 2008–2009


On September 16, 2008, failures of massive financial institutions in the United States, due primarily to exposure to packaged subprime loans and credit default swaps issued to insure these loans and their issuers, rapidly devolved into a global crisis. This resulted in a number of bank failures in Europe and sharp reductions in the value of stocks and commodities worldwide. The failure of banks in Iceland resulted in a devaluation of the Icelandic króna and threatened the government with bankruptcy. Iceland obtained an emergency loan from the International Monetary Fund in November.[31] In the United States, 15 banks failed in 2008, while several others were rescued through government intervention or acquisitions by other banks.[32] On October 11, 2008, the head of the International Monetary Fund (IMF) warned that the world financial system was teetering on the "brink of systemic meltdown".[33]
The economic crisis caused countries to close their markets temporarily.
On October 8, the Indonesian stock market halted trading, after a 10% drop in one day.
The Times of London reported that the meltdown was being called the Crash of 2008, and older traders were comparing it with Black Monday in 1987. The fall that week of 21% compared to a 28.3% fall 21 years earlier, but some traders were saying it was worse. "At least then it was a short, sharp, shock on one day. This has been relentless all week."[34] Business Week also referred to the crisis as a "stock market crash" or the "Panic of 2008."[35]
From October 6–10 the Dow Jones Industrial Average (DJIA) closed lower in all five sessions. Volume levels were record-breaking. The DJIA fell over 1,874 points, or 18%, in its worst weekly decline ever on both a points and percentage basis. The S&P 500 fell more than 20%.[36] The week also set 3 top ten NYSE Group Volume Records with October 8 at #5, October 9 at #10, and October 10 at #1.[37]
Having been suspended for three successive trading days (October 9, 10, and 13), the Icelandic stock market reopened on 14 October, with the main index, the OMX Iceland 15, closing at 678.4, which was about 77% lower than the 3,004.6 at the close on October 8. This reflected that the value of the three big banks, which had formed 73.2% of the value of the OMX Iceland 15, had been set to zero.
On October 24, many of the world's stock exchanges experienced the worst declines in their history, with drops of around 10% in most indices.[38] In the US, the DJIA fell 3.6%, i.e. not as much as other markets.[39] Instead, both the US dollar and Japanese yen soared against other major currencies, particularly the British pound and Canadian dollar, as world investors sought safe havens. Later that day, the deputy governor of the Bank of England, Charles Bean, suggested that "This is a once in a lifetime crisis, and possibly the largest financial crisis of its kind in human history."[40]
By March 6, 2009 the DJIA had dropped 54% to 6,469 (before beginning to recover) from its peak of 14,164 on October 9, 2007, over a span of 17 months.[41][42]
Mitigation strategies
One mitigation strategy has been the introduction of trading curbs, also known as "circuit breakers", which are a trading halt in the cash market and the corresponding trading halt in the derivative markets triggered by the halt in the cash market, all of which are affected based on substantial movements in a broad market indicator. Since their inception, circuit breakers have been modified to prevent both speculative gains and dramatic losses within a small time frame.[43]
United States
There are three thresholds, which represent different levels of decline in the DJIA in terms of points. These thresholds are set at the beginning of each quarter to establish a specific point value. For example, in the second quarter of 2011, Threshold 1 was a drop of 1200 points, Threshold 2 was 2400 points, and Threshold 3 was 3600 points.[44]
- If Threshold 2 is breached before 1 pm, the market closes for two hours. If such a decline occurs between 1 pm and 2 pm, there is a one-hour pause. The market would close for the day if stocks sank to that level after 2 pm
- If Threshold 3 is breached, the market would close for the day, regardless of the time.
France
In France, the main French stock index is called the CAC 40. Daily price limits are implemented in cash and derivative markets. Securities traded on the markets are divided into three categories according to the number and volume of daily transactions. Price limits for each security vary by category. For instance, for the more liquid category, when the price movement of a security from the previous day's closing price exceeds 10%, the quotation is suspended for 15 minutes, and transactions are then resumed. If the price then goes up or down by more than 5%, transactions are again suspended for 15 minutes. The 5% threshold may apply once more before transactions are halted for the rest of the day. When such a suspension occurs, transactions on options based on the underlying security are also suspended. Further, when more than 35% of the capitalization of the CAC40 Index cannot be quoted, the calculation of the CAC40 Index is suspended and the index is replaced by a trend indicator. When less than 25% of the capitalization of the CAC40 Index can be quoted, quotations on the derivative markets are suspended for half an hour or one hour, and additional margin deposits are requested.[43]
See also
- List of stock market crashes
- VIX, Chicago Board Options Exchange Market Volatility Index
General:
References
- 1 2 Galbraith, J. The Great Crash 1929, 1988 edition, Houghton Mifflin Co. Boston, p.xii-xvii
- ↑ Shiller, Robert: The United East India Company and Amsterdam Stock Exchange [00:01:14], in Economics 252, Financial Markets: Lecture 4 – Portfolio Diversification and Supporting Financial Institutions. (Open Yale Courses, 2011)
- ↑ Brooks, John: The Fluctuation: The Little Crash in '62, in Business Adventures: Twelve Classic Tales from the World of Wall Street. (New York: Weybright & Talley, 1968)
- ↑ Neal, Larry (2005). "Venture Shares of the Dutch East India Company", in Origins of Value, in The Origins of Value: The Financial Innovations that Created Modern Capital Markets, Goetzmann & Rouwenhorst (eds.), Oxford University Press, 2005, pp. 165–175
- ↑ Shiller, Robert (2011). Economics 252, Financial Markets: Lecture 4 – Portfolio Diversification and Supporting Financial Institutions (Open Yale Courses). [Transcript]
- ↑ Petram, Lodewijk: The World's First Stock Exchange: How the Amsterdam Market for Dutch East India Company Shares Became a Modern Securities Market, 1602–1700. Translated from the Dutch by Lynne Richards. (Columbia University Press, 2014, 304pp)
- ↑ Macaulay, Catherine R. (2015). "Capitalism's renaissance? The potential of repositioning the financial 'meta-economy'". (Futures, Volume 68, April 2015, p. 5–18)
- ↑ Stringham, Edward Peter; Curott, Nicholas A.: On the Origins of Stock Markets [Part IV: Institutions and Organizations; Chapter 14], pp. 324-344, in The Oxford Handbook of Austrian Economics, edited by Peter J. Boettke and Christopher J. Coyne. (Oxford University Press, 2015, ISBN 978-0199811762)
- ↑ Malkiel, Burton G. (1973). A Random Walk Down Wall Street (6th ed.). W.W. Norton & Company, Inc. ISBN 0-393-06245-7.
- ↑ "The (Mis)behavior of Markets". bearcave.com.
- ↑ 'Father of Fractals' takes on the stock market
- ↑ Soros, G. Alchemy of Finance, Wiley Investment Classics. 2003
- ↑ Hulbert, Mark. "Short term vs. long-term". marketwatch.com.
- ↑ Thomas Jr, Landon (October 13, 2007). "The Man Who Won as Others Lost". The New York Times. Retrieved May 24, 2010.
- ↑ "Stock trade patterns could predict financial earthquakes". mit.edu.
- ↑ Didier Sornette, Professor of Geophysics Archived 2009-02-21 at the Wayback Machine.
- ↑ Mandelbrot, Benoit (1 January 1963). "The Variation of Certain Speculative Prices". 36 ([object Attr]): 1–394 – via RePEc – IDEAS.
- ↑ Mantegna, Rosario N.; Stanley, H. Eugene (6 July 1995). "Scaling behaviour in the dynamics of an economic index". Nature. 376 (6535): 46–49. Bibcode:1995Natur.376...46M. doi:10.1038/376046a0 – via www.nature.com.
- ↑ Harmon, Dion; de Aguiar, Marcus A. M.; Chinellato, David D.; Braha, Dan; Epstein, Irving R.; Bar-Yam, Yaneer (13 February 2011). "Predicting economic market crises using measures of collective panic". arXiv:1102.2620 [q-fin.ST].
- ↑ Keim, Brandon. "Possible Early Warning Sign for Market Crashes". wired.com.
- ↑ "AMERICAN BANKS "IN THE JUNGLE"". The Advertiser. Adelaide. March 16, 1933. p. 8. Retrieved November 22, 2012 – via National Library of Australia.
- ↑ Born of a Panic: Forming the Fed System
- ↑ Tucker, Abigail (October 9, 2008). "The Financial Panic of 1907: Running from History". Smithsonian Magazine. Retrieved September 27, 2017.
- ↑ Panic of 1907: J.P. Morgan Saves the Day
- ↑ Nocholas, Tom. Stock market swings and the value of innovation (PDF). Boston, Massachusetts: Harvard business school. Retrieved 7 February 2018.
- ↑ Preliminary Observations on the October 1987 Crash, United States General Accounting Office (GAO). January 1988. GAO/GGD-88-38. p.14, p.36
- ↑ U.S. GAO op. cit. p.55
- ↑ Sornette, D (2003). "Critical Market Crashes". Physics Reports. 378 (1): 1–98. arXiv:cond-mat/0301543. Bibcode:2003PhR...378....1S. doi:10.1016/S0370-1573(02)00634-8.
- ↑ U.S. GAO op. cit. p.37
- ↑ — What caused the Stock Market Crash of 1987?
- ↑ "BBC NEWS – Business – IMF approves $2.1bn Iceland loan". bbc.co.uk.
- ↑ Marketwatch.com Two banks fold, bringing total to 15 failures this year
- ↑ Canada.com Archived 2009-07-08 at the Wayback Machine. Finance ministers face down crisis as IMF head warns of 'meltdown'
- ↑ Business.timesonline.co.uk The Times
- ↑ Stock Market Crash: Understanding the Panic
- ↑ Telegraph.co.uk Financial crisis: US stock markets suffer worst week on record
- ↑ NYXdata.com NYSE Group Volume Records — Top 10 Days
- ↑ Marketwatch.com Indexes fall hard on bloody Friday
- ↑ |headline|quote|text|&par=yahoo CNBC.com Stocks Selloff Fails to Meet Expectations
- ↑ Dailymail.co.uk 'Worst financial crisis in human history': Bank boss's warning as pound suffers biggest fall for 37 years
- ↑ Leatherheadblog.com Archived 2010-11-24 at Archive.is
- ↑ "^DJI Interactive Stock Chart – Dow Jones Industrial Average Stock – Yahoo Finance". yahoo.com.
- 1 2 "Wirtschafts Nachrichten aus der Schweiz -". riskinstitute.ch.
- ↑ NYSE.com Archived 2011-09-20 at the Wayback Machine.
External links
- Le Bris, David. "What is a market crash?" The Economic History Review
- Stock Market Crash of 1929.
- Crash of 2014: Like 1929, you’ll never hear it coming by Maketwatch.
- Can the Government Control a Stock Market Crash By HowStuffWorks.
- Interactive Chart of the 1929 Crash and Bear Market by MacroTrends.