VIX
The CBOE Volatility Index, known by its ticker symbol VIX, is a popular measure of the stock market's expectation of volatility implied by S&P 500 index options, calculated and published by the Chicago Board Options Exchange (CBOE). It is colloquially referred to as the fear index or the fear gauge.
The formulation of a volatility index, and financial instruments based on such an index, were developed by Menachem Brenner and Dan Galai in 1986.[1][2] They stated the "volatility index, to be named Sigma Index, would be updated frequently and used as the underlying asset for futures and options. ... A volatility index would play the same role as the market index play for options and futures on the index."
In 1986, Brenner and Galai proposed the creation of a series of volatility indices, beginning with an index on stock market volatility, and moving to interest rate and foreign exchange rate volatility to the American Stock Exchange. In 1987, Brenner and Galai met with Joseph Levine and Deborah Clayworth at the CBOE to propose various structures for a tradeable index on volatility; those discussions continued until 1991.
The current VIX concept formulates a theoretical expectation of stock market volatility in the near future. The current VIX index value quotes the expected annualized change in the S&P 500 index over the following 30 days, as computed from options-based theory and current options-market data.[3]
The CBOE retained consultant Robert Whaley in 1992 to develop a tradable volatility instrument based on index option prices.[4] Based on historical index option prices, Whaley computed a data series of retrospective daily VIX levels from January 1986 onward. CBOE began publish real-time VIX data in 1993.
Specifications
The index takes as inputs the market prices of the call and put options on the S&P 500 for the "front month" (that is, the next monthly expiration date for the options) and the second month expirations. Options are ignored where their strike prices are below the level where two consecutive bid prices are zero.[5] The goal is to estimate the implied volatility of S&P 500 index options at an average expiration of 30 days.
The VIX is the volatility of a variance swap and not that of a volatility swap (volatility being the square root of variance, or standard deviation). A variance swap can be perfectly statically replicated through vanilla puts and calls, whereas a volatility swap requires dynamic hedging. The VIX is the square root of the risk-neutral expectation of the S&P 500 variance over the next 30 calendar days and is quoted as an annualized standard deviation.
The VIX is calculated and disseminated in real-time by the Chicago Board Options Exchange. On March 26, 2004, trading in futures on the VIX began on CBOE Futures Exchange (CFE). On February 24, 2006, it became possible to trade options on the VIX. Several exchange-traded funds seek to track its performance.
The VIX replaced the older VXO as the preferred volatility index used by the media. VXO was a measure of implied volatility calculated using 30-day S&P 100 index at-the-money options.[6]
Interpretation
The VIX is quoted in percentage points and represents the expected range of movement in the S&P 500 index over the next year, at a 68% confidence level (i.e. one standard deviation of the normal probability curve). For example, if the VIX is 15, this represents an expected annualized change, with a 68% probability, of less than 15% up or down. The expected volatility range for a single month can be calculated from this figure by dividing the VIX figure of 15 not by 12, but by √12 which would imply a range of +/- 4.33% over the next 30-day period.[7] Similarly, expected volatility for a week would be 15 divided by √52, or +/- 2.08%. Converting annual expected volatility to a single trading day must account for the number trading days in a calendar year (that is, the fact that markets are not open on weekends or holidays). Trading days typically amount to 252 days out of a given calendar year, so the conversion of 15% annual volatility is 15 divided by √252, or +/- 0.94% per trading day.
The price of call and put options can be used to calculate implied volatility, because volatility is one of the factors used to calculate the value of these options. Higher volatility of the underlying security makes an option more valuable, because there is a greater probability that the option will expire in the money (i.e., with a market value above zero). Thus, a higher option price implies greater volatility, other things being equal.
Even though the VIX is quoted as a percentage rather than a dollar amount, multiple VIX-based derivative instruments are in existence (totaling roughly $4 Billion in AUM),[8] including:
- VIX futures contracts, which began trading in 2004
- exchange-listed VIX options, which began trading in February 2006.
- VIX futures based exchange-traded notes and exchange-traded funds, such as:
- S&P 500 VIX Short-Term Futures ETN (NYSE: VXX) and S&P 500 VIX Mid-Term Futures ETN (NYSE: VXZ) launched by Barclays iPath in February 2009.
- S&P 500 VIX ETF (LSE: VIXS) launched by Source UK Services in June 2010.
- VIX Short-Term Futures ETF (NYSE: VIXY) and VIX Mid-Term Futures ETF (NYSE: VIXM) launched by ProShares in January 2011.
Similar indices for bonds include the MOVE and LBPX indices.
Although the VIX is often called the "fear index", a high VIX is not necessarily bearish for stocks.[9] Instead, the VIX is a measure of market perceived volatility in either direction, including to the upside. In practical terms, when investors anticipate large upside volatility, they are unwilling to sell upside call stock options unless they receive a large premium. Option buyers are willing to pay such high premiums only if similarly anticipating a large upside move. The resulting aggregate of increases in upside stock option call prices raises the VIX just as the aggregate growth in downside stock put option premiums that occurs when option buyers and sellers anticipate a likely sharp move to the downside. When the market is believed as likely to soar as to plummet, writing any option that will cost the writer in the event of a sudden large move in either direction may look equally risky.
Hence high VIX readings mean investors see significant risk that the market will move sharply, whether downward or upward. The highest VIX readings occur when investors anticipate that huge moves in either direction are likely. Only when investors perceive neither significant downside risk nor significant upside potential will the VIX be low.
The Black–Scholes formula uses a model of stock price dynamics to estimate how an option’s value depends on the volatility of the underlying assets.
Limitation and GVIX
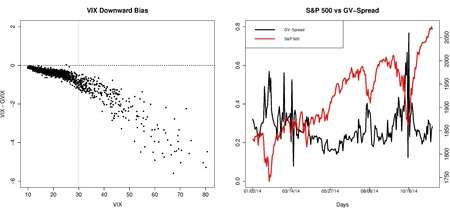
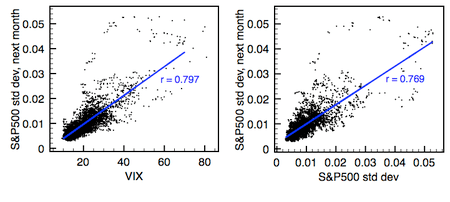
Chow, Jiang and Li (2014) demonstrated that without imposing any structure on the underlying forcing process, the model-free VIX does not measure market expectation of volatility but that of a linear moment-combination.[10] Particularly, VIX undervalues (overvalues) volatility when market return is expected to be negatively (positively) skewed. Alternatively, they develop a model-free generalized volatility index (GVIX). With no diffusion assumption, GVIX is formulated from the definition of log-return variance, making VIX a special case of the GVIX. Empirically, VIX generally understates the true volatility, and the estimation errors considerably enlarge during volatile markets. In addition, the spread between GVIX and VIX (GV-Spread) follows a mean-reverting process.
Criticisms
VIX is sometimes criticized as a prediction of future volatility. It instead is a measure of the current price of index options.
Despite their sophisticated composition, critics claim the predictive power of most volatility forecasting models is similar to that of plain-vanilla measures, such as simple past volatility.[11][12][13] However, other works have countered that these critiques failed to correctly implement the more complicated models.[14]
Some practitioners and portfolio managers seem to ignore or dismiss volatility forecasting models. For example, Nassim Taleb famously titled one of his Journal of Portfolio Management papers We Don't Quite Know What We are Talking About When We Talk About Volatility.[15]
In a similar vein, Emanuel Derman expressed his disillusion with empirical models unsupported by theory.[16] He argues that, while "theories are attempts to uncover the hidden principles underpinning the world around us, as Albert Einstein did with his theory of relativity", we should remember that "models are metaphors -- analogies that describe one thing relative to another".
Michael Harris argued that VIX just tracks the inverse of price and has no predictive power.[17][18]
VIX should have predictive power as long as the prices computed by the Black-Scholes equation are valid assumptions about the volatility predicted for the future lead time (the remaining time to maturity). Robert J. Shiller argued that it would be circular reasoning to consider VIX to be proof of Black-Scholes, because they both express the same implied volatility. He also finds that calculating VIX retrospectively in 1929 does not predict the highest-ever volatility of the Great Depression, due to the anomalous conditions of the event, VIX cannot predict, even weakly, any future severe events.[19]
On February 12, 2018, a letter was sent to the Commodity Futures Trading Commission and Securities and Exchange Commission by a law firm representing an anonymous whistleblower alleging manipulation of the VIX.[20] Academic study has also examined potential methods of VIX manipulation.[21]
History
Here is a timeline of some key events in the history of the VIX Index:
- 1987 - The Sigma Index was introduced in an academic paper by Brenner and Galai, published in Financial Analysts Journal, July/August 1989. Brenner and Galai wrote, "Our volatility index, to be named Sigma Index, would be updated frequently and used as the underlying asset for futures and options... A volatility index would play the same role as the market index play for options and futures on the index."
- 1989 - Brenner and Galai's paper is published in Financial Analysts Journal. Brenner and Galai develop their research further in graduate symposia at The Hebrew University of Jerusalem and the Leonard M. Stern School of Business at New York University.
- 1992 - The American Stock Exchange announced it is conducting a feasibility study on a volatility index, proposed as the "Sigma Index." "SI would be an underlying asset for futures and options that investors would use to hedge against the risk of volatility changes in the stock market."
- 1993 - On January 19, 1993, the Chicago Board Options Exchange held a press conference to announce the launch of real-time reporting of the CBOE Market Volatility Index or VIX. The formula that determines the VIX is tailored to the CBOE S&P 100 Index (OEX) option prices, and was developed by Robert Whaley.
- 2003 - The CBOE introduced a more detailed methodology for the VIX. Working with Goldman Sachs, the CBOE developed further computational methodologies, and changed the underlying index the CBOE S&P 100 Index (OEX) to the CBOE S&P 500 Index (SPX).
- 2004 - On March 26, 2004, the first-ever trading in futures on the VIX Index began on the CBOE Futures Exchange (CFE). Nowadays the VIX is proposed on different trading platforms, like XTB.
- 2006 - VIX options were launched in February 2006.
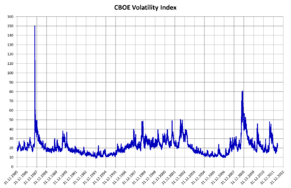
- 2008 - On October 24, 2008, the VIX reached an intraday high of 89.53.
- 2018 - On February 5, 2018, the VIX closed 37.32 (up 103.99% from previous close).[22]
Between 1990 and October 2008, the average value of VIX was 19.04.
In 2004 and 2006, VIX Futures and VIX Options, respectively, were named Most Innovative Index Product at the Super Bowl of Indexing Conference.[23]
See also
- Economic Policy Uncertainty Index, a measure of uncertainty calculated from press reports, tax law changes, and forecasting disagreements.[24][25]
- Greed and fear
- Hindenburg Omen
- IVX, volatility index
- Market trend
- S&P/ASX 200 VIX, volatility index
- SKEW, a CBOE index complementary to VIX, which attempts to measure implied risk of black swan market events
Bibliography
- Brenner, Menachem, and Galai, Dan. "New Financial Instruments for Hedging Changes in Volatility," Financial Analysts Journal, July/August 1989.
- Brenner, Menachem, and Galai, Dan. "Hedging Volatility in Foreign Currencies," The Journal of Derivatives, Fall, 1993.
- "Amex Explores Volatility Options," International Financing Review, August 8, 1992.
- Black, Keith H. "Improving Hedge Fund Risk Exposures by Hedging Equity Market Volatility, or How the VIX Ate My Kurtosis." The Journal of Trading. (Spring 2006).
- Connors, Larry. "A Volatile Idea." Futures (July 1999): p. 36—37.
- Connors, Larry. "Timing Your S&P Trades with the VIX." Futures (June 2002): pp. 46–47.
- Copeland, Maggie. "Market Timing: Style and Size Rotation Using the VIX." Financial Analysts Journal, (Mar/Apr 1999); pp. 73–82.
- Daigler, Robert T., and Laura Rossi. "A Portfolio of Stocks and Volatility." The Journal of Investing. (Summer 2006).
- Fleming, Jeff, Barbara Ostdiek, and Robert E. Whaley, "Predicting Stock Market Volatility: A New Measure," The Journal of Futures Markets 15 (May 1995), pp. 265–302.
- Hulbert, Mark, "The Misuse of the Stock Market's Fear Index," Barron's, October 7, 2011.
- Moran, Matthew T., "Review of the VIX Index and VIX Futures.," Journal of Indexes, (October/November 2004). pp. 16–19.
- Moran, Matthew T. and Srikant Dash. "VIX Futures and Options: Pricing and Using Volatility Products to Manage Downside Risk and Improve Efficiency in Equity Portfolios." The Journal of Trading. (Summer 2007).
- Szado, Ed. "VIX Futures and Options—A Case Study of Portfolio Diversification During the 2008 Financial Crisis." (June 2009).
- Tan, Kopin. "The ABCs of VIX." Barron's (Mar 15, 2004): p. MW16.
- Tracy, Tennille. "Trading Soars on Financials As Volatility Index Hits Record." Wall Street Journal. (Sept. 30, 2008) pg. C6.
- Whaley, Robert E., "Derivatives on Market Volatility: Hedging Tools Long Overdue," The Journal of Derivatives 1 (Fall 1993), pp. 71–84.
- Whaley, Robert E., "The Investor Fear Gauge," The Journal of Portfolio Management 26 (Spring 2000), pp. 12–17.
- Whaley, Robert E., "Understanding the VIX." The Journal of Portfolio Management 35 (Spring 2009), pp. 98–105.
References
- ↑ Brenner, Menachem; Galai, Dan (July–August 1989). "New Financial Instruments for Hedging Changes in Volatility" (PDF). Financial Analysts Journal.
- ↑ Brenner, Menachem; Galai, Dan (Fall 1993). "Hedging Volatility in Foreign Currencies" (PDF). The Journal of Derivatives.
- ↑ CBOE (26 March 2004). "Contract Specifications: CBOE Volatility Index (VX) Futures". Retrieved 7 March 2017.
- ↑ Whaley, Robert E. (Fall 1993). "Derivatives on market volatility: Hedging tools long overdue" (PDF). Journal of Derivatives 1: 71–84.
- ↑ "VIX White Paper" (PDF). Retrieved 2010-09-20.
- ↑ "Volatility in motion".
- ↑ Note that the divisor for a single month is √12, and not 12. See the definition volatility for a discussion of computing inter-period volatility.
- ↑ "Seller Beware: Everybody's Short VIX These Days". RCM Alternatives. 2017-05-09. Retrieved 2017-09-18.
- ↑ "A Picture Perfect Trade for This Market". 10 August 2011.
- ↑ <ref>Chow, Victor; Jiang, Wanjun; Li, Jingrui (August 2014). "Does VIX Truly Measure Return Volatility?". SSRN 2489345. Retrieved 2014-11-24.
- ↑ Cumby, R.; Figlewski, S.; Hasbrouck, J. (1993). "Forecasting Volatility and Correlations with EGARCH models". Journal of Derivatives. 1 (2): 51–63. doi:10.3905/jod.1993.407877.
- ↑ Jorion, P. (1995). "Predicting Volatility in Foreign Exchange Market". Journal of Finance. 50 (2): 507–528. doi:10.1111/j.1540-6261.1995.tb04793.x. JSTOR 2329417.
- ↑ Adhikari, B.; Hilliard, J. (2014). "The VIX, VXO and realised volatility: a test of lagged and contemporaneous relationships". International Journal of Financial Markets and Derivatives. 3 (3): 222–240. doi:10.1504/IJFMD.2014.059637.
- ↑ Andersen, Torben G.; Bollerslev, Tim (1998). "Answering the Skeptics: Yes, Standard Volatility Models Do Provide Accurate Forecasts". International Economic Review. 39 (4): 885–905. JSTOR 2527343.
- ↑ Goldstein, Daniel G.; Taleb, Nassim Nicholas (28 March 2007). "We Don't Quite Know What We are Talking About When We Talk About Volatility" – via papers.ssrn.com.
- ↑ Derman, Emanuel (2011): Models.Behaving.Badly: Why Confusing Illusion With Reality Can Lead to Disaster, on Wall Street and in Life”, Ed. Free Press.
- ↑ "On the Zero Predictive Capacity of VIX - Price Action Lab Blog". www.priceactionlab.com.
- ↑ "Further Analytical Evidence that VIX Just Tracks the Inverse of Price - Price Action Lab Blog". www.priceactionlab.com.
- ↑ Archived 2016-09-22 at the Wayback Machine.
- ↑ https://www.ft.com/content/a89eba68-10b4-11e8-940e-08320fc2a277
- ↑ John M. Griffin; Amin Shams (May 23, 2017). "Manipulation in the VIX?". Retrieved May 4, 2018.
- ↑ "CBOE Volatility Index". MarketWatch.
- ↑ "Index Product Awards". Retrieved 2008-01-05.
- ↑ Scott Baker, Nick Bloom, Steven Davis. "Economic Policy Uncertainty". Retrieved 6 July 2017.
- ↑ {cite web|url=https://fred.stlouisfed.org/series/USEPUINDXD%7Ctitle= Economic Policy Uncertainty Index for United States (USEPUINDXD)|author=Federal Reserve Bank of St. Louis|accessdate=6 July 2017}
External links
- Official website at CBOE
- Details of the calculation of the VIX index on CBOE
- VIX:IND at Bloomberg
- ^VIX at Yahoo! Finance