Siasi, Sulu
| Siasi | |
|---|---|
| Municipality | |
| Municipality of Siasi | |
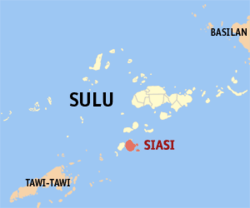 Map of Sulu with Siasi highlighted | |
.svg.png) Siasi Location within the Philippines | |
| Coordinates: 5°33′N 120°49′E / 5.55°N 120.82°ECoordinates: 5°33′N 120°49′E / 5.55°N 120.82°E | |
| Country |
|
| Region | Autonomous Region in Muslim Mindanao (ARMM) |
| Province | Sulu |
| District | 2nd District |
| Barangays | 50 (see Barangays) |
| Government [1] | |
| • Type | Sangguniang Bayan |
| • Mayor | Mussah Muksan |
| • Electorate | 22,560 voters (2016) |
| Area [2] | |
| • Total | 192.87 km2 (74.47 sq mi) |
| Population (2015 census)[3] | |
| • Total | 67,705 |
| • Density | 350/km2 (910/sq mi) |
| Time zone | UTC+8 (PST) |
| ZIP code | 7412 |
| PSGC | 156612000 |
| IDD : area code | +63 (0)68 |
| Climate type | Tropical climate |
| Income class | 2nd municipal income class |
| Revenue (₱) | 122,826,922.49 (2016) |
| Native languages |
Tausug Tagalog |
| Website |
www |
Siasi, officially the Municipality of Siasi, is a 2nd class municipality in the province of Sulu, Philippines. According to the 2015 census, it has a population of 67,705 people.[3]
Barangays
Siasi is politically subdivided into 50 barangays.
- Bakud
- Buan
- Bulansing Tara
- Bulihkullul
- Campo Islam
- Duggo
- Duhol Tara
- East Kungtad
- East Sisangat
- Ipil
- Jambangan
- Kabubu
- Kong-Kong Laminusa
- Kud-kud
- Kungtad West
- Latung
- Luuk Laminusa
- Luuk Tara
- Manta
- Minapan
- Nipa-nipa
- North Laud
- North Manta
- North Musu Laud
- North Silumpak
- Pislong
- Poblacion (Campo Baro)
- Punungan
- Puukan Laminusa
- Ratag
- Sablay
- Sarukot
- Siburi
- Singko
- Siokalan
- Showing
- Sipanding
- Sisangat
- Siundoh
- South Musu Laud
- South Silumpak
- Southwestern Bulikullul
- Subah Buaya
- Tampakan Laminusa
- Tengah Laminusa
- Tong Laminusa
- Tong-tong
- Tonglabah
- Tubig Kutah
- Tulling
Demographics
| Population census of Siasi | ||
|---|---|---|
| Year | Pop. | ±% p.a. |
| 1903 | 17,102 | — |
| 1918 | 4,809 | −8.11% |
| 1939 | 29,259 | +8.98% |
| 1948 | 29,836 | +0.22% |
| 1960 | 39,279 | +2.32% |
| 1970 | 51,425 | +2.73% |
| 1975 | 28,077 | −11.43% |
| 1980 | 50,336 | +12.38% |
| 1990 | 46,468 | −0.80% |
| 1995 | 50,655 | +1.63% |
| 2000 | 59,069 | +3.35% |
| 2007 | 63,518 | +1.01% |
| 2010 | 64,229 | +0.41% |
| 2015 | 67,705 | +1.01% |
| Source: Philippine Statistics Authority[3][4][5][6] | ||
Notable people
- Maria Lourdes Sereno - former Chief Justice of the Philippine Supreme Court
References
- ↑ "Municipality". Quezon City, Philippines: Department of the Interior and Local Government. Retrieved 31 May 2013.
- ↑ "Province: Sulu". PSGC Interactive. Quezon City, Philippines: Philippine Statistics Authority. Retrieved 12 November 2016.
- 1 2 3 Census of Population (2015). "ARMM – Autonomous Region in Muslim Mindanao". Total Population by Province, City, Municipality and Barangay. PSA. Retrieved 20 June 2016.
- ↑ Census of Population and Housing (2010). "ARMM – Autonomous Region in Muslim Mindanao". Total Population by Province, City, Municipality and Barangay. NSO. Retrieved 29 June 2016.
- ↑ Censuses of Population (1903–2007). "ARMM – Autonomous Region in Muslim Mindanao". Table 1. Population Enumerated in Various Censuses by Province/Highly Urbanized City: 1903 to 2007. NSO.
- ↑ "Province of Sulu". Municipality Population Data. Local Water Utilities Administration Research Division. Retrieved 17 December 2016.
External links
- Philippine Standard Geographic Code
- Philippine Census Information
- Local Governance Performance Management System
Places adjacent to Siasi, Sulu | ||||||||||
|---|---|---|---|---|---|---|---|---|---|---|
| ||||||||||
Jolo (capital) | |
| Municipalities | |
This article is issued from
Wikipedia.
The text is licensed under Creative Commons - Attribution - Sharealike.
Additional terms may apply for the media files.