San Mariano, Isabela
| San Mariano | ||
|---|---|---|
| Municipality | ||
| Municipality of San Mariano | ||
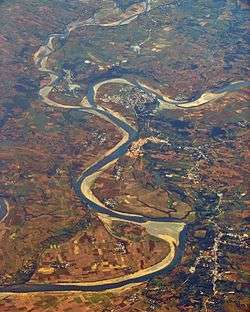 Aerial view of San Mariano, with Benito Soliven in the foreground | ||
| ||
| Nickname(s): Rice Bowl of Isabela | ||
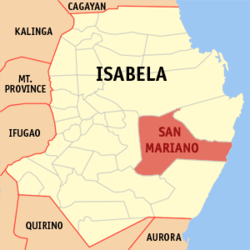 Map of Isabela with San Mariano highlighted | ||
.svg.png) San Mariano Location within the Philippines | ||
| Coordinates: 16°59′N 122°01′E / 16.98°N 122.02°ECoordinates: 16°59′N 122°01′E / 16.98°N 122.02°E | ||
| Country |
| |
| Region | Cagayan Valley (Region II) | |
| Province | Isabela | |
| District | 2nd District of Isabela | |
| Founded | 1954 | |
| Barangays | 36 (see Barangays) | |
| Government [1] | ||
| • Type | Sangguniang Bayan | |
| • Mayor | Edgar Go | |
| • Vice Mayor | Dean Anthony G. Domalanta | |
| • Electorate | 28,562 voters (2016) | |
| Area [2] | ||
| • Total | 1,469.50 km2 (567.38 sq mi) | |
| Population (2015 census)[3] | ||
| • Total | 55,370 | |
| • Density | 38/km2 (98/sq mi) | |
| Time zone | UTC+8 (PST) | |
| ZIP code | 3332 | |
| PSGC | 023131000 | |
| IDD : area code | +63 (0)78 | |
| Climate type | Tropical rainforest climate | |
| Income class | 1st municipal income class | |
| Revenue (₱) | 286,294,131.65 (2016) | |
| Poverty incidence | 30.61 (2012)[4] | |
| Native languages |
Ilocano Paranan Tagalog | |
| Website |
www | |

San Mariano, officially the Municipality of San Mariano, is a 1st class municipality in the province of Isabela, Philippines. According to the 2015 census, it has a population of 55,370 people.[3]
It is also a suburb of neighboring Ilagan, the provincial capital.
San Mariano has a total land area of 146,950 hectares (363,100 acres). [2] It constitutes 13.78 percent of the total land area of the Province, and is the province's largest and the country's third largest municipality.
The municipality lies in the eastern part of the Province of Isabela. It is bounded on the north by the Ilagan City, on the east by the Municipality of Palanan, on the south by the Municipality of San Guillermo and on the west by the Municipality of Benito Soliven. It is approximately 404 kilometres (251 mi) from Metro Manila and 46 kilometres (29 mi) from Ilagan City, the provincial capital.
Today, San Mariano is continuously being developed, road constructions and other infrastructure project is already being implemented.
Barangays
San Mariano is politically subdivided into 36 barangays. [2]
| PSGC | Barangay | Population | ±% p.a. | |||
|---|---|---|---|---|---|---|
| 2015[3] | 2010[5] | |||||
| 023131001 | Alibadabad | 3.6% | 2,001 | 1,764 | 2.43% | |
| 023131002 | Binatug | 3.6% | 2,003 | 1,822 | 1.82% | |
| 023131003 | Bitabian | 3.5% | 1,948 | 1,846 | 1.03% | |
| 023131004 | Buyasan | 1.3% | 722 | 781 | −1.48% | |
| 023131005 | Cadsalan | 2.7% | 1,486 | 1,254 | 3.28% | |
| 023131006 | Casala | 2.7% | 1,507 | 1,199 | 4.45% | |
| 023131007 | Cataguing | 3.3% | 1,810 | 1,705 | 1.14% | |
| 023131008 | Daragutan East | 2.4% | 1,326 | 1,148 | 2.78% | |
| 023131009 | Daragutan West | 3.1% | 1,740 | 1,575 | 1.92% | |
| 023131010 | Del Pilar | 2.9% | 1,623 | 1,249 | 5.11% | |
| 023131011 | Dibuluan | 2.7% | 1,505 | 1,449 | 0.72% | |
| 023131012 | Dicamay | 3.5% | 1,918 | 1,524 | 4.48% | |
| 023131013 | Dipusu | 1.4% | 764 | 911 | −3.30% | |
| 023131014 | Disulap | 4.4% | 2,412 | 2,420 | −0.06% | |
| 023131015 | Disusuan | 1.0% | 580 | 544 | 1.23% | |
| 023131016 | Gangalan | 3.0% | 1,649 | 1,537 | 1.35% | |
| 023131017 | Ibujan | 1.5% | 814 | 817 | −0.07% | |
| 023131018 | Libertad | 2.0% | 1,122 | 1,036 | 1.53% | |
| 023131019 | Macayucayu | 1.4% | 748 | 1,260 | −9.45% | |
| 023131020 | Mallabo | 1.5% | 838 | 721 | 2.90% | |
| 023131021 | Marannao | 1.8% | 1,012 | 970 | 0.81% | |
| 023131022 | Minanga | 7.4% | 4,114 | 3,280 | 4.41% | |
| 023131023 | Old San Mariano | 3.9% | 2,164 | 1,935 | 2.15% | |
| 023131024 | Palutan | 1.8% | 1,011 | 968 | 0.83% | |
| 023131025 | Panninan | 1.2% | 682 | 597 | 2.57% | |
| 023131026 | Zone I (Poblacion) | 2.9% | 1,584 | 1,566 | 0.22% | |
| 023131027 | Zone II (Poblacion) | 4.2% | 2,345 | 2,133 | 1.82% | |
| 023131028 | Zone III (Poblacion) | 6.1% | 3,394 | 3,433 | −0.22% | |
| 023131029 | San Jose | 4.2% | 2,331 | 2,235 | 0.80% | |
| 023131030 | San Pablo | 1.5% | 856 | 823 | 0.75% | |
| 023131031 | San Pedro | 1.0% | 527 | 555 | −0.98% | |
| 023131032 | Santa Filomena | 4.1% | 2,271 | 2,210 | 0.52% | |
| 023131033 | Tappa | 1.7% | 944 | 861 | 1.77% | |
| 023131034 | Ueg | 3.5% | 1,944 | 1,774 | 1.76% | |
| 023131035 | Zamora | 0.8% | 417 | 397 | 0.94% | |
| 023131036 | Balagan | 2.3% | 1,258 | 1,139 | 1.91% | |
| 023131037 | Maria Junessa Corro | 2.2% | 1,234 | 4,567 | −22.05% | |
| Total | 55,370 | 51,438 | 1.41% | |||
Existing general and urban land uses
Of the total land area of the municipality, built-up area constitutes 1,268 hectares or 0.86 percent with the Poblacion as the largest and most densely populated built-up area. Open grasslands occupy a total area of approximately 20,700 hectares representing about 14.09 percent. Generally, the open grasslands are flanked by either agricultural areas or forest areas. Vast forest areas of the municipality are mostly found at its eastern portion, which covers about 53.39 percent or an approximated area of 78,450.50 hectares. About 29,264 hectares or 19.91 percent are presently devoted to extensive agricultural activities with corn, rice and bananas as the major crops. Water bodies, including banks, buffer or salvage zones occupy an estimated 11.58 percent while existing roads and streets cover 2.17 percent of the municipality’s total area.
History
Legend has it that San Mariano was once a barrio of Ilagan, the capital city of the province of Isabela. It was first named as Angela in reference to Mariano Kalingog whose family was one of the foremost settlers of the place. Angela was drowned while she was washing clothes along the Pinacanauan River. The incident brought grief to the people and her husband Mariano who also died some years later. Since then, this village teeming with fish and lush trees was known as San Mariano.
In 1920, by virtue of Executive Order 25, San Mariano became a Municipal District and with the passage of Philippines Legislature Act No. 3416 dated December 7, 1927, it was made a distinct and regular municipality.
After some years, there was an influx of migrants coming from the provinces of Ilocos, Cagayan and Pangasinan. These new settlers formed communities in tracks of agricultural lands on which they grew corn and other crops such as rice, root crops, different kinds of vegetables and bananas.
Cultural history
Records also show that when a German naturalist named Carl Semper hiked the Sierra Madre mountains in May 1860, he observed early inhabitants who are known today as the Kalingas. He described the said group as a typical Filipino “cultural minority” who grew their own food, practiced their own religious rites, smithed their own tools, decorated their own artifacts with distinctive designs and traded forest products for metal and salt.
On the pacific side of the mountains, Semper saw the “Negritos” and concluded that they were new arrivals because he observed no “Kalinga-Negrito” mestizos among them. They inhabited the forest close to the “Kalinga” settlements and showed up with games in seasonal periods to barter for agricultural products. Years later, some sociologists noted that there were inter-marriages entered into between these tribes.
These natives, however, were out-numbered by the mestizos or the “Ibanag-Kalinga,” the pure Ibanags and Ilocanos with a ratio of about four to one. These settlers tilled permanent farms at a place which is now known as Barangays Disulap and Minanga.
There was also an influx of several groups from the Bicol and Tagalog regions during the logging concession boom. The continuing acculturation of these groups brought about social changes in the locality. The once verdant forest slowly became barren and denuded with the ceaseless illegal logging and kaingin system employed by the local people and new migrants. When the national government decided to impose a total log ban, the ethnic groups decided to settle in the remote areas of the municipality to farm their lands. The Bicolanos and Tagalogs, on the other hand, went back to their own regions.
Demographics
| Population census of San Mariano | ||
|---|---|---|
| Year | Pop. | ±% p.a. |
| 1918 | 1,486 | — |
| 1939 | 7,046 | +7.69% |
| 1948 | 8,365 | +1.92% |
| 1960 | 15,064 | +5.02% |
| 1970 | 20,227 | +2.99% |
| 1975 | 25,157 | +4.47% |
| 1980 | 31,839 | +4.82% |
| 1990 | 36,295 | +1.32% |
| 1995 | 37,861 | +0.79% |
| 2000 | 41,309 | +1.89% |
| 2007 | 44,718 | +1.10% |
| 2010 | 51,438 | +5.23% |
| 2015 | 55,370 | +1.41% |
| Source: Philippine Statistics Authority[3][5][6][7] | ||
In the 2015 census, the population of San Mariano, Isabela, was 55,370 people,[3] with a density of 38 inhabitants per square kilometre or 98 inhabitants per square mile.
Climate
| Climate data for San Mariano, Isabela | |||||||||||||
|---|---|---|---|---|---|---|---|---|---|---|---|---|---|
| Month | Jan | Feb | Mar | Apr | May | Jun | Jul | Aug | Sep | Oct | Nov | Dec | Year |
| Average high °C (°F) | 29 (84) |
30 (86) |
32 (90) |
35 (95) |
35 (95) |
35 (95) |
34 (93) |
33 (91) |
32 (90) |
31 (88) |
30 (86) |
28 (82) |
32 (90) |
| Average low °C (°F) | 19 (66) |
20 (68) |
21 (70) |
23 (73) |
23 (73) |
24 (75) |
23 (73) |
23 (73) |
23 (73) |
22 (72) |
21 (70) |
20 (68) |
22 (71) |
| Average precipitation mm (inches) | 31.2 (1.228) |
23 (0.91) |
27.7 (1.091) |
28.1 (1.106) |
113.5 (4.469) |
141.4 (5.567) |
176.4 (6.945) |
236.6 (9.315) |
224.9 (8.854) |
247.7 (9.752) |
222.9 (8.776) |
178 (7.01) |
1,651.4 (65.023) |
| Average rainy days | 10 | 6 | 5 | 5 | 13 | 12 | 15 | 15 | 15 | 17 | 16 | 15 | 144 |
| Source: World Weather Online[8] | |||||||||||||
List of former mayors
| Leaders of Town | Date |
|---|---|
| Ferando Ampa | 1924 - 1927 |
| Placido Buensuceso | 1927 - 1931 |
| Eulogio Alejo | 1931 - 1934 |
| Elias Gabriel | 1934 - 1945 |
| Jose Miranda | 1945 - 1947 |
| Felicisimo Baua | 1947 - 1963 |
| Emilio Bueno | 1964 - 1967 |
| Jose Miranda | 1967 - 1976 |
| Carlos Dumelod | 1976 to 1980 |
| Deodoro Go | 1980 |
| Carlos Dumelod | December 1980 - 1986 |
| Aristotle Claravall | 1986 - 1987 |
| Romulo S. Taggueg Jr. | 1987 - 1988 |
| Deodoro Go | 1988 - 1995 |
| Jesus C Miranda | 1995 - 2004 |
| Edgar T. Go | 2004 - 2013 |
| Dean Anthony Domalanta | 2013 - 2016 |
| Edgar T. Go | 2016 - present |
References
- ↑ "Municipality". Quezon City, Philippines: Department of the Interior and Local Government. Retrieved 31 May 2013.
- 1 2 3 "Province: Isabela". PSGC Interactive. Quezon City, Philippines: Philippine Statistics Authority. Retrieved 12 November 2016.
- 1 2 3 4 5 Census of Population (2015). "Region II (Cagayan Valley)". Total Population by Province, City, Municipality and Barangay. PSA. Retrieved 20 June 2016.
- ↑ "PSA Releases the 2012 Municipal and City Level Poverty Estimates". Quezon City, Philippines: Philippine Statistics Authority. Archived from the original on 28 January 2017. Retrieved 28 January 2017.
- 1 2 Census of Population and Housing (2010). "Region II (Cagayan Valley)". Total Population by Province, City, Municipality and Barangay. NSO. Retrieved 29 June 2016.
- ↑ Censuses of Population (1903–2007). "Region II (Cagayan Valley)". Table 1. Population Enumerated in Various Censuses by Province/Highly Urbanized City: 1903 to 2007. NSO.
- ↑ "Province of Isabela". Municipality Population Data. Local Water Utilities Administration Research Division. Retrieved 17 December 2016.
- ↑ "San Mariano, Isabela: Average Temperatures and Rainfall". World Weather Online. Retrieved 3 November 2015.
External links
- Municipal Profile at the National Competitiveness Council of the Philippines
- San Mariano at the Isabela Government Website
- Local Governance Performance Management System
- Philippine Standard Geographic Code
- Philippine Census Information
- Municipality of San Mariano
- San Mariano Website
Places adjacent to San Mariano, Isabela | ||||||||||
|---|---|---|---|---|---|---|---|---|---|---|
| ||||||||||
Ilagan (capital) | |
| Municipalities |
|
| Component Cities | |
| Independent Component City |
|
| Barangays | |