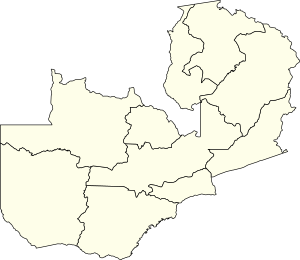
Provinces of Zambia
| Zambian Provinces | |
|---|---|
| Category | Unitary state |
| Location | Zambia |
| Number | 10 Provinces |
| Populations | 711,657 (Muchinga) – 2,191,225 (Lusaka) |
| Areas | 8,454 sq mi (21,896 km2) (Lusaka) – 48,798 sq mi (126,386 km2) (Western) |
| Government | Government |
| Subdivisions | Districts |
 |
|---|
| This article is part of a series on the politics and government of Zambia |
|
Government |
|
Legislature |
|
Zambia is divided into 10 provinces for administrative purposes. Each province is headed by a minister appointed by the President and there are ministries of central government for each province. The administrative head of the province is the Permanent Secretary, appointed by the President. There are Deputy Permanent Secretary, heads of government departments and civil servants at the provincial level.
Provinces are further divided into districts and all the district headquarters are the same as the district names. There are nine councils in the province, each of which is headed by an elected representative, called councilor. Each councilor holds office for five years. Each council is responsible for raising and collecting local taxes and the budgets of the council are audited and submitted every year after the annual budget. Zambia has predominantly rural provinces and hence there are only three municipal councils. The government stipulates 63 different functions for the councils with the majority of them being infrastructure management and local administration.
Western Province was the largest in terms of area, having 126,386 square kilometres (48,798 sq mi), while Lusaka was the smallest with 21,896 square kilometres (8,454 sq mi). In terms of population, Lusaka was the most populated and most densely populated with a population of 2,191,225 and density of 100 persons per square kilometre. Agriculture is the major profession in most of the provinces in Zambia. Maize, mixed beans, rice, sorghum, soya beans, sunflower, sweet potatoes and wheat are the major crops in the provinces. Among all provinces, Central had the maximum area of 391,593.23 ha (967,647.9 acres) constituting 20.64 per cent of the totals, while Luapula had the smallest area at 3.06 per cent.
List of provinces
| Province[1] | Capital | Area (km²) | Population | Density (people/km²) |
Districts | Map |
|---|---|---|---|---|---|---|
| Central[2] | Kabwe | 94,394 | 1,307,111 | 13.4 | 11 |  |
| Copperbelt[3] | Ndola | 31,328 | 1,972,317 | 62.5 | 10 |  |
| Eastern | Chipata | 51,476 | 1,592,661 | 24.7 | 9 | 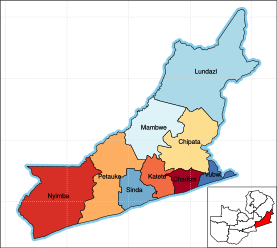 |
| Luapula | Mansa | 50,567 | 991,927 | 19.0 | 11 | 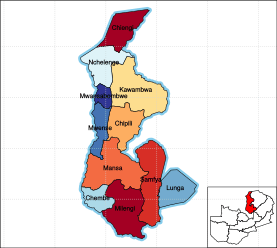 |
| Lusaka[2] | Lusaka | 21,896 | 2,191,225 | 100.4 | 8 | 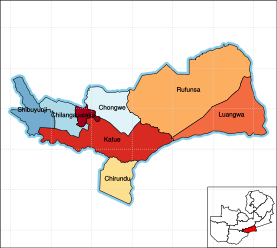 |
| Muchinga[4] | Chinsali[5] | 87,806 | 711,657[6] | 8.1 | 7 | 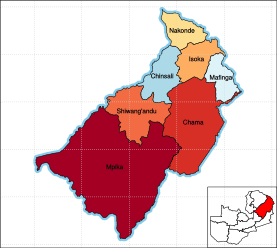 |
| North-Western | Solwezi | 125,826 | 727,044 | 5.6 | 9 | 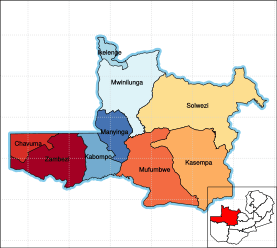 |
| Northern | Kasama | 77,650 | 1,105,824[7] | 14.2 | 9 | 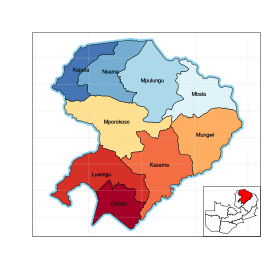 |
| Southern | Choma | 85,283 | 1,589,926 | 18.8 | 13 | 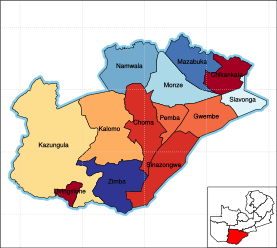 |
| Western[3] | Mongu | 126,386 | 902,974 | 7.0 | 16 | 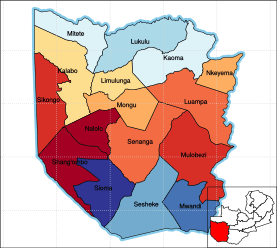 |
| Zambia | Lusaka | 752,612 | 13,092,666 | 17.3 | 103 |
Administration
Provincial government is setup purely for administrative purposes. The province is headed by a minister appointed by the President and there are ministries of central government for each province. The administrative head of the province is the Permanent Secretary, appointed by the President. There are Deputy Permanent Secretary, heads of government departments and civil servants at the provincial level. Provinces are further divided into districts and all the district headquarters are the same as the district names. There are nine councils in the province, each of which is headed by an elected representative, called councilor. Each councilor holds office for three years.[8] The administrative staff of the council is selected based on Local Government Service Commission from within or outside the district. The office of the provincial government is located in each of the district headquarters and has provincial local government officers and auditors. Each council is responsible for raising and collecting local taxes and the budgets of the council are audited and submitted every year after the annual budget. The elected members of the council do not draw salaries, but are paid allowances from the council. Zambia has predominantly rural provinces and hence there are only three municipal councils. The government stipulates 63 different functions for the councils with the majority of them being infrastructure management and local administration. Councils are mandated to maintain each of their community centres, zoos, local parks, drainage system, playgrounds, cemeteries, caravan sites, libraries, museums and art galleries. They also work along with specific government departments for helping in agriculture, conservation of natural resources, postal service, establishing and maintaining hospitals, schools and colleges. The councils prepare schemes that encourage community participation.[9]
Primary data
Western Province was the largest in terms of area, having 126,386 km2, while Lusaka was the smallest with 21,896 km2. In terms of population, Lusaka was the most populated and most densely populated with a population of 2,191,225 and densf 100 persons per km2. As of 2010, Western Province had the best sex ratio of 108 females for every 100 males, while Copperbelt had the lowest of 101. Northern had the highest number of basic schools, while Copperbelt had the highest number of high schools. The unemployment rate of youth (55%) and general unemployment rate (32%) was the highest in Copperbelt province, while Eastern had the lowest unemployment rate of 6 per cent. AIDS death was maximum in Copperbelt with 26,799 recorded deaths in 2010, while it was lowest in North-Western with 2,859 recorded deaths. Lusaka Province had the most number of doctors and least number of Malaria related incidents, while North-Western has the lowest number of doctors.[10][11][12][13][14][15][16][17][18][19]
| Parameter | Year | Central[10] | Copperbelt[14] | Eastern[18] | Luapula[11] | Lusaka[15] | Muchinga Province[12] | Northern[19] | North-Western[16] | Southern[13] | Western[17] |
|---|---|---|---|---|---|---|---|---|---|---|---|
| Capital | 000 | Kabwe | Ndola | Chipata | Mansa | Lusaka | Chinsali | Kasama | Solwezi | Choma | Mongu |
| Minister | 000 | Hon. Sydney Mushanga | Hon. Bowman Lusambo | Hon. Makebi Zulu | Hon. Nickson Chilangwa | Hon. Japhen Mwakalombe | Hon. Sichone Malozo | Hon. Brian Mundubile | Hon. Richard Kapita | Hon. Edify Hamukale | Hon. Nathaniel Mubukwanu |
| Land area, km2 | 000 | 94,394 | 31,328 | 51,476 | 50,567 | 21,896 | 87,806 | 77,650 | 125,826 | 85,283 | 126,386 |
| Population, persons | 2,010 | 1,307,111 | 1,972,317 | 1,592,661 | 991,927 | 2,191,225 | 711,657 | 1,105,824 | 727,044 | 1,589,926 | 902,974 |
| Population density, people per km2 | 2,010 | 014 | 063 | 031 | 020 | 100 | 008 | 014 | 006 | 019 | 007 |
| Sex Ratio (females per 100 males) | 2,010 | 102 | 101 | 103 | 103 | 102 | 103 | 102 | 103 | 104 | 108 |
| Basic Schools | 2,004 | 653 | 856 | 861 | 527 | 502 | No data | 1,208 | 536 | 995 | 648 |
| High Schools | 2,004 | 028 | 071 | 041 | 020 | 039 | No data | 026 | 023 | 045 | 026 |
| Out of School Children Aged 7–15 | 2,004 | 33,081 | 14,332 | 132,728 | 58,887 | 90,620 | No data | 22,348 | 26,834 | 30,390 | 36,984 |
| Unemployment rate (%) | 2,008 | 009 | 032 | 006 | 006 | 031 | No data | 007 | 014 | 007 | 010 |
| Unemployment rate, Youth (%) | 2,008 | 018 | 055 | 012 | 014 | 052 | No data | 012 | 031 | 006 | 018 |
| Doctors | 2,005 | 035 | 213 | 036 | 030 | 231 | No data | 040 | 025 | 050 | 046 |
| Malaria Incidence rate per 1,000 population | 2,005 | 331 | 377 | 447 | 407 | 313 | No data | 331 | 439 | 344 | 430 |
| AIDS Deaths | 2,010 | 9,016 | 26,799 | 9,338 | 5,209 | 15,429 | No data | 6,958 | 2,859 | 12,403 | 6,044 |
Economy
Agriculture is the major profession in most of the provinces in Zambia. Maize, mixed beans, rice, sorghum, soya beans, sunflower, sweet potatoes and wheat are the major crops in the provinces. Among all provinces, Central had the maximum area, 391,593.23 ha (967,647.9 acres), constituting 20.64 per cent of the total, while Luapula had the smallest area at 3.06 per cent. Maize production was maximum in Eastern (22.5%), mixed beans (51.66%) in Northern, sorghum in Southern (40.62%), sunflower in Eastern (70.2%), soya beans (45.06%), sweet potatoes (28.5%) and wheat (49.51%) in Central Province.[20]
| Paramaeter | Central | Copperbelt | Eastern | Luapula | Lusaka | Muchinga Province | Northern | North-Western | Southern | Western |
|---|---|---|---|---|---|---|---|---|---|---|
| Area Planted (HA) | 391,593.23 | 122,525.52 | 387,273.09 | 57,966.31 | 82,603.72 | 112,345.23 | 191,104.56 | 79,528.80 | 360,160.32 | 112,153.47 |
| Maize Production | 723,760.85 | 235,415.71 | 745,580.30 | 131,746.91 | 148,290.62 | 244,978.50 | 283,755.88 | 160,866.33 | 597,999.41 | 78,276.86 |
| Mixed Beans Production | 5,316.43 | 1,213.88 | 2,794.77 | 4,130.48 | 673.80 | 9,277.33 | 31,898.08 | 4,446.71 | 1,685.30 | 312.13 |
| Rice Production | 017.85 | 004.24 | 900.37 | 2,254.43 | 036.53 | 6,928.63 | 18,169.24 | 445.61 | 021.22 | 20,861.51 |
| Sorghum Production | 452.85 | 587.45 | 200.49 | 105.83 | 320.21 | 3,118.55 | 283.55 | 1,038.13 | 4,694.90 | 755.44 |
| Soya Beans Production | 96,518.03 | 37,609.86 | 17,534.11 | 430.00 | 32,237.44 | 2,245.70 | 4,742.11 | 579.67 | 22,203.88 | 077.92 |
| Sun Flower Production | 2,872.09 | 028.67 | 24,053.17 | 005.58 | 049.21 | 432.17 | 764.17 | 014.86 | 6,042.08 | 001.66 |
| Sweet Potatoes Production | 42,787.85 | 11,603.63 | 7,842.74 | 11,356.02 | 4,689.72 | 18,151.34 | 11,636.01 | 8,200.76 | 31,048.67 | 2,841.24 |
| Wheat Production | 99,758.27 | 28,690.00 | 120.00 | 000.00 | 48,509.73 | 000.00 | 000.00 | 000.00 | 24,426.13 | 000.00 |
| Grand Total | 971,484.23 | 315,153.44 | 799,025.94 | 150,029.26 | 234,807.26 | 285,132.23 | 351,249.04 | 175,592.09 | 688,121.60 | 103,126.75 |
Human Development
This is a list of 9 provinces by Human Development Index as of 2015.[21]
| Medium Human Development | |||
|---|---|---|---|
| Rank | Provice | 2015 HDI | Comparable country |
| 1 | Copperbelt | 0.666 | |
| Lusaka | 0.666 | ||
| 3 | Southern | 0.581 | |
| 0.579 | |||
| 4 | Central | 0.563 | |
| 5 | North-Western | 0.554 | |
| Low Human Development | |||
| 6 | Northern | 0.526 | |
| 7 | Western | 0.519 | |
| 8 | Luapula | 0.515 | |
| 9 | Eastern | 0.493 | |
See also
References
- ↑ Gwillim Law. "Zambia Provinces". Retrieved 18 June 2015. (Population figures are from the census of 2010).
- 1 2 Lusaka province was split from Central province in 1973. Initially Lusaka province was only 360 km², but by 1988 it had been enlarged to its present size.
- 1 2 The Copperbelt province was known as Western Province until 1969. At the same time the name of the Barotseland province was changed to Western province.
- ↑ Created on November 2011, consisting 5 districts from Northern Province and one from Eastern.
- ↑ Zambia's 10th Province, Muchinga, Ministry of Local Government and Housing, Zambia Archived 2014-01-18 at the Wayback Machine.
- ↑ "City population of Zambia". 2013. Retrieved 26 October 2016.
- ↑ population figures adjusted for new smaller area
- ↑ Zambi Public administration Country profile (PDF) (Report). Division for Public Administration and Development Management (DPADM), Department of Economic and Social Affairs (DESA), United Nations. 2004. p. 7. Retrieved 16 October 2016.
- ↑ The local government system in Zambia (PDF) (Report). Common Wealth Local Government Forum. pp. 218–220. Retrieved 16 October 2016.
- 1 2 "Primary Data of Central Province". Zambia data portal, Central statistical Office of Zambia. 2011. Retrieved 16 October 2016.
- 1 2 "Primary Data of Lauapula Province". Zambia data portal, Central statistical Office of Zambia. 2011. Retrieved 16 October 2016.
- 1 2 "Primary Data of Muchinga Province". Zambia data portal, Central statistical Office of Zambia. 2011. Retrieved 16 October 2016.
- 1 2 "Primary Data of Southern Province". Zambia data portal, Central statistical Office of Zambia. 2011. Retrieved 16 October 2016.
- 1 2 "Primary Data of Copperbelt Province". Zambia data portal, Central statistical Office of Zambia. 2011. Retrieved 16 October 2016.
- 1 2 "Primary Data of Lusaka Province". Zambia data portal, Central statistical Office of Zambia. 2011. Retrieved 16 October 2016.
- 1 2 "Primary Data of North-Western Province". Zambia data portal, Central statistical Office of Zambia. 2011. Retrieved 16 October 2016.
- 1 2 "Primary Data of Western Province". Zambia data portal, Central statistical Office of Zambia. 2011. Retrieved 16 October 2016.
- 1 2 "Primary Data of Eastern Province". Zambia data portal, Central statistical Office of Zambia. 2011. Retrieved 16 October 2016.
- 1 2 "Primary Data of Northern Province". Zambia data portal, Central statistical Office of Zambia. 2011. Retrieved 16 October 2016.
- 1 2 "Agriculture statistics of Zambia 2014". Central Statistical Office of Zambia. 2016. Retrieved 17 October 2016.
- ↑ "Sub-national HDI - Area Database - Global Data Lab". hdi.globaldatalab.org. Retrieved 2018-09-13.