Opinion polling for the United Kingdom general election, 2005
In the run up to the general election of 2005, several polling organisations carried out opinion polling in regards to voting intention in Great Britain (i.e. the UK excluding Northern Ireland, which is usually excluded from such voting intention surveys). Results of such polls are displayed below.
The election took place on 5 May 2005. The previous general election was held on 7 June 2001.
Details of opinion polling
Since each MP is elected separately by the first past the post voting system, it is impossible to precisely project a clear election outcome from overall national shares of the vote. Not only can individual constituencies vary markedly from overall voting trends, but individual countries and regions within the nation may have a very different electoral contest that is not properly reflected in overall share of the vote figures.
Therefore, the first past the post system means that the number of MPs elected may not reflect the overall popular vote share across the parties. Thus, it is not necessarily the party with the largest share of the popular vote that ends up with the largest number of MPs. (See details of the elections in 1951 and February 1974) Since 1935 no party has achieved more than 50% of the popular vote in a British general election. The voting system favours parties with relatively concentrated support: a widely distributed vote leaves a party at risk of getting a large vote share but doing poorly in terms of numbers of seats (as the SDP-Liberal Alliance did in the 1980s), whereas parties with localised votes can win seats with a relatively small share of the vote.
That said, in previous elections, approximate forecasting of results were achieved by assuming that the swing in each individual constituency will be the same across the country. This system, known as uniform national swing (UNS) is used by much of the media in Britain to assess and extrapolate electoral fortunes from opinion poll data, though there has been criticism that such predictions may be naive and unreliable, even from providers of such data.[1]
Normally governments can easily survive for a full parliamentary term on a majority of more than 20 seats over all other parties. Below that level there is a danger of by-elections and MPs crossing the floor of the House reducing the government to a minority such that it would be at increased risk of losing a vote of no confidence.
Election battleground
The 2001 general election, which had the lowest turnout of any general election for more than 80 years, saw the Labour government of Tony Blair re-elected with a second successive landslide majority, which left the political landscape almost completely unchanged. William Hague resigned as leader of a Conservative opposition which failed to make any real progress from its heavy defeat in 1997, and was succeeded by Iain Duncan Smith.
The Labour government remained ascendant in the opinion polls, but its popularity began to suffer from March 2003 as a result of Tony Blair's decision to send British forces to collaborate with the American forces in their invasion of Iraq, which led to the end of Saddam Hussein's dictatorship, as well as his eventual capture, trial and execution by a new democratic Iraqi government. However, there was a public outcry that the invasion of Iraq failed to uncover weapons of mass destruction which had long been believed to exist in Iraq. By the summer of 2003, several opinion polls were showing a narrow Conservative lead, and the Liberal Democrats were also shown to be enjoying a surge in support, largely seen to be the result of Charles Kennedy's anti-war stance.
However, opinion polls showed that Iain Duncan Smith was not a popular choice with voters as a potential prime minister, and there was also the fact that Labour still had a huge parliamentary majority, while the Tories would have to almost double their share of seats in parliament to form a majority. Duncan Smith was ousted as leader in November 2003 following a vote of no confidence by his own party, was succeeded uncontested by the former Home Secretary Michael Howard, who helped the Tories keep close behind Labour in the opinion polls and oversaw strong showings in the local council and European parliament by-elections of 2004.
A general election was called for 5 May 2005, with Labour winning for a third successive time, but its majority dropped from 160 seats to 66 seats, with both the Conservatives and Liberal Democrats enjoying substantial gains.
Tony Blair had already decided that the 2005 general election would be the last he would contest as Labour Party leader if re-election was achieved. Michael Howard announced his resignation shortly afterwards, feeling that he was too old to lead the party into the next general election (knowing that it was unlikely to be held until he was almost 70 years old), and Charles Kennedy stepped down eight months later following revelations about his personal life.
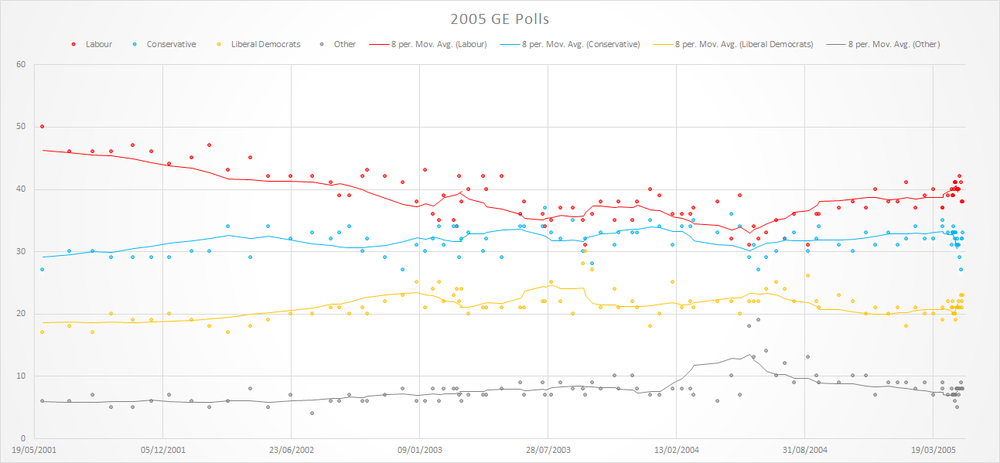
Graphical Summary
Poll results
Poll results are initially listed in reverse chronological order showing the most recent first, using the date the fieldwork was undertaken, as opposed to the date of publication.
The figure given in the 'lead' column is the lead held by Labour or the Conservatives over the second placed of the two parties.
| Date(s) Conducted | Polling Organisation/Client | Sample Size | Lab | Con | Lib Dems | Others | Lead |
|---|---|---|---|---|---|---|---|
| 5 May 2005 | 2005 Election Results (GB only) | – | 36.2% | 33.2% | 22.7% | 7.9% | 3.0% |
| 3–4 May 2005 | Ipsos MORI/Evening Standard | 1,164 | 38% | 33% | 23% | 8% | 5% |
| 2–3 May 2005 | Populus/The Times | 1174 | 38% | 32% | 21% | 8% | 6% |
| 1–3 May 2005 | ICM/Guardian | 1,178 | 38% | 32% | 22% | 8% | 6% |
| 29 April – 2 May 2005 | Populus/The Times | 866 | 41% | 27% | 23% | 9% | 14% |
| 27–30 April 2005 | Populus/The Times | 863 | 42% | 29% | 21% | 8% | 13% |
| 25–28 April 2005 | Populus/The Times | 853 | 40% | 31% | 22% | 7% | 9% |
| 24–27 April 2005 | Populus/The Times | 841 | 40% | 31% | 21% | 8% | 9% |
| 24–26 April 2005 | ICM/Guardian | 1,209 | 40% | 32% | 21% | 5% | 8% |
| 23–26 April 2005 | Populus/The Times | 835 | 40% | 31% | 21% | 8% | 9% |
| 22–25 April 2005 | Populus/The Times | 831 | 40% | 31% | 21% | 8% | 9% |
| 21–24 April 2005 | Populus/The Times | 819 | 41% | 33% | 19% | 7% | 8% |
| 20–23 April 2005 | Populus/The Times | 798 | 41% | 32% | 20% | 7% | 9% |
| 19–22 April 2005 | Populus/The Times Online | 798 | 41% | 33% | 20% | 6% | 8% |
| 18–21 April 2005 | Populus/The Times | 806 | 40% | 33% | 20% | 7% | 7% |
| 17–20 April 2005 | Populus/The Times | 836 | 39% | 34% | 20% | 7% | 5% |
| 17–19 April 2005 | ICM/Guardian | 1,163 | 39% | 33% | 22% | 7% | 6% |
| 16–19 April 2005 | Populus/The Times | 863 | 39% | 33% | 21% | 7% | 6% |
| 14–17 April 2005 | Populus/The Times | 586 | 40% | 31% | 21% | 8% | 9% |
| 10–12 April 2005 | ICM/Guardian | 1,169 | 39% | 33% | 22% | 7% | 6% |
| 1–3 April 2005 | ICM/Guardian | 973 | 37% | 34% | 21% | 8% | 3% |
| 1–3 April 2005 | Populus/The Times | 812 | 37% | 35% | 19% | 9% | 2% |
| 18–20 March 2005 | ICM/Guardian | 716 | 40% | 32% | 20% | 7% | 8% |
| 4–6 March 2005 | Populus/The Times | 831 | 39% | 32% | 20% | 9% | 7% |
| 18–20 February 2005 | ICM/Guardian | 1,013[2] | 37% | 34% | 21% | 8% | 3% |
| 4–6 February 2005 | Populus/The Times | 814 | 41% | 32% | 18% | 9% | 9% |
| 21–23 January 2005 | ICM/Guardian | 1,000[2] | 38% | 31% | 21% | 9% | 6% |
| 7–9 January 2005 | Populus/The Times | 848 | 38% | 33% | 20% | 9% | 5% |
| 16–19 December 2004 | ICM/Guardian | 1,002[2] | 40% | 31% | 21% | 7% | 8% |
| 3–5 December 2004 | Populus/The Times | 826 | 37% | 33% | 20% | 10% | 4% |
| 12–14 November 2004 | ICM/Guardian | 830 | 38% | 30% | 22% | 10% | 8% |
| 22–24 October 2004 | ICM/Guardian | 1,011 | 37% | 31% | 23% | 9% | 6% |
| 21–23 September 2004 | YouGov/Daily Telegraph | 2033 | 36% | 34% | 21% | 9% | 2% |
| 17–19 September 2004 | ICM/Guardian | 1,005 | 36% | 32% | 22% | 10% | 4% |
| 2–5 September 2004 | Populus/The Times | 608 | 31% | 30% | 26% | 13% | 1% |
| 13–15 August 2004 | ICM/Guardian | 1,005 | 36% | 33% | 22% | 9% | 3% |
| 30 July – 1 August 2004 | Populus/The Times | 570 | 32% | 32% | 24% | 12% | Tie |
| 16–18 July 2004 | ICM/Guardian | 1,007 | 35% | 30% | 25% | 10% | 5% |
| 2–3 July 2004 | Populus/The Times | 556 | 33% | 29% | 24% | 14% | 4% |
| 18–20 June 2004 | Ipsos MORI/Financial Times | 966 | 32% | 27% | 22% | 19% | 6% |
| 11–13 June 2004 | ICM/Guardian | 1,009 | 34% | 31% | 22% | 13% | 3% |
| 10 June 2004 | 2004 European election | ||||||
| 4–6 June 2004 | Populus/The Times | 589 | 31% | 29% | 22% | 18% | 3% |
| 20–23 May 2004 | ICM/Guardian | 1,001 | 39% | 34% | 20% | 7% | 5% |
| 7–9 May 2004 | Populus/The Times | 578 | 32% | 36% | 22% | 10% | 4% |
| 16–18 April 2004 | ICM/Guardian | 1,002 | 38% | 33% | 22% | 6% | 5% |
| 10–11 March 2004 | ICM/Guardian | 1,014 | 37% | 35% | 21% | 7% | 2% |
| 5–7 March 2004 | Populus/The Times | 573 | 36% | 34% | 22% | 8% | 2% |
| 20–22 February 2004 | ICM/Guardian | 1,006 | 36% | 34% | 21% | 8% | 2% |
| 6–8 February 2004 | Populus/The Times | 580 | 36% | 31% | 25% | 8% | 5% |
| 16–18 January 2004 | ICM/Guardian | 1,007 | 39% | 34% | 20% | 7% | 5% |
| 2–4 January 2004 | Populus/The Times | 566 | 40% | 35% | 18% | 7% | 5% |
| 12–14 December 2003 | ICM/Guardian[3] | 1,001 | 38% | 33% | 21% | 8% | 5% |
| 5–7 December 2003 | Populus/The Times | 557 | 35% | 33% | 22% | 10% | 2% |
| 14–16 November 2003 | ICM/Guardian[3] | 1,002 | 38% | 33% | 21% | 8% | 5% |
| 7–9 November 2003 | Populus/The Times | 554 | 35% | 31% | 24% | 10% | 4% |
| 6 November 2003 | Michael Howard elected Conservative Party leader | ||||||
| 17–19 October 2003 | ICM/Guardian[3] | 1,004 | 38% | 33% | 21% | 8% | 5% |
| 3–5 October 2003 | Populus/The Times | 524 | 36% | 28% | 27% | 9% | 8% |
| 23–25 September 2003 | YouGov/Daily Telegraph | 2306 | 31% | 32% | 30% | 7% | 1% |
| 19–21 September 2003 | ICM/Guardian | 1,002 | 35% | 30% | 28% | 8% | 5% |
| 5–6 September 2003 | Populus/The Times | 511 | 37% | 35% | 20% | 8% | 2% |
| 15–17 August 2003 | ICM/Guardian | 1,001 | 37% | 32% | 22% | 9% | 5% |
| 1–3 August 2003 | Populus/The Times | 564 | 35% | 33% | 25% | 7% | 2% |
| 22–24 July 2003 | YouGov/Daily Telegraph | 2219 | 34% | 37% | 22% | 7% | 3% |
| 18–20 July 2003 | ICM/Guardian | 1,003 | 36% | 34% | 22% | 9% | 2% |
| 20–22 June 2003 | ICM/Guardian | 1,001 | 38% | 34% | 21% | 7% | 4% |
| 13–15 June 2003 | Populus/The Times | 513 | 36% | 34% | 21% | 9% | 2% |
| 16–18 May 2003 | ICM/Guardian | 1,000 | 42% | 29% | 21% | 8% | 13% |
| 2–4 March 2003 | Populus/The Times | 565 | 35% | 34% | 23% | 8% | 1% |
| 22–24 April 2003 | YouGov/Daily Telegraph | 2390 | 40% | 32% | 21% | 7% | 8% |
| 17–19 April 2003 | ICM/Guardian | 1,000 | 42% | 30% | 21% | 7% | 12% |
| 26–27 March 2003 | YouGov/Daily Telegraph | 2282 | 40% | 33% | 20% | 7% | 7% |
| 10–12 March 2003 | Populus/The Times | 540 | 42% | 29% | 22% | 7% | 13% |
| 14–16 March 2003 | ICM/Guardian | 1,002 | 38% | 32% | 24% | 6% | 6% |
| 7–9 March 2003 | Populus/The Times | 498 | 34% | 34% | 24% | 8% | Tie |
| 14–16 February 2003 | ICM/Guardian | 1,003 | 39% | 31% | 22% | 8% | 8% |
| 7–9 February 2003 | Populus/The Times | 555 | 35% | 34% | 25% | 6% | 1% |
| 28–30 January 2003 | YouGov/Daily Telegraph | 1949 | 36% | 32% | 24% | 8% | 4% |
| 17–19 January 2003 | ICM/Guardian | 1,002 | 43% | 30% | 21% | 6% | 13% |
| 3–5 January 2003 | Populus/The Times | 565 | 38% | 31% | 25% | 6% | 7% |
| 13–15 December 2002 | ICM/Guardian | 1,006 | 41% | 27% | 23% | 8% | 14% |
| 15–17 November 2002 | ICM/Guardian | 1,000 | 42% | 29% | 22% | 7% | 13% |
| 18–20 October 2002 | ICM/Guardian | 1,001 | 43% | 32% | 20% | 6% | 11% |
| 11–13 October 2002 | Populus/The Times | 1,001 | 42% | 30% | 21% | 6% | 12% |
| 20–22 September 2002 | ICM/Guardian | 1,000 | 39% | 34% | 20% | 7% | 5% |
| 5–7 September 2002 | Populus/The Times | 610 | 39% | 33% | 21% | 6% | 6% |
| 23–25 August 2002 | ICM/Guardian | 1,003 | 41% | 32% | 21% | 6% | 9% |
| 26–27 July 2002 | ICM/Guardian | 1,002 | 42% | 33% | 20% | 4% | 9% |
| 21–23 June 2002 | ICM/Guardian | 1,002 | 42% | 32% | 20% | 7% | 10% |
| 17–19 May 2002 | ICM/Guardian | 1,003 | 42% | 34% | 19% | 5% | 8% |
| 20–21 April 2002 | ICM/Guardian | 1,000 | 45% | 29% | 18% | 8% | 16% |
| 15–17 March 2002 | ICM/Guardian | 1,001 | 43% | 34% | 17% | 6% | 9% |
| 15–17 February 2002 | ICM/Guardian | 1,003 | 47% | 30% | 18% | 5% | 17% |
| 18–20 January 2002 | ICM/Guardian | 1,003 | 45% | 30% | 19% | 6% | 15% |
| 14–16 December 2001 | ICM/Guardian | 1,000 | 44% | 29% | 20% | 7% | 15% |
| 16–18 November 2001 | ICM/Guardian | 1,004 | 46% | 29% | 19% | 6% | 17% |
| 19–20 October 2001 | ICM/Guardian | 1,000 | 47% | 29% | 19% | 5% | 18% |
| 14–16 September 2001 | ICM/Guardian | 1,007 | 46% | 29% | 20% | 5% | 17% |
| 17–19 August 2001 | ICM/Guardian | 1,004 | 46% | 30% | 17% | 7% | 16% |
| 13–14 July 2001 | ICM/Guardian | 1,001 | 46% | 30% | 18% | 6% | 16% |
| 31 May - 1 June 2001 | Ipsos MORI/The Sunday Telegraph | 1,021 | 50% | 27% | 17% | 6% | 23% |
| 7 June 2001 | 2001 Election Results | – | 42.0% | 32.7% | 18.8% | 6.5% | 9.3% |
References
- ↑ Predicting Results UK Polling Report
- 1 2 3 The number of responses used to calculate the voting intention was not provided; the total number of participants in the poll is therefore listed.
- 1 2 3 The responses to the questions on voting intention are not included in this document; they have therefore instead been taken from Guardian/ICM polls: every one since 1984.