World population estimates
This article lists estimates of world population, as well as projections of future developments. In summary, estimates for the progression of world population since the late medieval period are in the following ranges:
| year | 1400 | 1500 | 1600 | 1700 | 1800 | 1900 | 2000 | 2100[1] |
| population (in billions) | 0.35–0.40 | 0.42–0.50 | 0.50–0.58 | 0.60–0.68 | 0.89–0.98 | 1.56–1.71 | 6.06–6.15 | c. 10–13 |
| growth p.a.[2] | <0% | <0.12% | 0.15–0.3% | 0.1–0.15% | 0.3–0.5% | 0.5–0.6% | 1.3–1.4% | 0.7–0.8% |
Estimates for pre-modern times are necessarily fraught with great uncertainties, and few of the published estimates have confidence intervals; in the absence of a straightforward means to assess the error of such estimates, a rough idea of expert consensus can be gained by comparing the values given in independent publications. Population estimates cannot be considered accurate to more than two decimal digits; for example, world population for the year 2012 was estimated at 7.02, 7.06 and 7.08 billion by the United States Census Bureau, the Population Reference Bureau and the United Nations Department of Economic and Social Affairs, respectively, corresponding to a spread of estimates of the order of 0.8%.
Deep prehistory
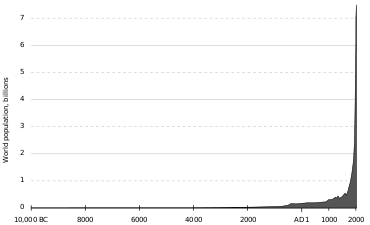
As a general rule, the confidence of estimates on historical world population decreases for the more distant past. Robust population data only exists for the last two or three centuries. Until the late 18th century, few governments had ever performed an accurate census. In many early attempts, such as in Ancient Egypt and the Persian Empire, the focus was on counting merely a subset of the population for purposes of taxation or military service.[3] Published estimates for the 1st century ("AD 1") suggest an uncertainty of the order of 50% (estimates range between 150 and 330 million). Some estimates extend their timeline into deep prehistory, to "10,000 BC", i.e. the early Holocene, when world population estimates range roughly between one and ten million (with an uncertainty of up to an order of magnitude).[4][5]
Estimates for yet deeper prehistory, into the Paleolithic, are of a different nature. At this time human populations consisted entirely of non-sedentary hunter-gatherer populations, with anatomically modern humans existing alongside archaic human varieties, some of which are still ancestral to the modern human population due to interbreeding with modern humans during the Upper Paleolithic. Estimates of the size of these populations are a topic of paleoanthropology. A late human population bottleneck is postulated by some scholars at approximately 70,000 years ago, during the Toba catastrophe, when Homo sapiens population may have dropped to as low as between 1,000 and 10,000 individuals.[6][7] For the time of speciation of Homo sapiens, some 200,000 years ago, an effective population size of the order of 10,000 to 30,000 individuals has been estimated, with an actual "census population" of early Homo sapiens of roughly 100,000 to 300,000 individuals.[8]
The question of "how many people have ever lived?" or "what percentage of people who have ever lived are alive today" can be traced to the 1970s.[9] The more dramatic phrasing of "the living outnumber the dead" also dates to the 1970s, a time of population explosion and growing fears of human overpopulation in the wake of decolonization and before the adoption of China's one-child policy. The claim that "the living outnumber the dead" was never accurate (although it may be roughly accurate if only ancestral population is considered). Arthur C. Clarke in 2001: A Space Odyssey (1968) has the claim that "Behind every man now alive stand 30 ghosts, for that is the ratio by which the dead outnumber the living", which was roughly accurate at the time of writing.[10]
Estimates of the "total number of people who have ever lived" is 107.6 billion as of 2011.[11] The answer naturally depends on the definition of "people", i.e. is only Homo sapiens to be counted, or all of genus Homo, but due to the small population sizes in the Lower Paleolithic, the order of magnitude of the estimate is not affected by the choice of cut-off date substantially more than by the uncertainty of estimates throughout the Neolithic to Iron Age.[12] The estimate is more crucially affected by the estimate of infant mortalities vs. stillborn infants, due to the very high infant mortality throughout the pre-modern period. An estimate on the "total number of people who have ever lived" as of 1995 was calculated by Haub (1995) at "about 105 billion births since the dawn of the human race" with a cut-off date at 50,000 BC (beginning of the Upper Paleolithic), and an inclusion of a high infant mortality rate throughout pre-modern history.[13]
Historical population
Before 1950
The following table uses astronomical year numbering for dates, negative numbers corresponding roughly to the corresponding year BC (i.e. -10000 = 10,001 BC, etc.). The table starts counting around the Late Glacial Maximum period, in which ice retreated and humans started to spread into the northern hemisphere.
From the beginning of the early modern period until the 20th century, world population has been characterized by a faster-than-exponential growth. For the period of Classical Antiquity to the Middle Ages, roughly 500 BC to AD 1500, there has also been a general tendency of growth (estimated at roughly a factor 4 to 5 over the 2,000 year period), but not strictly monotonic: A noticeable dip in world population is assumed due to the Black Death in the mid-14th century.[14]
| Year | PRB
(1973–2016)[15] |
UN
(2015)[16] |
Maddison
(2008)[17] |
HYDE
(2010)[18] |
Tanton
(1994)[19] |
Biraben
(1980)[20] |
McEvedy &
Jones (1978)[21] |
Thomlinson
(1975)[22] |
Durand
(1974)[23] |
Clark
(1967)[24] |
|---|---|---|---|---|---|---|---|---|---|---|
| -10000 | 2M[25] | 4M | 1–10M | |||||||
| -9000 | ||||||||||
| -8000 | 5M | 5–10M | ||||||||
| -7000 | ||||||||||
| -6000 | ||||||||||
| -5000 | 18M[25] | 5M | 5–20M | |||||||
| -4000 | 7M | |||||||||
| -3000 | 14M | |||||||||
| -2000 | 27M | |||||||||
| -1000 | 115M | 50M | ||||||||
| -200 | 150M | |||||||||
| 1 | 300M[26] | 300M | 231M[27] | 188M[25] | 150M | 255M | 170M | 200M | 270–330M | 256M[28] |
| 100 | 195M | |||||||||
| 200 | 202M | 256M | 190M | |||||||
| 300 | 205M | |||||||||
| 350 | 254M | |||||||||
| 400 | 209M | 206M | 190M | |||||||
| 500 | 210M[25] | 206M | 190M | |||||||
| 600 | 213M | 206M | 200M | 237M | ||||||
| 700 | 226M | 207M | 210M | |||||||
| 800 | 240M | 224M | 220M | 261M | ||||||
| 900 | 269M | 226M | 240M | |||||||
| 1000 | 310M | 267M | 295M[25] | 254M | 265M | 275–345M | 280M | |||
| 1100 | 353M | 301M | 320M | |||||||
| 1200 | 393M | 400M | 360M | 384M | ||||||
| 1250 | 400M | 416M | ||||||||
| 1300 | 392M | 300M | 432M | 360M | 400M | |||||
| 1340 | 443M | 378M | ||||||||
| 1400 | 390M | 374M | 350M | |||||||
| 1500 | 500M | 438M | 461M[25] | 460M | 425M | 440–540M | 427M | |||
| 1600 | 556M | 554M[25] | 579M | 545M | 498M | |||||
| 1650 | (<700M)[14] | 545M | 500M | 516M | ||||||
| 1700 | 603M | 603M[25] | 600M | 679M | 610M | 600M | 641M | |||
| 1750 | 791M | 814M | 770M | 720M | 700M | 735–805M | 731M | |||
| 1800 | 1,000M | 978M | 989M[25] | 900M | 954M | 900M | 900M | 890M | ||
| 1820 | 1,042M | |||||||||
| 1850 | 1,265M | 1,262M | 1,263M | 1,241M | 1,200M | 1,200M | ||||
| 1870 | 1,276M | |||||||||
| 1875 | 1,325M | |||||||||
| 1900 | 1,656M | 1,650M | 1,563M | 1,654M[25] | 1,600M | 1,633M | 1,625M | 1,600M | 1,650–1,710M | 1,668M |
| 1910 | 1,750M | 1,777M | ||||||||
| 1913 | 1,793M | |||||||||
| 1920 | 1,860M | 1,863M | 1,912M | 1,968M | ||||||
| 1925 | 2,000M | |||||||||
| 1930 | 2,070M | 2,092M | 2,145M | |||||||
| 1940 | 2,300M | 2,299M | 2,307M | 2,340M | ||||||
1950 to present
For times after World War II, demographic data of some accuracy becomes available for a significant number of countries, and population estimates are often given as grand totals of numbers (typically given by country) of widely diverging accuracies. Some sources give these numbers rounded to the nearest million or the nearest thousand, while others give them without any rounding.
Taking these numbers at face value would be false precision; in spite of being stated to four, seven or even ten digits, they should not be interpreted as accurate to more than three digits at best (estimates by the United States Census Bureau and by the United Nations differ by about 0.5–1.5%).
| Year | United States Census Bureau
(2017)[29] |
Population Reference Bureau
(1973–2016)[15] |
United Nations Department of Economic and Social Affairs
(2015)[16] |
Maddison
(2008)[17] |
HYDE
(2007)[25] |
Tanton
(1994)[19] |
Biraben
(1980)[20] |
McEvedy &
Jones (1978)[21] |
Thomlinson
(1975)[22] |
Durand
(1974)[23] |
Clark
(1967)[24] |
|---|---|---|---|---|---|---|---|---|---|---|---|
| 1950 | 2,557,628,654 | 2,516,000,000 | 2,525,149,000 | 2,544,000,000 | 2,527,960,000 | 2,400,000,000 | 2,527,000,000 | 2,500,000,000 | 2,400,000,000 | 2,486,000,000 | |
| 1951 | 2,594,939,877 | 2,572,850,917 | 2,571,663,000 | ||||||||
| 1952 | 2,636,772,306 | 2,619,292,068 | 2,617,949,000 | ||||||||
| 1953 | 2,682,053,389 | 2,665,865,392 | 2,665,959,000 | ||||||||
| 1954 | 2,730,228,104 | 2,713,172,027 | 2,716,927,000 | ||||||||
| 1955 | 2,782,098,943 | 2,761,650,981 | 2,769,074,000 | ||||||||
| 1956 | 2,835,299,673 | 2,811,572,031 | 2,822,502,000 | ||||||||
| 1957 | 2,891,349,717 | 2,863,042,795 | 2,879,934,000 | ||||||||
| 1958 | 2,948,137,248 | 2,916,030,167 | 2,939,254,000 | ||||||||
| 1959 | 3,000,716,593 | 2,970,395,814 | 2,995,909,000 | ||||||||
| 1960 | 3,043,001,508 | 3,026,002,942 | 3,041,507,000 | 3,042,000,000 | |||||||
| 1961 | 3,083,966,929 | 3,082,830,266 | 3,082,161,000 | ||||||||
| 1962 | 3,140,093,217 | 3,141,071,531 | 3,135,787,000 | 3,036,000,000 | |||||||
| 1963 | 3,209,827,882 | 3,201,178,277 | 3,201,354,000 | ||||||||
| 1964 | 3,281,201,306 | 3,263,738,832 | 3,266,477,000 | ||||||||
| 1965 | 3,350,425,793 | 3,329,122,479 | 3,333,138,000 | ||||||||
| 1966 | 3,420,677,923 | 3,397,475,247 | 3,402,224,000 | 3,288,000,000 | |||||||
| 1967 | 3,490,333,715 | 3,468,521,724 | 3,471,464,000 | ||||||||
| 1968 | 3,562,313,822 | 3,541,674,891 | 3,543,086,000 | ||||||||
| 1969 | 3,637,159,050 | 3,616,108,749 | 3,615,743,000 | ||||||||
| 1970 | 3,712,697,742 | 3,691,172,616 | 3,691,157,000 | 3,710,000,000 | 3,637,000,000 | 3,600,000,000 | 3,600,000,000– 3,700,000,000 | 3,632,000,000 | |||
| 1971 | 3,790,326,948 | 3,766,754,345 | 3,769,818,000 | ||||||||
| 1972 | 3,866,568,653 | 3,842,873,611 | 3,846,499,000 | ||||||||
| 1973 | 3,942,096,442 | 3,919,182,332 | 3,922,793,000 | 3,923,000,000 | 3,860,000,000 | ||||||
| 1974 | 4,016,608,813 | 3,995,304,922 | 3,997,677,000 | ||||||||
| 1975 | 4,089,083,233 | 4,071,020,434 | 4,070,671,000 | 3,900,000,000 | 4,000,000,000 | ||||||
| 1976 | 4,160,185,010 | 4,146,135,850 | 4,141,445,000 | ||||||||
| 1977 | 4,232,084,578 | 4,220,816,737 | 4,213,539,000 | ||||||||
| 1978 | 4,304,105,753 | 4,295,664,825 | 4,286,317,000 | ||||||||
| 1979 | 4,379,013,942 | 4,371,527,871 | 4,363,144,000 | ||||||||
| 1980 | 4,451,362,735 | 4,449,048,798 | 4,439,529,000 | 4,461,000,000 | |||||||
| 1981 | 4,534,410,125 | 4,528,234,634 | 4,514,838,000 | ||||||||
| 1982 | 4,614,566,561 | 4,608,962,418 | 4,587,307,000 | ||||||||
| 1983 | 4,695,736,743 | 4,691,559,840 | 4,676,388,000 | ||||||||
| 1984 | 4,774,569,391 | 4,776,392,828 | 4,756,521,000 | ||||||||
| 1985 | 4,856,462,699 | 4,863,601,517 | 4,837,719,000 | 5,000,000,000 | |||||||
| 1986 | 4,940,571,232 | 4,953,376,710 | 4,920,968,000 | ||||||||
| 1987 | 5,027,200,492 | 5,045,315,871 | 5,006,672,000 | ||||||||
| 1988 | 5,114,557,167 | 5,138,214,688 | 5,093,306,000 | ||||||||
| 1989 | 5,201,440,110 | 5,230,000,000 | 5,180,540,000 | ||||||||
| 1990 | 5,288,955,934 | 5,320,816,667 | 5,269,029,000 | 5,308,000,000 | |||||||
| 1991 | 5,371,585,922 | 5,408,908,724 | 5,351,922,000 | ||||||||
| 1992 | 5,456,136,278 | 5,494,899,570 | 5,435,722,000 | ||||||||
| 1993 | 5,538,268,316 | 5,578,865,109 | 5,518,127,000 | ||||||||
| 1994 | 5,618,682,132 | 5,661,086,346 | 5,599,396,000 | ||||||||
| 1995 | 5,699,202,985 | 5,760,000,000 | 5,741,822,412 | 5,681,575,000 | |||||||
| 1996 | 5,779,440,593 | 5,821,016,750 | 5,762,212,000 | ||||||||
| 1997 | 5,857,972,543 | 5,840,000,000 | 5,898,688,337 | 5,842,122,000 | |||||||
| 1998 | 5,935,213,248 | 5,975,303,657 | 5,921,366,000 | ||||||||
| 1999 | 6,012,074,922 | 6,051,478,010 | 5,999,622,000 | ||||||||
| 2000 | 6,088,571,383 | 6,067,000,000 | 6,127,700,428 | 6,076,558,000 | 6,145,000,000 | 5,750,000,000 | |||||
| 2001 | 6,165,219,247 | 6,137,000,000 | 6,204,147,026 | 6,154,791,000 | |||||||
| 2002 | 6,242,016,348 | 6,215,000,000 | 6,280,853,817 | 6,231,704,000 | |||||||
| 2003 | 6,318,590,956 | 6,314,000,000 | 6,357,991,749 | 6,308,364,000 | |||||||
| 2004 | 6,395,699,509 | 6,396,000,000 | 6,435,705,595 | 6,374,056,000 | |||||||
| 2005 | 6,473,044,732 | 6,477,000,000 | 6,514,094,605 | 6,462,987,000 | |||||||
| 2006 | 6,551,263,534 | 6,555,000,000 | 6,593,227,977 | 6,540,214,000 | |||||||
| 2007 | 6,629,913,759 | 6,625,000,000 | 6,673,105,937 | 6,616,689,000 | |||||||
| 2008 | 6,709,049,780 | 6,705,000,000 | 6,753,649,228 | 6,694,832,000 | |||||||
| 2009 | 6,788,214,394 | 6,809,972,000 | 6,834,721,933 | 6,764,086,000 | |||||||
| 2010 | 6,858,584,755 | 6,892,319,000 | 6,916,183,482 | ||||||||
| 2011 | 6,935,999,491 | 6,986,951,000 | 6,997,998,760 | ||||||||
| 2012 | 7,013,871,313 | 7,057,075,000 | 7,080,072,417 | ||||||||
| 2013 | 7,092,128,094 | 7,136,796,000 | 7,162,119,434 | ||||||||
| 2014 | 7,169,968,185 | 7,238,184,000 | 7,243,784,000 | ||||||||
| 2015 | 7,247,892,788 | 7,336,435,000 | 7,349,472,000 | ||||||||
| 2016 | 7,325,996,709 | 7,418,151,841 | |||||||||
Projections
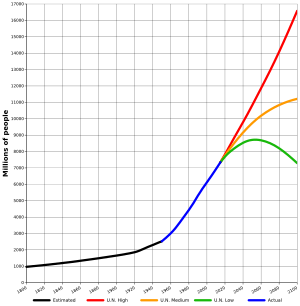
As of 2015, the population of the world is projected to reach 8 billion in 2025, and 9 billion by about 2040/42. Kapitza (1996) estimated an asymptotic limit of population growth of 14 billion, 90% of which (12.6 billion) expected to be reached by 2135.[30]
Reasonable predictions of population development are possible for the next 30 years or so, representing the period of fertility of the children alive today. Projections of population reaching more than one generation into the future are highly speculative: Thus, the United Nations Department of Economic and Social Affairs report of 2004 projected the world population to peak at 9.22 billion in 2075 and then stabilise at a value close to 9 billion;[31] By contrast, a 2014 projection by the United Nations Population Division predicts a population close to 11 billion by 2100 without any declining trend in the foreseeable future.[32] On the other hand, a conservative scenario published in 2012 assumes that a maximum of 8 billion will be reached before 2040.[33]
The following table shows projections of world population for the 21st century.
| Year | United States Census Bureau
(2015)[29] |
Population Reference Bureau
(1973-2015)[15] |
United Nations Department of Economic and Social Affairs
(2015)[16] |
|---|---|---|---|
| 2016 | 7,334,771,614 | 7,432,663,280 | |
| 2017 | 7,412,778,971 | ||
| 2018 | 7,490,427,640 | ||
| 2019 | 7,567,402,977 | ||
| 2020 | 7,643,402,123 | 7,758,157,000 | |
| 2021 | 7,718,256,830 | ||
| 2022 | 7,792,021,317 | ||
| 2023 | 7,864,725,370 | ||
| 2024 | 7,936,271,554 | ||
| 2025 | 8,006,580,553 | 8,000,000,000 | 8,141,661,000 |
| 2026 | 8,075,716,000 | ||
| 2027 | 8,143,729,466 | ||
| 2028 | 8,210,559,895 | ||
| 2029 | 8,276,190,519 | ||
| 2030 | 8,340,606,590 | 8,505,000,000 | 8,500,766,000 |
| 2031 | 8,403,880,343 | ||
| 2032 | 8,466,094,022 | ||
| 2033 | 8,527,246,205 | ||
| 2034 | 8,587,325,154 | ||
| 2035 | 8,646,304,704 | 8,838,908,000 | |
| 2036 | 8,704,239,274 | ||
| 2037 | 8,761,189,197 | ||
| 2038 | 8,817,138,785 | ||
| 2039 | 8,872,066,537 | ||
| 2040 | 8,925,949,679 | 9,157,234,000 | |
| 2041 | 8,978,822,945 | ||
| 2042 | 9,030,723,366 | ||
| 2043 | 9,081,617,002 | ||
| 2044 | 9,131,462,326 | ||
| 2045 | 9,180,225,214 | 9,453,892,000 | |
| 2046 | 9,227,935,007 | ||
| 2047 | 9,274,616,811 | ||
| 2048 | 9,320,232,984 | ||
| 2049 | 9,364,750,182 | ||
| 2050 | 9,408,141,302 | 9,804,000,000 | 9,725,148,000 |
| 2055 | 9,968,809,000 | ||
| 2060 | 10,184,290,000 | ||
| 2065 | 10,375,719,000 | ||
| 2070 | 10,547,989,000 | ||
| 2075 | 10,701,653,000 | ||
| 2080 | 10,836,635,000 | ||
| 2085 | 10,953,525,000 | ||
| 2090 | 11,055,270,000 | ||
| 2095 | 11,142,461,000 | ||
| 2100 | 11,213,317,000 | ||
Other, historical projections include
By world region
Asia Africa Europe South/Central America North America Oceania
Population estimates for world regions based on Maddison (2007),[34] in millions. The row showing total world population includes the average growth rate per year over the period separating each column from the preceding one.
| year | 1 | 1000 | 1500 | 1600 | 1700 | 1820 | 1913 | 2000 | 2030 |
|---|---|---|---|---|---|---|---|---|---|
| East/Southeast Asia | 74 (33%) | 88 (33%) | 166 (38%) | 223 (40%) | 216 (36%) | 469 (45%) | 613 (34%) | 1,996 (33%) | 2,417 (30%) |
| South Asia | 75 (33%) | 75 (28%) | 110 (25%) | 135 (24%) | 165 (27%) | 216 (21%) | 326 (18%) | 1,372 (23%) | 2,003 (25%) |
| Europe[35] | 34 (15%) | 40 (15%) | 78 (18%) | 112 (20%) | 127 (21%) | 224 (21%) | 498 (28%) | 742 (13%) | 829 (11%) |
| West Asia | 19 (8%) | 20 (7%) | 18 (3%) | 21 (3%) | 21 (3%) | 25 (2%) | 39 (2%) | 237 (4%) | 370 (5%) |
| Africa | 17 (8%) | 32 (12%) | 47 (11%) | 55 (10%) | 61 (10%) | 74 (7%) | 125 (7%) | 798 (13%) | 1,449 (18%) |
| South/Central America | 6 (3%) | 11 (4%) | 18 (4%) | 9 (2%) | 12 (2%) | 22 (2%) | 81 (5%) | 520 (9%) | 702 (9%) |
| North America | 1 (0%) | 1 (0%) | 2 (0%) | 2 (0%) | 1 (0%) | 11 (1%) | 105 (6%) | 314 (5%) | 413 (5%) |
| World | 226 | 267 (+ 0.02% p.a.) | 438 (+ 0.1% p.a.) | 556 (+ 0.2% p.a.) | 603 (+ 0.1% p.a.) | 1,041 (+ 0.5% p.a.) | 1,791 (+ 0.6% p.a.) | 6,062 (+ 1.4% p.a.) | 8,175 (+ 1.0% p.a.) |
When considering population estimates by world region, it is worth noting that population history of the indigenous peoples of the Americas before the 1492 voyage of Christopher Columbus has proven difficult to establish, with many historians arguing for an estimate of 50 million people throughout the Americas, and some estimating that populations may have reached 100 million people or more.[36] It is therefore estimated by some that populations in Mexico, Central, and South America could have reached 37 million by 1492.[37] Additionally, the population estimate of 2 million for North America for the same time period represents the low end of modern estimates, and some estimate the population to have been as high as 18 million.[38]
See also
References
- ↑ UN World Population Prospect 2017 gives a "median" estimate of 11.2 billion for 2100, with a "95% confidence interval" between 10 and 13 billion.
- ↑ range of estimates for average growth rates over the preceding century according to the data cited under #Historical_population; The average growth rate for the 14th century is negative as a consequence of the Black Death.
- ↑ Kurt, A. (1995). The Ancient Near East, c. 3000–330 BCE. Vol. 2. London: Routledge. p. 695.
- ↑ Thomlinson (1975): "one to ten million".
- ↑ Pala, M; Olivieri, A; Achilli, A; Accetturo, M; Metspalu, E; Reidla, M; Tamm, E; Karmin, M; Reisberg, T; Hooshiar Kashani, B; Perego, UA; Carossa, V; Gandini, F; Pereira, JB; Soares, P; Angerhofer, N; Rychkov, S; Al-Zahery, N; Carelli, V; Sanati, MH; Houshmand, M; Hatina, J; Macaulay, V; Pereira, L; Woodward, SR; Davies, W; Gamble, C; Baird, D; Semino, O; Villems, R; Torroni, A; Richards, MB (2012). "Mitochondrial DNA signals of late glacial recolonization of Europe from near eastern refugia". Am. J. Hum. Genet. 90: 915–24. doi:10.1016/j.ajhg.2012.04.003. PMC 3376494. PMID 22560092.
- ↑ Stanley H. Ambrose (1998). "Late Pleistocene human population bottlenecks, volcanic winter, and differentiation of modern humans". Journal of Human Evolution. 34 (6): 623–651. doi:10.1006/jhev.1998.0219. PMID 9650103. Ambrose, Stanley H. (2005). "Volcanic Winter, and Differentiation of Modern Humans". Bradshaw Foundation. Retrieved 2006-04-08.
- ↑ Robock, A., C.M. Ammann, L. Oman, D. Shindell, S. Levis, and G. Stenchikov (2009). "Did the Toba volcanic eruption of ~74k BP produce widespread glaciation?". Journal of Geophysical Research. 114 (D10): D10107. Bibcode:2009JGRD..11410107R. doi:10.1029/2008JD011652.
- ↑ Per Sjödin, Agnès E Sjöstrand, Mattias Jakobsson and Michael G B Blum, "Resequencing data provide no evidence for a human bottleneck in Africa during the penultimate glacial period" Mol Biol Evol (2012) doi: 10.1093/molbev/mss061. "A small human effective population size, on the order of 10,000 individuals, which is smaller than the effective population size of most great apes, has been interpreted as a result of a very long history, starting ∼ 2 mya, of a small population size, coined as the long-necked bottle model (Harpending et al. 1998; Hawks et al. 2000). Our findings are consistent with this hypothesis, but, depending on the mutation rate, we find either an effective population size of NA = 12,000 (95% C.I. = 9,000–15,500 when averaging over all three demographic models) using the mutation rate calibrated with the human-chimp divergence or an effective population size of NA = 32,500 individuals (95% C.I. = 27,500–34,500) using the mutation rate given by whole-genome trio analysis (The 1000 Genomes Project Consortium 2010) (supplementary figure 4 and table 6, Supplementary Material online). Not surprisingly, the estimated effective mutation rates θ = 4NAµ are comparable for the two mutation rates we considered, and are equal to 1.4 × 10⁻³/bp/generation (95% C.I. = (1.1–1.7) × 10−3). Relating the estimated effective population size to the census population size during the Pleistocene is a difficult task because there are many factors affecting the effective population size (Charlesworth 2009). Nevertheless, based on published estimates of the ratio between effective and census population size, a comprehensive value on the order of 10% has been found by Frankham (1995). This 10% rule roughly predicts that 120,000−325,[0]00 individuals (depending on the assumed mutation rate)"
- ↑ Haub (1995): "at some time back in the 1970s, some now-forgotten writer made the statement that 75 percent of the people who had ever been born were alive at that moment." Haub (1995) is the basis of a 2007 article in Scientific American, "Fact or Fiction". Scientificamerican.com.
- ↑ Wesley Stephenson, Do the dead outnumber the living?, BBC News 4 February 2012. Ciara Curtin, Fact or Fiction?: Living People Outnumber the Dead, Scientific American, 1 March 2007.
- ↑ Kapitza, 'The phenomenological theory of world population growth', Physics-Uspekhi 39(1) 57–71 (1996) cites estimates ranging between 80 and 150 billion (Sergei P Kapitza, 'The phenomenological theory of world population growth', Physics-Uspekhi 39(1) 57–71, 1996), citing K. M. Weiss, Human Biology 56637, 1984, and N. Keyfitz, Applied Mathematical Demography, New York: Wiley, 1977). Haub (1995) cited 105 billion, updated to 107 billion as of 2011 in Haub, Carl (October 2011). "How Many People Have Ever Lived on Earth?". Population Reference Bureau. Retrieved April 29, 2013.
- ↑ Haub (1995): "Clearly, the period 8000 B.C. to 1 A.D. is key to the magnitude of our number, but, unfortunately, little is known about that era. ... of course, pushing the date of humanity's arrival on the planet before 50,000 B.C. would also raise the number, although perhaps not by terribly much."
- ↑ Haub (1995): "Life expectancy at birth probably averaged only about 10 years for most of human history. Estimates of average life expectancy in Iron Age France have been put at only 10 or 12 years. Under these conditions, the birth rate would have to be about 80 per 1,000 people just for the species to survive. ... Our birth rate assumption will greatly affect the estimate of the number of persons ever born. Infant mortality in the human race's earliest days is thought to have been very high—perhaps 500 infant deaths per 1,000 births, or even higher. ... Birth rates were set at 80 per 1,000 per year through 1 A.D. and at 60 per 1,000 from 2 A.D. to 1750. Rates then declined to the low 30s by the modern period. (For a brief bibliography of sources consulted in the course of this alchemy, see [Colin McEvedy and Richard Jones 1978])." "So, our estimate here is that about 5.5 percent of all people ever born are alive today." Using the UN estimates for birth rates ("UNdata: Crude birth rate". United Nations. 25 August 2011. ) and world population (U.S. Census Bureau, International Data Base), there were an estimated 3.0 billion births during 1995–2016, so that based on the estimate by Haub (1995), the figures for 2017 would be "about 108 billion births" and "about 7 percent of all people ever born are alive today."
- 1 2 Haub (1995): "The average annual rate of growth was actually lower from 1 A.D. to 1650 than the rate suggested above for the 8000 B.C. to 1 A.D. period. One reason for this abnormally slow growth was the Black Plague. This dreaded scourge was not limited to 14th century Europe. The epidemic may have begun about 542 A.D. in Western Asia, spreading from there. It is believed that half the Byzantine Empire was destroyed in the 6th century, a total of 100 million deaths."
- 1 2 3 Data from Population Reference Bureau.
2016 estimate: (a) "2016 World Population Data Sheet"
2015 estimate: (b) Toshiko Kaneda, 2015, "2015 World Population Data Sheet".
2014 estimate: (c) Carl Haub, 2014, "2014 World Population Data Sheet".
2013 estimate: (d) Carl Haub, 2013, "2013 World Population Data Sheet".
2012 estimate: (e) Carl Haub, 2012, "2012 World Population Data Sheet".
2011 estimate: (f) Carl Haub, 2011, "2011 World Population Data Sheet".
2010 estimate: (g) Carl Haub, 2010, "2010 World Population Data Sheet".
2009 estimate: (h) Carl Haub, 2009, "2009 World Population Data Sheet".
2008 estimate: (i) Carl Haub, 2008, "2008 World Population Data Sheet".
2007 estimate: (j) Carl Haub, 2007, "2007 World Population Data Sheet".
2006 estimate: (k) Carl Haub, 2006, "2006 World Population Data Sheet".
2005 estimate: (l) Carl Haub, 2005, "2005 World Population Data Sheet".
2004 estimate: (m) Carl Haub, 2004, "2004 World Population Data Sheet".
2003 estimate: (n) Carl Haub, 2003, "2003 World Population Data Sheet".
2002 estimate: (o) Carl Haub, 2002, "2002 World Population Data Sheet".
2001 estimate: (p) Carl Haub, 2001, "2001 World Population Data Sheet".
2000 estimate: (q) 2000, "9 Billion World Population by 2050".
1997 estimate: (r) 1997, "Studying Populations".
Estimates for 1995 and prior: (s) Carl Haub, 1995, "How Many People Have Ever Lived on Earth?" Population Today, Vol. 23 (no. 2), pp. 5–6. - 1 2 3 Data from United Nations Department of Economic and Social Affairs, Population Division.
1950–2100 estimates (only medium variants shown): (a) World Population Prospects: The 2008 Revision.
Estimates prior to 1950: (b) "The World at Six Billion", 1999.
Estimates from 1950 to 2100: (c) "Population of the entire world, yearly, 1950 - 2100", 2013. Archived November 19, 2016, at the Wayback Machine.
2014: (d) http://esa.un.org/unpd/wup/Highlights/WUP2014-Highlights.pdf "2014 World Urbanization Prospects", 2014.]
2015: (e) http://esa.un.org/unpd/wpp/Publications/Files/Key_Findings_WPP_2015.pdf "2015 World Urbanization Prospects", 2015.] Archived March 20, 2014, at the Wayback Machine. - 1 2 Angus Maddison, 2003, The World Economy: Historical Statistics, Vol. 2, OECD, Paris Archived May 13, 2008, at the Wayback Machine.
ISBN 92-64-10412-7.
"Statistical Appendix" (2008, ggdc.net) "The historical data were originally developed in three books: Monitoring the World Economy 1820-1992, OECD, Paris 1995; The World Economy: A Millennial Perspective, OECD Development Centre, Paris 2001; The World Economy: Historical Statistics, OECD Development Centre, Paris 2003. All these contain detailed source notes. Figures for 1820 onwards are annual, wherever possible. For earlier years, benchmark figures are shown for 1 AD, 1000 AD, 1500, 1600 and 1700." "OECD countries GDP revised and updated 1991-2003 from National Accounts for OECD Countries, vol. I, 2006. Norway 1820-1990 GDP from Ola Grytten (2004), “The Gross Domestic Product for Norway, 1830-2003” in Eitrheim, Klovland and Qvigstad (eds), Historical Monetary Statistics for Norway, 1819-2003, Norges Bank, Oslo. Latin American GDP 2000-2003 revised and updated from ECLAC, Statistical Yearbook 2004 and preliminary version of the 2005 Yearbook supplied by Andre Hofman. For Chile, GDP 1820-2003 from Rolf Lűders (1998), “The Comparative Economic Performance of Chile 1810-1995”, Estudios de Economia, vol. 25, no. 2, with revised population estimates from Diaz, J., R. Lűders, and G. Wagner (2005) Chili 1810-2000: la Republica en Cifras, mimeo, Instituto de Economia, Universidad Católica de Chile. For Peru, GDP 1896-1990 and population 1896-1949 from Bruno Seminario and Arlette Beltran, Crecimiento Economico en el Peru 1896-1995, Universidad del Pacifico, 1998. " "For Asia there are amendments to the GDP estimates for South and North Korea, 1911-74, to correct an error in Maddison (2003). Estimates for the Philippines, 1902-1940 were amended in line with Richard Hooley (2005), 'American Economic Policy in the Philippines, 1902-1940', Journal of Asian Economics, 16. 1820 estimates were amended for Hong Kong, the Philippines, Singapore, Sri Lanka, Taiwan and Thailand." "Asian countries GDP revised and updated 1998-2003 from Asian Development Bank, Key Indicators 2005, except for South Korea and Japan, where OECD sources were used for 1991-2003. GDP for African countries updated 2000-2003 from IMF, World Economic Outlook, April 2005. Population estimates for all countries except China and Indonesia revised and updated 1950-2008 and 2030 from International Data Base, International Programs Center, Population Division, US Bureau of the Census, April 2005 version. China’s population 1990-2003 from China Statistical Yearbook 2005, China Statistics Press, Beijing. Indonesian population 1950-2003 kindly supplied by Pierre van der Eng. The figures now include three countries previously omitted: Cook Islands, Nauru and Tuvalu." - ↑ Klein Goldewijk, K. , A. Beusen, M. de Vos and G. van Drecht (2011). The HYDE 3.1 spatially explicit database of human induced land use change over the past 12,000 years, Global Ecology and Biogeography20(1): 73-86. doi:10.1111/j.1466-8238.2010.00587.x (pbl.nl). HYDE (History Database of the Global Environment), 2010. HYDE 3.1 gives estimates for 5000 BC, 1000 BC and "AD 0". HYDE estimates are higher than those by Colin McEvedy (1978) but lower than those by Massimo Livi Bacci (1989, 2012). (graphs (itbulk.org)).
- 1 2 Slightly updated data from original paper in French: (a) Jean-Noël Biraben, 1980, "An Essay Concerning Mankind's Evolution", Population, Selected Papers, Vol. 4, pp. 1–13. Original paper in French: (b) Jean-Noël Biraben, 1979, "Essai sur l'évolution du nombre des hommes", Population, Vol. 34 (no. 1), pp. 13–25.
- 1 2 3 Colin McEvedy and Richard Jones, 1978, Atlas of World Population History, Facts on File, New York, ISBN 0-7139-1031-3.
- 1 2 Ralph Thomlinson, 1975, Demographic Problems: Controversy over population control, 2nd Ed., Dickenson Publishing Company, Ecino, CA, ISBN 0-8221-0166-1.
- 1 2 John D. Durand, 1974, "Historical Estimates of World Population: An Evaluation", University of Pennsylvania, Population Center, Analytical and Technical Reports, Number 10.
- 1 2 Colin Clark, 1967, Population Growth and Land Use, St. Martin's Press, New York, ISBN 0-333-01126-0.
- 1 2 3 4 5 6 7 8 9 10 11 Data from History Database of the Global Environment. K. Klein Goldewijk, A. Beusen and P. Janssen, "HYDE 3.1: Long-term dynamic modeling of global population and built-up area in a spatially explicit way", from table on pg. 2, Netherlands Environmental Assessment Agency (MNP), Bilthoven, The Netherlands.
- ↑ Haub (1995): "By 1 A.D., the world may have held about 300 million people. One estimate of the population of the Roman Empire, from Spain to Asia Minor, in 14 A.D. is 45 million. However, other historians set the figure twice as high, suggesting how imprecise population estimates of early historical periods can be."
- ↑ "The present figures are a revision and update of those presented on this website in 2003. The most significant changes are in the entries for the year 1, where gaps in previous tables have been filled with the new estimates for the Roman Empire in Maddison (2007). The estimates are in fact for 14 AD"
- ↑ The estimates are in fact for 14 AD"
- 1 2 Data from U.S. Census Bureau, International Data Base Retrieved on 28 Oct, 2017
- ↑ "The expression for growth (6) indicates a limit for world population N=πK2=14×109, in the foreseeable future. Of this asymptotic limit 90% will be reached for Model III by year 2135, or in 3T years after T1 = 2007." Sergei P. Kapitza, 'The phenomenological theory of world population growth', Physics-Uspekhi 39(1) 57-71 (1996).
- ↑ United Nations Department of Economic and Social Affairs. World Population to 2300. 2004. Executive Summary, Page 2.
- ↑ Gerland, P.; Raftery, A. E.; Ev Ikova, H.; Li, N.; Gu, D.; Spoorenberg, T.; Alkema, L.; Fosdick, B. K.; Chunn, J.; Lalic, N.; Bay, G.; Buettner, T.; Heilig, G. K.; Wilmoth, J. (September 14, 2014). "World population stabilization unlikely this century". Science. AAAS. 346 (6206): 234–7. Bibcode:2014Sci...346..234G. doi:10.1126/science.1257469. ISSN 1095-9203. PMC 4230924. PMID 25301627. Retrieved September 21, 2014.
- ↑ Randers, Jorgen (2012). 2052: A Global Forecast for the Next Forty Years. Vermont: Chelsea Green Publishing. p. 62.
- ↑ Angus Maddison, The World Economy: Historical Statistics, Statistical Appendix (2007, ggdc.net). Estimates cited are for the beginning of the 1st millennium ("year 0"), the beginning of the 2nd millennium ("year 1000"), and for the beginning each century since the 16th (years 1820 and 1913 are given for the 19th and 20th century, respectively, as Maddison presents detailed estimates for these years), and a projection for the year 2030.
- ↑ includes Central Asia (listed under "former USSR")
- ↑ Taylor, Alan (2002). American Colonies. Penguin. ISBN 9780142002100.
- ↑ "La catastrophe démographique" (The Demographic Catastrophe"), L'Histoire n°322, July–August 2007, p. 17.
- ↑ Dobyns, Henry (1983). Their Number Become Thinned: Native American Dynamics in Eastern North America. Knoxville: University of Tennessee Press.
Further reading
- Haub, Carl (October 2011). "How Many People Have Ever Lived on Earth?". Population Reference Bureau. Retrieved 21 July 2013.
External links
| Major topics | |
|---|---|
| Biological and related topics | |
| Human impact on the environment | |
| Literature |
|
| Publications | |
| Lists | |
Events and organizations | |
| Related topics | |
| |