Projections of population growth

Projections of population growth established in 2017 predict that the human population is likely to keep growing until 2100,[1] reaching an estimated 8.6 billion in 2030, 9.8 billion in 2050 and 11.2 billion by 2100, while the 7 billion milestone was reached in 2011.[2] As the demographic transition follows its course worldwide, the population will age significantly, with most countries outside Africa trending towards a rectangular age pyramid.[3]
The world population is currently growing by approximately 83 million people each year.[1] Growth rates are slowing to various extents within different populations with result of the overall population growth rate decreasing from 1.55% per year in 1995 to 1.25% in 2005, 1.18% in 2015 and 1.10% in 2017. The median estimate for future growth sees the world population reaching 8.6 billion in 2030, 9.8 billion in 2050 and 11.2 billion by 2100[1] assuming a continuing decrease in average fertility rate from 2.5 births per woman in 2010–2015 to 2.2 in 2045–2050 and to 2.0 in 2095–2100, according to the medium-variant projection.[1] With longevity trending towards uniform and stable values worldwide, the main driver of future population growth is the evolution of the fertility rate.[4]:8
While most scenarios still predict continued growth into the 22nd century, there is a roughly 27% chance that the total population could stabilize or begin to fall before 2100.[4]:3 Longer-term speculative scenarios over the next two centuries can predict anything between runaway growth to radical decline (36.4 billion or 2.3 billion people in 2300), with the median projection showing a slight decrease followed by a stabilization around 9 billion people.[5]:13
By 2070, the bulk of the world's population growth is predicted to take place in Africa: of the additional 2.4 billion people projected between 2015 and 2050, 1.3 billion will be added in Africa, 0.9 billion in Asia and only 0.2 billion in the rest of the world. Africa's share of global population is projected to grow from 16% in 2015 to 25% in 2050 and 39% by 2100, while the share of Asia will fall from 60% in 2015 to 54% in 2050 and 44% in 2100.[4]:3 The strong growth of the African population will happen regardless of the rate of decrease of fertility, because of the exceptional proportion of young people already living today. For example, the UN projects that the population of Nigeria will surpass that of the United States by 2050.[4]:4 The population of the more developed regions is slated to remain mostly unchanged, at 1.2 billion, as international migrations from high-growth regions compensate the fertility deficit of richer countries.[4]:11
Growth regions
From 2017 to 2050, nine countries are (in most country population is very low but based on growth) expected to account for half of the world's projected population increase: India, Nigeria, the Democratic Republic of the Congo, Pakistan, Ethiopia, Tanzania, the United States, Uganda, and Indonesia, listed according to the expected size of their contribution to that projected population growth.[6]
From 2010 to 2015, the average world fertility was 2.5 children per woman,[1] about half the level in 1950–1955 (5 children per woman). In the medium variant, global fertility is projected to decline further to 2.2 in 2045 to 2050 and to 2.0 in 2095-2100.[1]
Global life expectancy at birth, which is estimated to have risen from 46 years in 1950–1955 to 65 years in 2000–2005, is expected to keep rising to reach 75 years in 2045–2050. In the more developed regions, the projected increase is from 75 years today to 82 years by mid-century. Among the least developed countries, where life expectancy today is just under 50 years, it is expected to be 66 years in 2045–2050. The population of 31 countries or areas, including Ukraine, Romania, Japan and most of the successor states of the Soviet Union, is expected to be lower in 2050 than in 2005.
Projected migration to developed countries
According to the United Nations, during 2005–2050 the net number of international migrants to more developed regions is projected to be 98 million. Because deaths are projected to exceed births in the more developed regions by 73 million during 2005–2050, population growth in those regions will largely be due to international migration. In 2000–2005, net migration in 28 countries either prevented population decline or doubled at least the contribution of natural increase (births minus deaths) to population growth. These countries include Austria, Canada, Croatia, Denmark, Germany, Italy, Portugal, Qatar, Singapore, Spain, Sweden, the United Arab Emirates and the United Kingdom.[7]
By 2050 (medium variant), India will have 1.73 billion people, China 1.46 billion, Nigeria 411 million, United States 398 million, Indonesia 327 million, Pakistan 309 million, Bangladesh 265.8 million, Brazil 232 million, Democratic Republic of Congo 195.3 million, Ethiopia 188.5 million, Mexico 164 million, Philippines 157.1 million, Egypt 142 million, Russia 133 million, Tanzania 129.4 million, Vietnam 112.8 million, Japan 107 million, Uganda 101 million, Turkey 96 million, Kenya 95.5 million, Iran 93.5 million, Sudan 81 million, Germany 78 million and the United Kingdom and France 75 million. [8]
World population in 2050
.svg.png)
Asia Africa Europe Latin America Northern America Oceania
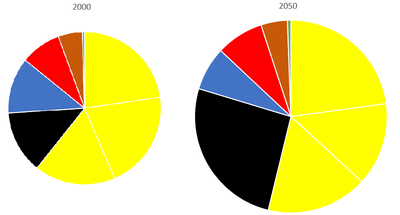
The median scenario of the UN 2017 world population prospects[1] predicts the following populations per continent in 2050 (compared to population in 2000), in billions:
| 2000 | 2050 | growth | p.a. | |
| Asia | 3.73 | 5.26 | +41% | +0.7% |
| Africa | 0.82 | 2.53 | +209% | +2.3% |
| Europe | 0.73 | 0.72 | -2% | -0.03% |
| South/Central America +Caribbean | 0.53 | 0.78 | +48% | +0.8% |
| North America | 0.31 | 0.43 | +39% | +0.7% |
| Oceania | 0.03 | 0.06 | +84% | +1.2% |
| World | 6.14 | 9.77 | +60% | +0.9% |
Walter Greiling projected in the 1950s that world population would reach a peak of about nine billion, in the 21st century, and then stop growing after a readjustment of the Third World and a sanitation of the tropics.[9]
Estimates published in the 2000s tended to predict that the population of Earth will stop increasing around 2070;[10] In a 2004 long-term prospective report, the United Nations Population Division projected the world population to peak at 9.22 billion in 2075. After reaching this maximum, it would decline slightly and then resume a slow increase, reaching a level of 8.97 billion by 2300, about the same as the projected 2050 figure.[5]:1
This prediction was revised in the 2010s, to the effect that no maximum will likely be reached in the 21st century.[4] The main reason for the revision was that the ongoing rapid population growth in Africa had been underestimated. A 2014 paper by demographers from several universities and the United Nations Population Division forecast that the world's population will reach about 10.9 billion in 2100 and continue growing thereafter.[11] The UN as of 2017 predicts a decline of global population growth rate from +1.0% in 2020 to +0.5% in 2050 and to +0.1% in 2100.[1]
Jørgen Randers, one of the authors of the seminal 1972 long-term simulations in The Limits to Growth, offered an alternative scenario in a 2012 book, arguing that traditional projections insufficiently take into account the downward impact of global urbanization on fertility. Randers' "most likely scenario" predicts a peak in the world population in the early 2040s at about 8.1 billion people, followed by decline.[12]
These projected growth patterns depend on assumptions about vital rates. Total fertility is assumed to continue to decline, at varying paces depending on circumstances in individual countries, to a below-replacement level of 1.85 children per woman by mid century. Countries already at this level or below, and other countries when they reach it, will eventually return to replacement over a period of a century and stay at replacement going forward. All countries are projected to have reached replacement fertility by 2175.
Some of the authors of the 2004 UN report say that life expectancy is assumed to rise slowly and continuously. The projections in the report assume this with no upper limit, though at a slowing pace depending on circumstances in individual countries. By 2100, the report assumed life expectancy to be from 66 to 97 years, and by 2300 from 87 to 106 years, depending on the country. Based on that assumption, they said that rising life expectancy will produce small but continuing population growth by the end of the projections, ranging from 0.03 to 0.07 percent annually. The hypothetical feasibility (and wide availability) of life extension by technological means would further exacerbate the overpopulation problem.[13][14][15]
Most populous nations by 2030
The UN Population Division has calculated the future population of the world's countries, based on current demographic trends. The 2015 study projects the world population in 2030 to be 8.5 billion people, with the following estimates for the top 10 countries:[4]:18
| 2030 rank (projected) |
2015 rank | Rank change | Country | 2030 population (projected) |
2015 population | Population change |
|---|---|---|---|---|---|---|
| 1 | 2 | +1 | 1,527,657,988 | 1,311,051,000 | +16.5% | |
| 2 | 1 | −1 | 1,441,181,813 | 1,376,049,000 | +2.9% | |
| 3 | 3 | 359,402,000 | 321,774,000 | +10.6% | ||
| 4 | 4 | 295,482,000 | 257,564,000 | +14.8% | ||
| 5 | 7 | +2 | 264,067,527 | 182,202,000 | +39.2% | |
| 6 | 5 | −1 | 228,663,000 | 207,848,000 | +10.1% | |
| 7 | 6 | −1 | 224,916,000 | 198,925,000 | +13.0% | |
| 8 | 8 | 186,460,000 | 160,996,000 | +15.9% | ||
| 9 | 11 | +2 | 148,133,000 | 127,017,000 | +16.7% | |
| 10 | 9 | −1 | 138,652,000 | 143,457,000 | −3.3% | |
| World (demographics) | 8,500,766,000 | 7,349,472,000 | +15.7% |
![]()
After 2050
Projections for after 2050 have usually assumed that fertility rates will have declined by then and the population will be stable or will decrease. However, a study in 2014 found that fertility rates in Africa have leveled off at around 4.6 instead of continuing to decline, and that consequently world population may be as high as 12 billion by 2100. Reasons for the continuing high birth rate include better survival rates with respect to HIV, and contraception shortage.[16][17] Another study, on the other hand, concludes that education of women will lead to low fertility rates even in Africa.[16] Evolutionary biology also suggests the demographic transition may reverse itself; in addition, recent evidence suggests birth rates may be rising in the 21st century in the developed world.[18]
UN projections published in 2017 estimate the world population in 2100 to be 11.2 billion.[1]
Population projections of the 101 largest cities in the 21st century
Large urban areas are hubs of economic development and innovation, with larger cities underpinning regional economies and local and global sustainability initiatives. Currently, 757 million humans live in the 101 largest cities;[19] these cities are home to 11% of the world’s population.[19] By the end of the century, the world population is projected to grow, with estimates ranging from 6.9 billion to 13.1 billion;[19] the percentage of people living in the 101 larger cities is estimated to be 15% to 23%.[19]
The following 101 cities with the largest population projections for the years 2025, 2050, 2075, and 2100 are listed below.[19]
See also
References
- 1 2 3 4 5 6 7 8 9 10 "World Population Prospects - Population Division - United Nations". esa.un.org. Retrieved 2017-11-29.
- ↑ "World Population Forecast". Worldometers. Retrieved 26 June 2016.
- ↑ He, Wan; Goodkind, Daniel; Kowal, Paul (March 2016). "An Aging World: 2015 – International Population Reports" (PDF). United States Census Bureau. Retrieved 26 June 2016.
- 1 2 3 4 5 6 7 "World Population Prospects: The 2016 Revision – Key Findings and Advance Tables" (PDF). United Nations Department of Economic and Social Affairs, Population Division. July 2016. Retrieved 26 June 2017.
- 1 2 "World Population to 2300" (PDF). United Nations Department of Economic and Social Affairs, Population Division. 2004.
- ↑ https://www.un.org/development/desa/en/news/population/world-population-prospects-2017.html
- ↑ https://www.un.org/News/Press/docs/2005/pop918.doc.html
- ↑ http://www.photius.com/rankings/world2050_rank.html
- ↑ Walter Greiling: Wie werden wir leben? ("How are we going to live?") Econ publishers, Munich 1954
- ↑ Ciro Pabón y Ciro Pabón, Manual de Urbanismo, Editorial Leyer, Bogotá, 2007, ISBN 978-958-711-296-2
- ↑ Gerland, P.; Raftery, A. E.; Ev Ikova, H.; Li, N.; Gu, D.; Spoorenberg, T.; Alkema, L.; Fosdick, B. K.; Chunn, J.; Lalic, N.; Bay, G.; Buettner, T.; Heilig, G. K.; Wilmoth, J. (September 14, 2014). "World population stabilization unlikely this century". Science. AAAS. 346 (6206): 234–7. doi:10.1126/science.1257469. ISSN 1095-9203. PMC 4230924. PMID 25301627. Retrieved September 21, 2014.
- ↑ Randers, Jørgen (2012). 2052: A Global Forecast for the Next Forty Years. Vermont: Chelsea Green Publishing. p. 62.
- ↑ Newmark, PA; Sánchez Alvarado, A (2002). "Not your father's planarian: a classic model enters the era of functional genomics". Nat Rev Genet. 3: 210–219. doi:10.1038/nrg759. PMID 11972158.
- ↑ Bavestrello, Giorgio; Sommer, Christian; Sarà, Michele (1992). "Bi-directional conversion in Turritopsis nutricula (Hydrozoa)". Scientia Marina. 56 (2–3): 137–140.
- ↑ Martínez, DE (1998). "Mortality patterns suggest lack of senescence in hydra". Exp Gerontol. 33 (3): 217–225. doi:10.1016/S0531-5565(97)00113-7. PMID 9615920. In an essay within the 2004 U.N. report, Tim Dyson said: "A rapid increase in life expectancy, which would raise the population pyramids, seems within reach, since it responds to an old and powerful demand for longevity."
- 1 2 Andy Coghlan (27 Sep 2014). "Global population may boom well beyond the year 2050". New Scientist: 11.
- ↑ Patrick Gerland, Adrian Raftery; et al. (18 Sep 2014). "World population stabilization unlikely this century". Science. 346: 234–7. doi:10.1126/science.1257469. PMC 4230924. PMID 25301627.
- ↑ Can we be sure the world's population will stop rising?, BBC News, 13 October 2012
- 1 2 3 4 5 Hoornweg, Daniel; Pope, Kevin (January 2014). "Population predictions of the 101 largest cities in the 21st century" (PDF). Global Cities Institute (Working Paper No. 4).