North Canberra
| North Canberra Canberra, Australian Capital Territory | |||||||||||||||
|---|---|---|---|---|---|---|---|---|---|---|---|---|---|---|---|
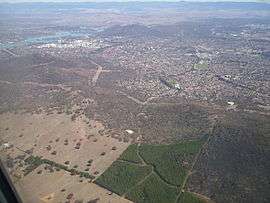 Aerial view of North Canberra shown from the east | |||||||||||||||
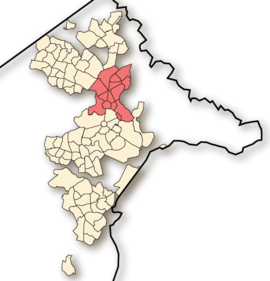 Location of Canberra North, shaded. | |||||||||||||||
| Coordinates | 35°16′54″S 149°07′44″E / 35.2817°S 149.129°ECoordinates: 35°16′54″S 149°07′44″E / 35.2817°S 149.129°E | ||||||||||||||
| Population | 53,002 (2016 census)[1] | ||||||||||||||
| • Density | 1,405.9/km2 (3,641/sq mi) | ||||||||||||||
| Postcode(s) | 2601, 2602, 2612 | ||||||||||||||
| Area | 37.7 km2 (14.6 sq mi) | ||||||||||||||
| Territory electorate(s) | Kurrajong | ||||||||||||||
| Federal Division(s) | |||||||||||||||
| |||||||||||||||
North Canberra, also known as the Inner North, is a district of Canberra, the capital city of Australia, comprising 14 suburbs. At the 2016 census, it had 21,555 dwellings housing 53,002 people[1] of the 397,397 people in the Australian Capital Territory.[2] Many of Canberra's oldest dwellings are in this district.
North Canberra is located to the north and east of Canberra's City, to the north of Lake Burley Griffin and west of Mount Majura and south of Mount Ainslie, and is bounded to the north by the Barton Highway and Federal Highway.
It is one of the oldest parts of Canberra, and is built in part in accordance to Walter Burley Griffin's designs.
Places of Note and Interest
- Civic is the major shopping and office precinct in Canberra.
- Russell has the main headquarters of the Australian Defence Force.
- The Australian National University has its campus in the suburb of Acton and the Australian Defence Force Academy and Royal Military College, Duntroon are in the suburb of Campbell.
- The Australian War Memorial is also located in Campbell.
Demographics
At the 2016 census, North Canberra had a population of 53,002 of which 49.9% were male and 50.1% were female. Aboriginal and Torres Strait Islander people made up 1.1 per cent of the population, which was lower than the national and territory averages. The median age of people in North Canberra was 31 years, which was lower than the national median of 38 years. Children aged 0–14 years made up 12.4 per cent of the population and people aged 65 years and over made up 11.1 per cent of the population. Of people in the area aged 15 years and over, 32.8 per cent were married and 9.0 per cent were either divorced or separated.[2]
Population growth in North Canberra between the 2001 census and the 2006 census was 6.8 per cent; in the five years to the 2011 census, the population grew by 14.1 per cent; and in the five years to the 2016 census, the population grew by 10.4 per cent. When compared with total population growth of Australia for the same periods, being 5.78 per cent, 8.32 per cent and 8.88 respectively, population growth in North Canberra was faster than the national average.[3][4][5][2] The median weekly income for residents within North Canberra was significantly higher than the national average, and slightly below the territory average.[2]
| Selected historical census data for North Canberra | ||||||
|---|---|---|---|---|---|---|
| Census year | 2001[3] | 2006[4] | 2011[5] | 2016[2] | ||
| Population | Estimated residents on census night | 39,438 | 42,113 | 48,030 | 53,002 | |
| Percentage of the Australian Capital Territory population | 12.8% | |||||
| Percentage of the Australian population | 0.21% | |||||
| Birthplace and language diversity | ||||||
| Birthplace, top responses | Australia | 68.9% | ||||
| China | n/a | |||||
| England | 4.7% | |||||
| India | n/a | n/a | ||||
| New Zealand | 1.6% | |||||
| United States | 0.9% | n/a | n/a | 1.1% | ||
| Language, top responses (other than English) | Mandarin | 1.1% | ||||
| Vietnamese | 0.9% | |||||
| Cantonese | n/a | |||||
| Spanish | n/a | n/a | n/a | |||
| Korean | n/a | n/a | n/a | |||
| Religious affiliation | ||||||
| Religious affiliation, top responses | No Religion | 26.7% | ||||
| Catholic | 23.1% | |||||
| Anglican | 15.0% | |||||
| Buddhism | 2.6% | |||||
| Median weekly incomes | ||||||
| Personal income | Median weekly personal income | A$647 | A$853 | A$925 | ||
| Percentage of Australian median income | 138.8% | |||||
| Family income | Median weekly family income | A$1,810 | A$2,432 | A$2,645 | ||
| Percentage of Australian median income | 154.6% | |||||
| Household income | Median weekly household income | A$1,332 | A$1,819 | A$1,981 | ||
| Percentage of Australian median income | 129.7% | |||||
| Dwelling structure | ||||||
| Type | Separate house | 61.0% | ||||
| Semi-detached, row or terrace house, townhouse etc. | 13.5% | |||||
| Flat, unit or apartment | 23.7% | |||||
References
- 1 2 Australian Bureau of Statistics (27 June 2017). "North Canberra (Statistical Subdivision)". 2016 Census QuickStats. Retrieved 28 June 2017.

- 1 2 3 4 5 Australian Bureau of Statistics (27 June 2017). "North Canberra (SA3)". 2016 Census QuickStats. Retrieved 4 July 2017.
- 1 2 Australian Bureau of Statistics (9 March 2006). "North Canberra (SSD)". 2001 Census QuickStats. Retrieved 4 July 2017.
- 1 2 Australian Bureau of Statistics (25 October 2007). "North Canberra (SSD)". 2006 Census QuickStats. Retrieved 4 July 2017.
- 1 2 Australian Bureau of Statistics (31 October 2012). "North Canberra (SA3)". 2011 Census QuickStats. Retrieved 4 July 2017.
External links
- Canberra region map - all districts