Montana's at-large congressional district
| Montana's At-large congressional district | |
|---|---|
 | |
| Current Representative | Greg Gianforte (R–Bozeman) |
| Distribution |
|
| Population (2014[1]) | 1,023,579 |
| Median income | 33,024 |
| Ethnicity |
|
| Cook PVI | R+11[2] |
Montana is represented in the US House of Representatives by one at-large congressional district, among the 435 in the U.S. Congress. The district is the largest U.S. congressional district by population, with just over 1 million constituents. It is also the second-largest by land area, after Alaska's at-large congressional district.
Since June 2017, the district has been represented by Republican Greg Gianforte. Gianforte won a special election earlier in 2017 to replace Ryan Zinke, who had resigned to become Secretary of the Interior.
Politics
President George W. Bush won Montana in the 2004 Presidential election with 59.1% of the vote, beating John Kerry by 20 percentage points, which indicates that the district leans Republican. However, four years later John McCain won the state by only 2.5% over Barack Obama, and there is a significant Democratic presence in the state: as of 2017 the Governor's office and one U.S. Senate seat are controlled by the Democrats, which suggested at the time that the district could be competitive in future elections. In 2016, Donald Trump won by over 20%, while Ryan Zinke won Montana's single congressional seat by over 16%. The seat was left vacant when Zinke was appointed Secretary of the Interior. In a special election held on May 25, 2017, Republican Greg Gianforte won with a margin of 6%.[3]
Early at-large district
From statehood in 1889, until the creation of geographic districts in 1919, Montana was represented in the United States House of Representatives by members elected at-large. From 1913 to 1919, in fact, there were two seats, still elected at-large. In the reapportionment following the 1990 census Montana lost one of its two seats, and its remaining member was again elected at-large.
Recent voting history
Election results from presidential races are shown below.
| Year | Results |
|---|---|
| 2000 | Bush 58–33% |
| 2004 | Bush 59–38% |
| 2008 | McCain 50–47% |
| 2012 | Romney 55–41% |
| 2016 | Trump 56–35% |
List of representatives
1889–1919: One, then two seats
| Cong ress |
Years | Seat A | Seat B | |||||
|---|---|---|---|---|---|---|---|---|
| Representative | Party | Electoral history | Representative | Party | Electoral history | |||
| 51 | March 4, 1889 – November 8, 1889 |
Seat created upon statehood | A second seat was added in 1913. | |||||
| November 8, 1889 – March 3, 1891 |
 |
Republican | Elected in 1889. | |||||
| 52 | March 4, 1891 – March 3, 1893 |
 |
Democratic | Elected in 1890. | ||||
| 53 | March 4, 1893 – March 3, 1895 |
.jpg) |
Republican | Elected in 1892. | ||||
| 54 | March 4, 1895 – March 3, 1897 |
Re-Elected in 1894. | ||||||
| 55 | March 4, 1897 – March 3, 1899 |
Silver Republican |
Re-Elected in 1896. | |||||
| 56 | March 4, 1899 – March 3, 1901 |
.jpg) |
Democratic | Elected in 1898. | ||||
| 57 | March 4, 1901 – March 3, 1903 |
.jpg) |
Populist | Elected in 1900. | ||||
| 58 | March 4, 1903 – March 3, 1905 |
 |
Republican | Elected in 1902. | ||||
| 59 | March 4, 1905 – March 3, 1907 |
Re-Elected in 1904. | ||||||
| 60 | March 4, 1907 – March 3, 1909 |
 |
Republican | Elected in 1906. | ||||
| 61 | March 4, 1909 – March 3, 1911 |
Re-Elected in 1908. | ||||||
| 62 | March 4, 1911 – March 3, 1913 |
Re-Elected in 1910. | ||||||
| 63 | March 4, 1913 – March 3, 1915 |
 |
Democratic | Elected in 1912. |  |
Democratic | Elected in 1912. | |
| 64 | March 4, 1915 – March 3, 1917 |
Re-elected in 1914. | Re-elected in 1914. Retired. | |||||
| 65 | March 4, 1917 – March 3, 1919 |
Re-elected in 1916. Redistricted to the 1st district. |
 |
Republican | Elected in 1916. Retired to run for U.S. Senate. | |||
The two at-large seats were moved to district representation in 1919, and remained until 1993, when Montana lost a seat due to redistricting from the 1990 US Census, re-establishing the single seat at-large district.
1993–present: One seat
| Cong ress |
Representative | Party | Years | Electoral history |
|---|---|---|---|---|
| District re-established | January 3, 1993 | |||
| 103 104 |
 |
Democratic | January 3, 1993 – January 3, 1997 |
Redistricted from the 1st district, and re-elected in 1992. Re-elected in 1994. Retired. |
| 105 106 |
 |
Republican | January 3, 1997 – January 3, 2001 |
Elected in 1996. Re-elected in 1998. Retired. |
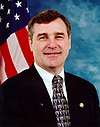
| 107 108 109 110 111 112 |
 |
Republican | January 3, 2001 – January 3, 2013 |
Elected in 2000. Re-elected in 2002. Re-elected in 2004. Re-elected in 2006. Re-elected in 2008. Re-elected in 2010. Retired to run for U.S. Senate. |
| 113 |  |
Republican | January 3, 2013 – January 3, 2015 |
Elected in 2012. Elected to the U.S. Senate. |
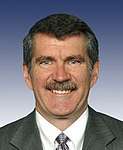
| 114 115 |
.jpg) |
Republican | January 3, 2015 – March 1, 2017 |
Elected in 2014. Re-elected in 2016. Resigned to become U.S. Secretary of the Interior. |
| 115 | Vacant | March 1, 2017 – June 21, 2017 | ||
| 115 |  |
Republican | June 21, 2017 – present |
Elected to finish Zinke's term. |
Recent election results
The following are official results from the general elections.[5]
| Party | Candidate | Votes | % | ± | |
|---|---|---|---|---|---|
| Republican | Rick Hill | 175,748 | 53.01% | ||
| Democratic | Dusty Deschamps | 147,073 | 44.36% | ||
| Libertarian | Mike Fellows | 5,652 | 1.70% | ||
| Reform | Webb Sullivan | 3,078 | 0.93% | ||
| Majority | 28,675 | 8.65% | |||
| Turnout | 338,733 | 52.99% | |||
| Republican hold | Swing | ||||
| Party | Candidate | Votes | % | ± | |
|---|---|---|---|---|---|
| Republican | Denny Rehberg | 211,418 | 51.50% | −1.51 | |
| Democratic | Nancy Keenan | 189,971 | 46.28% | +1.92 | |
| Libertarian | James Tikalsky | 9,132 | 2.22% | +0.52 | |
| Majority | 21,447 | 5.22% | −3.43 | ||
| Turnout | 417,916 | 59.85% | +6.86 | ||
| Republican hold | Swing | ||||
| Party | Candidate | Votes | % | ± | |
|---|---|---|---|---|---|
| Republican | Denny Rehberg | 214,100 | 64.62% | +13.12 | |
| Democratic | Steve Kelly | 108,233 | 32.67% | −13.61 | |
| Libertarian | Mike Fellows | 8,988 | 2.71% | +0.49 | |
| Majority | 105,867 | 31.95% | +26.73 | ||
| Turnout | 340,272 | 54.48% | −5.37 | ||
| Republican hold | Swing | ||||
| Party | Candidate | Votes | % | ± | |
|---|---|---|---|---|---|
| Republican | Denny Rehberg | 286,076 | 64.40% | −0.22 | |
| Democratic | Tracy Velazquez | 145,606 | 32.78% | +0.11 | |
| Libertarian | Mike Fellows | 12,548 | 2.82% | +0.11 | |
| Majority | 140,470 | 31.62% | −0.33 | ||
| Turnout | 456,096 | 71.44% | +16.96 | ||
| Republican hold | Swing | ||||
| Party | Candidate | Votes | % | ± | |
|---|---|---|---|---|---|
| Republican | Denny Rehberg | 239,124 | 58.88% | −5.52 | |
| Democratic | Monica Lindeen | 158,916 | 39.13% | +6.35 | |
| Libertarian | Mike Fellows | 8,085 | 1.99% | −0.83 | |
| Majority | 80,208 | 19.75% | −11.87 | ||
| Turnout | 411,061 | 63.30% | −8.14 | ||
| Republican hold | Swing | ||||
| Party | Candidate | Votes | % | ± | |
|---|---|---|---|---|---|
| Republican | Denny Rehberg | 308,470 | 64.14% | +5.26 | |
| Democratic | John Driscoll | 155,930 | 32.42% | −6.71 | |
| Libertarian | Mike Fellows | 16,500 | 3.43% | +1.44 | |
| Majority | 152,540 | 31.72% | +11.97 | ||
| Turnout | 497,599 | 74.48% | +11.18 | ||
| Republican hold | Swing | ||||
| Party | Candidate | Votes | % | ± | |
|---|---|---|---|---|---|
| Republican | Denny Rehberg | 217,696 | 60.41% | −3.73 | |
| Democratic | Dennis McDonald | 121,954 | 33.84% | +1.42 | |
| Libertarian | Mike Fellows | 20,691 | 5.74% | +2.31 | |
| Majority | 95,742 | 26.57% | −5.15 | ||
| Turnout | 367,096 | 56.36% | −18.12 | ||
| Republican hold | Swing | ||||
| Party | Candidate | Votes | % | ± | |
|---|---|---|---|---|---|
| Republican | Steve Daines | 255,468 | 53.25% | −7.16 | |
| Democratic | Kim Gillan | 204,939 | 42.72% | +8.88 | |
| Libertarian | David Kaiser | 19,333 | 4.03% | −1.71 | |
| Majority | 50,529 | 10.53% | −16.04 | ||
| Turnout | 491,966 | 72.18% | +15.82 | ||
| Republican hold | Swing | ||||
| Party | Candidate | Votes | % | ± | |
|---|---|---|---|---|---|
| Republican | Ryan Zinke | 201,436 | 55.47% | +2.22 | |
| Democratic | John Lewis | 146,474 | 40.34% | −2.38 | |
| Libertarian | Mike Fellows | 15,105 | 4.16% | +0.13 | |
| Majority | 54,962 | 15.13% | +4.6 | ||
| Turnout | 369,047 | 54.73% | −17.45 | ||
| Republican hold | Swing | ||||
| Party | Candidate | Votes | % | ± | |
|---|---|---|---|---|---|
| Republican | Ryan Zinke | 285,358 | 56.19% | +0.72 | |
| Democratic | Denise Juneau | 205,919 | 40.55% | +0.21 | |
| Libertarian | Rick Breckenridge | 16,554 | 3.26% | −0.90 | |
| Majority | 79,439 | 15.64% | +0.51 | ||
| Turnout | 516,901 | 74.44% | +19.71 | ||
| Republican hold | Swing | ||||
| Party | Candidate | Votes | % | ± | |
|---|---|---|---|---|---|
| Republican | Greg Gianforte | 189,473 | 50.19% | −6.00 | |
| Democratic | Rob Quist | 166,483 | 44.11% | +3.46 | |
| Libertarian | Mark L Wicks | 21,509 | 5.70% | +2.44 | |
| Majority | 22,990 | 6.10% | −7.54% | ||
| Turnout | 377,465 | 54.22% | −20.22% | ||
| Republican hold | Swing | ||||
Notes
- ↑ "Annual Estimates of the Resident Population: April 1, 2010 to July 1, 2014". American FactFinder. U.S. Census Bureau. Retrieved January 30, 2015.
- ↑ "Partisan Voting Index – Districts of the 115th Congress" (PDF). The Cook Political Report. April 7, 2017. Retrieved April 7, 2017.
- ↑ "Election Results: Gianforte Wins U.S. House Seat in Montana". New York Times. Retrieved May 26, 2017.
- ↑ "Montana". Official Congressional Directory: 65th Congress. Washington DC: Government Printing Office. 1917.
- ↑ "Archived Official Election Results". Montana Secretary of State. State of Montana. Retrieved November 7, 2014.
- ↑ "Official General Election Results". Montana Secretary of State. State of Montana. Archived from the original on October 21, 2014. Retrieved November 7, 2014.
- ↑ "2016 General Election". Montana Secretary of State. Retrieved December 9, 2016.
- ↑ "2017 Special Election (unofficial results)". Montana Secretary of State. Retrieved May 26, 2017.
References
- 2004 Election results for Montana At Large Congressional district
- Martis, Kenneth C. (1989). The Historical Atlas of Political Parties in the United States Congress. New York: Macmillan Publishing Company.
- Martis, Kenneth C. (1982). The Historical Atlas of United States Congressional Districts. New York: Macmillan Publishing Company.
- Congressional Biographical Directory of the United States 1774–present