List of Test cricket records
Test cricket is played between international cricket teams who are Full Members of the International Cricket Council (ICC).[1] Unlike One Day Internationals, Test matches consist of two innings per team, with no limit in the number of overs.[2] Test cricket is first-class cricket, so statistics and records set in Test matches are also counted toward first-class records. The duration of Tests, currently limited to five days, has varied through Test history, ranging from three days to timeless matches.[3][4] The earliest match now recognised as a Test was played between England and Australia in March 1877;[5] since then there have been over 2,000 Tests played by 13 teams. The frequency of Tests has steadily increased partly because of the increase in the number of Test-playing countries, and partly as cricket boards seek to maximise their revenue.[6]
Cricket is, by its nature, capable of generating large numbers of records and statistics.[7] This list details the most significant team and individual records in Test cricket.
As of August 2018, the most successful team in Test cricket, in terms of both wins and win percentage, is Australia, having won 383 of their 812 Tests (47.16%). Excluding teams who have only played a single Test (the ICC World XI, a rest of world team who played a single Test against Australia in 2005, and recent Test newcomers Ireland and Afghanistan) the least successful team are Bangladesh who have struggled since their introduction to Test cricket in 2000, leading to questioning of their Test status.[8][9][10]
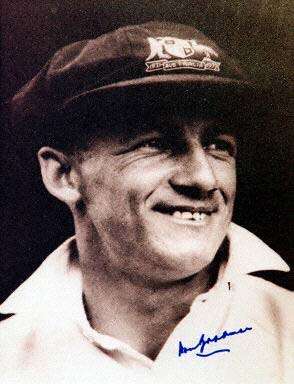
Australian Donald Bradman, widely considered the greatest batsman of all time,[11][12] holds several personal and partnership records. He scored the most runs in a series, has the most double centuries and was a part of the record 5th wicket partnership. His most significant record is his batting average of 99.94. One of cricket's most famous statistics,[13][14] it stands almost 40 runs higher than any other batsman's average. Don Bradman is the only player in the world to have scored 5000 runs against a single opposition: 5028 runs against England.[15]
In the Manchester Test of 1956, England spin bowler Jim Laker took 19 wickets for 90 runs (19–90) which set not only the Test record for best match figures but also the first-class one.[16] In taking 10–53 in the second innings he became the first bowler to capture all ten wickets in a Test match innings, and his analysis remains the best innings figures. Indian Leg-spinner Anil Kumble is the only other bowler to have taken 10 wickets in an innings, claiming 10–74 against Pakistan in 1999.[17] West Indies batsman Brian Lara has the highest individual score in Test cricket: he scored 400 not out against England in 2004 to surpass the innings of 380 by Matthew Hayden six months earlier. Lara had held the record before Hayden, with a score of 375 against England 10 years earlier.[18] Pakistan's Misbah-ul-Haq holds the record of the fastest test half century scoring 50 runs from 21 balls. The record for the fastest test century is held by New Zealand's Brendon McCullum who scored 100 runs from 54 balls in his final test match.
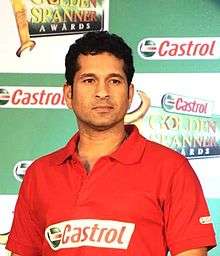
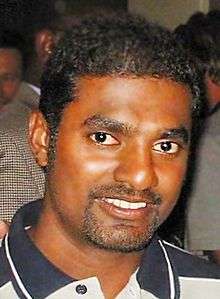
The trend of countries to increase the number of Test matches they play means that the aggregate lists are dominated by modern players. Sri Lankan spinner Muttiah Muralitharan became the highest Test wicket-taker in December 2007, when he passed Shane Warne's total of 708 wickets.[19] Within a year, the equivalent batting record of highest run-scorer had also changed hands: Sachin Tendulkar surpassed the tally of 11,953 runs by Brian Lara.[20] The record for most dismissals by a wicket-keeper is held by Mark Boucher of South Africa[21] while the record for most catches by a fielder is held by Rahul Dravid.[22]
Listing criteria
In general the top five are listed in each category (except when there is a tie for the last place among the five, when all the tied record holders are noted).
Listing notation
- Team notation
- (300–3) indicates that a team scored 300 runs for three wickets and the innings was closed, either due to a successful run chase or if no playing time remained
- (300–3 d) indicates that a team scored 300 runs for three wickets, and declared its innings closed
- (300) indicates that a team scored 300 runs and was all out
- Batting notation
- (100) indicates that a batsman scored 100 runs and was out
- (100*) indicates that a batsman scored 100 runs and was not out
- Bowling notation
- (5–100) indicates that a bowler has captured 5 wickets while conceding 100 runs
- Currently playing

- Seasons
- Cricket is played during the summer months in most countries. Domestic cricket seasons in Australia, New Zealand, South Africa, India, Pakistan, Sri Lanka, Bangladesh, Zimbabwe and the West Indies may therefore span two calendar years, and are by convention said to be played in (e.g.) "2008–09". A cricket season in England is described as a single year. e.g. "2009". An international Test series may be for a much shorter duration, and Cricinfo treats this issue by stating "any series or matches which began between May and September of any given year will appear in the relevant single year season and any that began between October and April will appear in the relevant cross-year season".[23] In the record tables, a two-year span generally indicates that the record was set within a domestic season in one of the above named countries.
Team records
Team wins, losses and draws
| Team | First Test match | Matches | Won | Lost | Tied | Drawn | % Won | |
|---|---|---|---|---|---|---|---|---|
| 14 June 2018 | 1 | 0 | 1 | 0 | 0 | 0.00 | ||
| 15 March 1877 | 812 | 383 | 219 | 2 | 208 | 47.16 | ||
| 10 November 2000 | 108 | 10 | 82 | 0 | 16 | 9.25 | ||
| 15 March 1877 | 1004 | 361 | 298 | 0 | 345 | 35.95 | ||
| 25 June 1932 | 527 | 146 | 164 | 1 | 216 | 27.70 | ||
| 11 May 2018 | 1 | 0 | 1 | 0 | 0 | 0.00 | ||
| 10 January 1930 | 426 | 92 | 170 | 0 | 164 | 21.59 | ||
| 16 October 1952 | 415 | 134 | 123 | 0 | 158 | 32.28 | ||
| 12 March 1889 | 427 | 161 | 142 | 0 | 124 | 37.70 | ||
| 17 February 1982 | 274 | 88 | 101 | 0 | 84 | 32.11 | ||
| 23 June 1928 | 535 | 171 | 188 | 1 | 174 | 31.96 | ||
| 18 October 1992 | 105 | 11 | 67 | 0 | 27 | 10.47 | ||
| ICC World XI | 14 October 2005 | 1 | 0 | 1 | 0 | 0 | 0.00 | |
|
Last updated: 11 September 2018[24] | ||||||||
Result records
Greatest win margins (by innings)
| Margin | Teams | Venue | Season |
|---|---|---|---|
| Innings and 579 runs | The Oval, London | 1938 | |
| Innings and 360 runs | New Wanderers Stadium, Johannesburg | 2001–02 | |
| Innings and 336 runs | Eden Gardens, Kolkata | 1958–59 | |
| Innings and 332 runs | Brisbane Cricket Ground | 1946–47 | |
| Innings and 324 runs | Gaddafi Stadium, Lahore | 2002 | |
|
Last updated: 12 December 2016[25] | |||
Greatest win margin (by runs)
| Margin | Teams | Venue | Season |
|---|---|---|---|
| 675 runs | Brisbane Exhibition Ground | 1928–29 | |
| 562 runs | The Oval, London | 1934 | |
| 530 runs | Melbourne Cricket Ground | 1910–11 | |
| 492 runs | Wanderers Stadium, Johannesburg | 2018 | |
| 491 runs | WACA Ground, Perth | 2004–05 | |
|
Last updated: 3 April 2018[26] | |||
Matches that finished with scores level
| Result | Teams | Venue | Season |
|---|---|---|---|
| Tie | The Gabba | 1960–61 | |
| Tie | MA Chidambaram Stadium, Madras | 1986–87 | |
| Draw | Queens Sports Club, Bulawayo | 1996–97 | |
| Draw | Wankhede Stadium, Mumbai | 2011–12 | |
Narrowest win margin (by wickets)
| Margin | Teams | Venue | Season |
|---|---|---|---|
| 1 wicket | The Oval, London | 1902 | |
| Old Wanderers, Johannesburg | 1905–06 | ||
| Melbourne Cricket Ground | 1907–08 | ||
| Newlands Cricket Ground, Cape Town | 1922–23 | ||
| Melbourne Cricket Ground | 1951–52 | ||
| Carisbrook, Dunedin | 1979–80 | ||
| National Stadium, Karachi | 1994–95 | ||
| Kensington Oval, Bridgetown | 1998–99 | ||
| Antigua Recreation Ground, St. John's | 1999–00 | ||
| Ibn-e-Qasim Bagh Stadium, Multan | 2003 | ||
| Paikiasothy Saravanamuttu Stadium, Colombo | 2006 | ||
| Punjab Cricket Association Stadium, Mohali | 2010–11 | ||
|
Last updated: 15 June 2016[30] | |||
Narrowest win margin (by runs)
| Margin | Teams | Venue | Season |
|---|---|---|---|
| 1 run | Adelaide Oval | 1992–93 | |
| 2 runs | Edgbaston, Birmingham | 2005 | |
| 3 runs | Old Trafford, Manchester | 1902 | |
| Melbourne Cricket Ground | 1982–83 | ||
| 5 runs | Sydney Cricket Ground | 1993–94 | |
|
Last updated: 15 June 2016[31] | |||
Victory after following-on
| Margin | Teams | Venue | Season |
|---|---|---|---|
| 10 runs | Sydney Cricket Ground | 1894–95 | |
| 18 runs | Headingley, Leeds | 1981 | |
| 171 runs | Eden Gardens, Kolkata | 2000–01 | |
|
Last updated: 15 June 2016[32] | |||
Most consecutive wins
| Wins | Team | First win | Last win |
|---|---|---|---|
| 16 | |||
| 16 | |||
| 11 | |||
| 9 | |||
| 9 | |||
|
Last updated: 15 June 2016[33] | |||
Team scoring records
| Score | Teams | Venue | Season |
| 952-6 d | Ranasinghe Premadasa Stadium, Colombo | 1997 | |
|---|---|---|---|
| 903-7 d | The Oval, London | 1938 | |
| 849 | Sabina Park, Kingston | 1929–30 | |
| 790–3 d | Sabina Park, Kingston | 1957–58 | |
| 765–6 d | National Stadium, Karachi | 2008–09 | |
|
Last updated: 14 September 2017[34] | |||
| Runs | Teams | Venue | Date |
| 26 | Eden Park, Auckland | 25 March 1955 | |
|---|---|---|---|
| 30 | St. George's Park, Port Elizabeth | 13 February 1896 | |
| Edgbaston, Birmingham | 14 June 1924 | ||
| 35 | Newlands Cricket Ground, Cape Town | 1 April 1899 | |
| 36 | Edgbaston, Birmingham | 29 May 1902 | |
| Melbourne Cricket Ground | 12 February 1932 | ||
|
Last updated: 14 September 2017[35] | |||
| Score | Teams | Venue | Season |
| 418–7 | Antigua Recreation Ground, St. John's | 2002–03 | |
|---|---|---|---|
| 414–4 | WACA Ground, Perth | 2008–09 | |
| 406–4 | Queen's Park Oval, Port of Spain | 1975–76 | |
| 404–3 | Headingley, Leeds | 1948 | |
| 391–6 | Ranasinghe Premadasa Stadium, Colombo | 2017 | |
|
Last updated: 14 September 2017[36] | |||
Individual records
Individual records (batting)
Career runs
| Runs | Player | Period |
| 15,921 (329 innings) | 1989–2013 | |
|---|---|---|
| 13,378 (287 innings) | 1995–2012 | |
| 13,289 (280 innings) | 1995–2013 | |
| 13,288 (286 innings) | 1996–2012 | |
| 12,472 (291 innings) | 2006–2018 | |
|
Last updated: 11 September 2018[37] | ||
| Runs | Player | Record held until | Duration of record |
| 239 | 4 January 1882 | 4 years, 295 days | |
|---|---|---|---|
| 676 | 13 August 1884 | 2 years, 222 days | |
| 860 | 14 August 1886 | 2 years, 1 day | |
| 1,277 | 23 January 1902 | 15 years, 162 days | |
| 1,293 | 18 February 1902 | 26 days | |
| 1,366 | 14 June 1902 | 116 days | |
| 1,531 | 13 August 1902 | 60 days | |
| 3,412 | 27 December 1924 | 22 years, 136 days | |
| 5,410 | 29 June 1937 | 12 years, 184 days | |
| 7,249 | 27 November 1970 | 33 years, 151 days | |
| 7,459 | 23 March 1972 | 1 year, 117 days | |
| 8,032 | 23 December 1981 | 9 years, 275 days | |
| 8,114 | 12 November 1983 | 1 year, 324 days | |
| 10,122 | 25 February 1993 | 9 years, 105 days | |
| 11,174 | 25 November 2005 | 12 years, 273 days | |
| 11,953 | 17 October 2008 | 2 years, 327 days | |
| 15,921 | current | 9 years, 363 days | |
|
Last updated: 15 June 2016[38] Notes: | |||
Most runs in each batting position
| Batting position | Player | Runs | Average | ||
|---|---|---|---|---|---|
| Opener | 11845 | 44.87 | |||
| Number 3 | 11679 | 60.83 | |||
| Number 4 | 13492 | 54.40 | |||
| Number 5 | 6883 | 56.42 | |||
| Number 6 | 3165 | 51.05 | |||
| Number 7 | 3948 | 46.45 | |||
| Number 8 | 2227 | 39.77 | |||
| Number 9 | 1292 | 20.51 | |||
| Number 10 | 547 | 13.34 | |||
| Number 11 | 623 | 11.33 | |||
|
Last updated: 11 September 2018[39] | |||||
Highest career batting average
| Average | Player | Period |
| 99.94 (80 innings) | 1928–1948 | |
|---|---|---|
| 61.87 (31 innings) | 2015–2016 | |
| 61.37 (117 innings) | 2010– | |
| 60.97 (41 innings) | 1963–1970 | |
| 60.83 (40 innings) | 1930–1954 | |
| 60.73 (84 innings) | 1924–1935 | |
|
Qualification: 20 innings. Note: If the qualification is removed, the record Test batting average is Last updated: 5 September 2018[43] | ||
Innings or series
| Score | Player | Opponent | Venue | Season |
| 400* | Antigua Recreation Ground, St. John's | 2003–04 | ||
|---|---|---|---|---|
| 380 | WACA Ground, Perth | 2003–04 | ||
| 375 | Antigua Recreation Ground, St. John's | 1993–94 | ||
| 374 | Sinhalese Sports Club Ground, Colombo | 2006 | ||
| 365* | Sabina Park, Kingston | 1957–58 | ||
|
Last updated: 15 June 2015[44] | ||||
| Score | Player | Opponent | Venue | Season | Test match Number |
| 165* | Melbourne Cricket Ground | 1876–77 | Test No. 1 | ||
|---|---|---|---|---|---|
| 211 | The Oval, London | 1884 | Test No. 16 | ||
| 287 | Sydney Cricket Ground | 1903–04 | Test No. 78 | ||
| 325 | Sabina Park, Kingston | 1929–30 | Test No. 193 | ||
| 334 | Headingley, Leeds | 1930 | Test No. 196 | ||
| 336* | Eden Park, Auckland | 1932–33 | Test No. 226 | ||
| 364 | The Oval, London | 1938 | Test No. 266 | ||
| 365* | Sabina Park, Kingston | 1957–58 | Test No. 452 | ||
| 375 | Antigua Recreation Ground, St. John's | 1993–94 | Test No. 1259 | ||
| 380 | WACA Ground, Perth | 2003–04 | Test No. 1661 | ||
| 400* | Antigua Recreation Ground, St. John's | 2003–04 | Test No. 1696 | ||
|
Last updated: 15 June 2016[45] | |||||
| Runs | Scores | Player | Match |
| 456 | 333 and 123 | v | |
|---|---|---|---|
| 426 | 334* and 92 | v | |
| 424 | 319 and 105 | v | |
| 400 | 400* | v | |
| 380 | 247* and 133 | v | |
| 380 | v | ||
|
Last updated: 15 June 2016[46] | |||
| Runs | Player | Series |
| 974 (7 innings) | v | |
|---|---|---|
| 905 (9 innings) | v | |
| 839 (11 innings) | v | |
| 834 (9 innings) | v | |
| 829 (7 innings) | v | |
|
Last updated: 15 June 2016[47] | ||
Calendar year and between dismissals
| Runs | Player | Average | Year | |
| 1788 | 99.33 | 2006 | ||
|---|---|---|---|---|
| 1710 | 90.00 | 1976 | ||
| 1656 | 72.00 | 2008 | ||
| 1595 | 106.33 | 2012 | ||
| 1562 | 78.10 | 2010 | ||
|
Last updated: 15 June 2015[48] | ||||
| Runs | Player | Innings | Scores | Season |
| 614 | 3 | 269*, 106*, 239 | 2015-16 | |
|---|---|---|---|---|
| 497 | 4 | 241*, 60*, 194*, 2 | 2003-04 | |
| 490 | 2 | 365*, 125 | 1957-58 | |
| 489 | 2 | 259*, 230 | 2012-13 | |
| 473 | 4 | 41*, 200*, 70*, 162 | 2000-01 | |
Highest scores at each batting position
| Batting position | Player | Score | Opponent | Venue | Date |
|---|---|---|---|---|---|
| Opener | 380 | WACA Ground | 9 October 2003 | ||
| Number 3 | 400* | Antigua Recreation Ground | 10 April 2004 | ||
| Number 4 | 374 | Sinhalese Sports Club Ground | 27 July 2006 | ||
| Number 5 | 329* | Sydney Cricket Ground | 3 January 2012 | ||
| Number 6 | 258 | Newlands Cricket Ground | 2 January 2016 | ||
| Number 7 | 270 | Melbourne Cricket Ground | 1 January 1937 | ||
| Number 8 | 257* | Sheikhupura Stadium | 17 October 1996 | ||
| Number 9 | 173 | Eden Park | 22 February 1990 | ||
| Number 10 | 117 | Kennington Oval | 11 August 1884 | ||
| Number 11 | 98 | Trent Bridge | 10 July 2013 | ||
|
Last updated: 18 November 2017[51] | |||||
Innings as captain
| Score | Player | Opponent | Venue | Season |
| 400* | Antigua Recreation Ground, St. John's | 2003–04 | ||
|---|---|---|---|---|
| 374 | Sinhalese Sports Club Ground, Colombo | 2006 | ||
| 334* | Arbab Niaz Stadium, Peshawar | 1998 | ||
| 333 | Lord's, London | 1990 | ||
| 329* | Sydney Cricket Ground, Sydney | 2012 | ||
|
Last updated: 15 June 2015[52] | ||||
Innings carrying the bat
| Score | Player | Opponent | Venue | Season |
| 244* | Melbourne Cricket Ground, Melbourne | 2017–18 | ||
|---|---|---|---|---|
| 223* | Sabina Park, Kingston | 1972 | ||
| 216* | Queens Sports Club, Bulawayo | 1999–00 | ||
| 206* | Lord's, London | 1931 | ||
| 202* | The Oval, London | 1950 | ||
|
Last updated: 29 December 2017[53] | ||||
Most runs in an over
| Runs | Sequence | Batsman | Bowler | Venue | Season |
| 28 | 4–6–6–4–4–4 | Wanderers Stadium, Johannesburg | 2003–04 | ||
|---|---|---|---|---|---|
| 4–6–2–4–6–6 | WACA, Perth | 2013–14 | |||
| 27 | 6–6–6–6–2–1 | Gaddafi Stadium, Lahore | 2005–06 | ||
| 26 | 4–4–6–0–6–6 | Wanderers Stadium, Johannesburg | 2008–09 | ||
| 4–0–6–6–6–4 | Multan Cricket Stadium | 2006–07 | |||
| 4–4–4–4–6–4 | Seddon Park, Hamilton | 2000–01 | |||
| 4–6–6–0–4–6 | Hagley Oval, Christchurch, New Zealand | 2014–15 | |||
| 4–4–6–6–6–0 | Pallekele International Cricket Stadium,Sri Lanka | 2017 | |||
|
Last updated: 14 August 2017[54] | |||||
Centuries
| Centuries | Player | Matches | Innings | Inns/Century |
|---|---|---|---|---|
| 51 | 200 | 329 | 6.4 | |
| 45 | 166 | 280 | 6.2 | |
| 41 | 168 | 287 | 7.0 | |
| 38 | 134 | 233 | 6.1 | |
| 36 | 164 | 286 | 7.9 | |
|
Last updated: 15 June 2016[55] | ||||
| No. of balls | Player | Opponent | Venue | Season |
| 54 | Hagley Oval, Christchurch | 2015–16 | ||
|---|---|---|---|---|
| 56 | Antigua Recreation Ground, St. John's | 1985–86 | ||
| Sheikh Zayed Cricket Stadium, Abu Dhabi | 2014 | |||
| 57 | WACA Ground, Perth | 2006–07 | ||
| 67 | Old Wanderers, Johannesburg | 1921–22 | ||
|
Last updated: 15 June 2016[56] | ||||
| Double centuries | Player | Matches |
| 12 | 52 | |
|---|---|---|
| 11 | 130 | |
| 9 | 131 | |
| 7 | 85 | |
| 149 | ||
|
Last updated: 15 June 2016[57] | ||
| Triple centuries | Player | Matches |
| 2 | 52 | |
|---|---|---|
| 104 | ||
| 103 | ||
| 131 | ||
|
Last updated: 11 December 2016[58] | ||
| Note:
21 other players have scored a triple century in a Test: see List of Test cricket triple centuries for more details[59] | ||
| Quadruple centuries | Player | Matches |
| 1 | 131 | |
|---|---|---|
|
Last updated: 15 June 2016[60] | ||
Half Centuries
| 50+ | Player | Matches | Innings |
|---|---|---|---|
| 119 | 200 | 329 | |
| 103 | 166 | 280 | |
| 103 | 168 | 287 | |
| 99 | 164 | 286 | |
| 96 | 164 | 280 | |
|
Last updated: 15 June 2016[61] | |||
| No. of balls | Player | Opponent | Venue | Season |
| 21 | Sheikh Zayed Stadium, Abu Dhabi | 2014/15 | ||
|---|---|---|---|---|
| 23 | Sydney Cricket Ground | 2016/17 | ||
| 24 | Newlands Cricket Ground, Cape Town | 2004/05 | ||
| 25 | Sabina Park, Kingston | 2014 | ||
| 26 | M Chinnaswamy Stadium, Bangalore | 2004/05 | ||
| Sher-e-Bangla Cricket Stadium, Mirpur | 2007 | |||
| St. George's Park, Port Elizabeth | 2014/15 | |||
|
Last updated: 5 September 2018[62] | ||||
Most fours in career
| Fours | Player | Innings |
|---|---|---|
| 2058+ | 329 | |
| 1654 | 286 | |
| 1559 | 232 | |
| 1509 | 287 | |
| 1491 | 233 | |
|
Key: + means the complete career records aren't known Last updated: 15 February 2016[63] | ||
Individual records (bowling)
Career
| Wickets | Player | Matches | Average |
| 800 | 133 | 22.72 | |
|---|---|---|---|
| 708 | 145 | 25.41 | |
| 619 | 132 | 29.65 | |
| 564 | 143 | 26.84 | |
| 563 | 124 | 21.64 | |
|
Last updated: 11 September 2018[64] | |||
| Wickets | Player | Matches | Average | Record held until | Duration of record |
| 8[a] | 1 | 10.75 | 31 March 1877 | 16 days | |
|---|---|---|---|---|---|
| 14 | 2 | 15.35 | 4 January 1879 | 1 year, 279 days | |
| 94[b] | 18 | 18.41 | 12 January 1895 | 16 years, 8 days | |
| 100 | 25 | 13.51 | 4 February 1895 | 33 days | |
| 101 | 17 | 16.53 | 2 March 1895 | 26 days | |
| 103 | 26 | 13.92 | 21 March 1896 | 1 year, 19 days | |
| 112[c] | 18 | 10.75 | 14 January 1898 | 1 year, 299 days | |
| 118 | 33 | 17.75 | 2 January 1904 | 5 years, 353 days | |
| 141 | 32 | 21.78 | 13 December 1913 | 9 years, 345 days | |
| 189 | 27 | 16.43 | 4 January 1936 | 22 years, 22 days | |
| 216 | 37 | 24.21 | 24 July 1953 | 17 years, 201 days | |
| 236 | 51 | 24.89 | 26 January 1963 | 9 years, 186 days | |
| 242[d] | 67 | 24.27 | 15 March 1963 | 48 days | |
| 307 | 67 | 21.57 | 1 February 1976 | 12 years, 323 days | |
| 309 | 79 | 29.09 | 27 December 1981 | 5 years, 329 days | |
| 355 | 70 | 23.92 | 21 August 1986 | 4 years, 237 days | |
| 373[e] | 94 | 27.86 | 12 November 1988 | 2 years, 83 days | |
| 431 | 86 | 22.29 | 8 February 1994 | 5 years, 88 days | |
| 434 | 131 | 29.64 | 27 March 2000 | 6 years, 48 days | |
| 519 | 132 | 24.44 | 8 May 2004 | 4 years, 42 days | |
| 532[f] | 91 | 22.87 | 15 October 2004 | 160 days | |
| 708 | 145 | 25.41 | 3 December 2007 | 3 years, 49 days | |
| 800 | 133 | 22.72 | Current | 10 years, 316 days | |
|
Notes | |||||
| Average | Player | Balls | Wickets |
| 10.75 | 3,830 | 112 | |
|---|---|---|---|
| 12.70 | 2,302 | 61 | |
| 15.54 | 2,289 | 51 | |
| 16.42 | 2,364 | 50 | |
| 16.43 | 7,873 | 189 | |
|
Qualification: 2000 balls bowled Note: If the qualification is removed, the best career average record is at 0.00 runs per wicket (i.e. no runs were conceded). This record is shared by Englishmen A N Hornby, Wilf Barber and New Zealander, Bruce Murray who took one wicket without conceding a run[70]
| |||
| Strike rate | Player | Balls | Wickets |
| 34.1 | 3,830 | 112 | |
|---|---|---|---|
| 37.7 | 2,302 | 61 | |
| 38.7 | 3,372 | 87 | |
| 41.4 | 17,286 | 417 | |
| 41.6 | 7,873 | 189 | |
|
Qualification: 2000 balls bowled | |||
| 5 wickets in an innings | Player | Matches |
| 67 | 133 | |
|---|---|---|
| 37 | 145 | |
| 36 | 86 | |
| 35 | 132 | |
| 34 | 92 | |
|
Last updated: 25 July 2018[73] | ||
| 10 wickets in a match | Player | Matches |
| 22 | 133 | |
|---|---|---|
| 10 | 145 | |
| 9 | 86 | |
| 92 | ||
| 8 | 132 | |
|
Last updated: 25 July 2018[74] | ||
Series
| Wickets | Player | Series |
| 49 (4 Tests) | v | |
|---|---|---|
| 46 (5 Tests) | v | |
| 44 (5 Tests) | v | |
| 42 (6 Tests) | v | |
| 41 (6 Tests) | v | |
| v | ||
|
Last updated: 15 June 2016[75] | ||
Innings
| Bowling figures | Player | Opponent | Venue | Season |
| 10–53 | Old Trafford, Manchester | 1956 | ||
|---|---|---|---|---|
| 10–74 | Feroz Shah Kotla Ground, Delhi | 1998–99 | ||
| 9–28 | Old Wanderers, Johannesburg | 1895–96 | ||
| 9–37 | Old Trafford, Manchester | 1956 | ||
| 9–51 | Asgiriya Stadium, Kandy | 2001–02 | ||
|
Last updated: 15 June 2016[76] | ||||
| Bowling figures | Player | Opponent | Venue | Season |
| 7–55 | (in the inaugural Test match) | Melbourne Cricket Ground | 1876–77 | |
|---|---|---|---|---|
| 7–44 | The Oval, London | 1882 | ||
| 7–28 | Melbourne Cricket Ground | 1882–83 | ||
| 8–35 | Sydney Cricket Ground | 1886–87 | ||
| 8–11 | Newlands Cricket Ground, Cape Town | 1888–89 | ||
| 8–7 | St. George's Park, Port Elizabeth | 1895–96 | ||
| 9–28 | Old Wanderers, Johannesburg | 1895–96 | ||
| 10–53 | Old Trafford, Manchester | 1956 | ||
|
Calculated at the conclusion of each Test | ||||
Match records
| Bowling | Player | Opponent | Venue | Season |
| 19–90 | Old Trafford, Manchester | 1956 | ||
|---|---|---|---|---|
| 17–159 | Old Wanderers, Johannesburg | 1913–14 | ||
| 16–136 | M. A. Chidambaram Stadium, Chennai | 1987–88 | ||
| 16–137 | Lord's, London | 1972 | ||
| 16–220 | The Oval, London | 1998 | ||
|
Last updated: 15 June 2016[77] | ||||
Innings as captain
| Bowling figures | Player | Opponent | Venue | Season |
| 9–83 | Sardar Patel Stadium, Ahmedabad | 1983 | ||
|---|---|---|---|---|
| 8–60 | National Stadium, Karachi, Karachi | 1982 | ||
| 8–63 | Harare Sports Club, Harare | 2016 | ||
| 8–106 | Adelaide Oval, Adelaide | 1985 | ||
| 7–37 | Basin Reserve, Wellington | 1995 | ||
|
Last updated: 16 March 2017[78] | ||||
Match records as captain
| Bowling | Player | Opponent | Venue | Season |
| 13–55 | Basin Reserve, Wellington | 1995 | ||
|---|---|---|---|---|
| 13–135 | Southend Club Cricket Stadium, Karachi | 1993 | ||
| 13–152 | Harare Sports Club, Harare | 2016 | ||
| 12–100 | Bangabandhu National Stadium, Dhaka | 1959 | ||
| 11–79 | National Stadium, Karachi | 1982 | ||
|
Last updated: 15 June 2016[79] | ||||
Individual records (fielding)
Most catches in Test career
| Catches | Player | Matches |
| 210 | 164 | |
|---|---|---|
| 205 | 149 | |
| 200 | 166 | |
| 196 | 168 | |
| 181 | 128 | |
| Note:The list excludes catches made as wicket-keeper[80] Last updated: 15 June 2016 | ||
Individual records (wicket-keeping)
| Dismissals | Player | Matches |
| 555 (532 catches + 23 stumpings) | 147 | |
| 416 (379 catches + 37 stumpings) | 96 | |
| 395 (366 catches + 29 stumpings) | 119 | |
| 355 (343 catches + 12 stumpings) | 96 | |
| 294 (256 catches + 38 stumpings) | 90 | |
|
Last updated: 15 June 2016[81] | ||
| Catches | Player | Matches |
| 532 | 147 | |
|---|---|---|
| 379 | 96 | |
| 366 | 119 | |
| 343 | 96 | |
| 265 | 81 | |
|
Last updated: 15 June 2016[82] | ||
| Stumpings | Player | Matches |
| 52 | 54 | |
|---|---|---|
| 46 | 91 | |
| 38 | 88 | |
| 90 | ||
| 37 | 96 | |
|
Last updated: 15 June 2016[83] | ||
Individual records (as an all-rounder)
| Player | Runs | Wickets | Date | Opponent | Venue |
| 114 | 13/109 | 15 February 1980 | Mumbai, India | ||
| 117 | 11/180 | 3 January 1983 | Faisalabad, Pakistan | ||
| 137 | 10/124 | 3 November 2014 | Khulna, Bangladesh | ||
|
Last updated: 15 June 2016[85] | |||||
Individual records (other)
| Matches | Player | Period |
| 200 | 1989–2013 | |
|---|---|---|
| 168 | 1985–2004 | |
| 1995–2012 | ||
| 166 | 1995–2013 | |
| 164 | 1996–2012 | |
| 1994–2015 | ||
|
Last updated: 15 June 2016[86] | ||
| Matches | Player | Won | Lost | Drawn | Tied |
| 109 | 53 | 29 | 27 | 0 | |
|---|---|---|---|---|---|
| 93 | 32 | 22 | 38 | 1 | |
| 80 | 28 | 27 | 25 | 0 | |
| 77 | 48 | 16 | 13 | 0 | |
| 74 | 36 | 12 | 26 | 0 | |
|
Last updated: 15 June 2016[87] | |||||
| Won | Player | Lost | Drawn | Ties | Matches |
| 53 | 26 | 26 | 0 | 109 | |
|---|---|---|---|---|---|
| 48 | 16 | 13 | 0 | 77 | |
| 41 | 9 | 7 | 0 | 57 | |
| 36 | 12 | 26 | 0 | 74 | |
| 32 | 22 | 38 | 1 | 93 | |
|
Last updated: 15 June 2016[88] | |||||
Partnership records
Highest partnership for each wicket
Highest partnerships
| Runs | Team | Players | Opposition | Venue | Season | |
| 624 (3rd wicket) | Kumar Sangakkara (287) | Mahela Jayawardene (374) | Sinhalese Sports Club Ground, Colombo | 2006 | ||
|---|---|---|---|---|---|---|
| 576 (2nd wicket) | Sanath Jayasuriya (340) | Roshan Mahanama (225) | Ranasinghe Premadasa Stadium, Colombo | 1997–98 | ||
| 467 (3rd wicket) | Andrew Jones (186) | Martin Crowe (299) | Basin Reserve, Wellington | 1990–91 | ||
| 451 (2nd wicket) | Bill Ponsford (266) | Donald Bradman (244) | The Oval, London | 1934 | ||
| 451 (3rd wicket) | Mudassar Nazar (231) | Javed Miandad (280*) | Niaz Stadium, Hyderabad | 1982–83 | ||
|
Last updated: 15 June 2016[90] | ||||||
See also
- List of Australia Test cricket records
- List of Bangladesh Test cricket records
- List of England Test cricket records
- List of India Test cricket records
- List of Ireland Test cricket records
- List of New Zealand Test cricket records
- List of Pakistan Test cricket records
- List of South Africa Test cricket records
- List of Sri Lanka Test cricket records
- List of West Indies Test cricket records
- List of Zimbabwe Test cricket records
- List of Cricket records
- List of One Day International cricket records
- List of Twenty20 International records
References
- ↑ "Classification of Official Cricket" (PDF). International Cricket Council. Archived from the original (PDF) on 29 September 2011. Retrieved 12 August 2009.
- ↑ "The difference between Test and one-day cricket". BBC Sport. 6 September 2005. Retrieved 12 August 2009.
- ↑ Martin-Jenkins, Christopher (3 June 2005). "Flintoff given go-ahead to make it even more difficult for opponents". The Times. Retrieved 12 August 2009. (subscription required)
- ↑ Williamson, Martin (14 March 2009). "Calling time on eternity". Cricinfo. ESPN. Retrieved 12 August 2009.
- ↑ Williamson, Martin. "The birth of Test cricket". Cricinfo. ESPN. Retrieved 12 August 2009.
- ↑ Martin-Jenkins, Christopher (2003). "Crying out for less". Wisden Cricketers' Almanack – online archive. John Wisden & Co. Retrieved 12 August 2009.
- ↑ "Records – Test matches". Cricinfo. ESPN. Retrieved 12 August 2009.
- ↑ Briggs, Simon (2 January 2009). "Twenty20 threatening Bangladesh Test status". The Telegraph. Retrieved 12 August 2009.
- ↑ Marshallsea, Trevor (17 February 2006). "Ponting queries Bangladesh Test status". The Age. Retrieved 12 August 2009.
- ↑ "Lillee rubbishes Bangladesh series". ABC News. 30 June 2003. Retrieved 12 August 2009.
- ↑ Beard, Matthew (26 February 2001). "Donald Bradman, world's greatest batsman, dies at 92". The Independent. Retrieved 12 August 2009.
- ↑ "Player Profile: Sir Donald Bradman". Cricinfo. ESPN. Retrieved 12 August 2009.
- ↑ Davis, Charles (4 August 2007). "Could this be the Don's missing four runs?". Sydney Morning Herald. Retrieved 12 August 2009.
- ↑ Leggat, David (23 August 2008). "The tainted stat that divides a nation". New Zealand Herald. Retrieved 12 August 2009.
- ↑ All Records of Sir Don Bradman Archived 9 August 2013 at the Wayback Machine.
- ↑ "Records – First-class matches – Bowling records – Best figures in a match". Cricinfo. ESPN. Retrieved 12 August 2009.
- ↑ "Pakistan tour of India, 1998/99". Cricinfo. ESPN. Retrieved 23 July 2012.
- ↑ Fraser, Angus (13 April 2008). "Lara smashes magical 400 to rewrite history". The Independent. Retrieved 12 August 2009.
- ↑ "Muralitharan breaks Test record". BBC Sport. 3 December 2007. Retrieved 12 August 2009.
- ↑ "India v Australia 2nd Test". BBC Sport. 17 October 2008. Retrieved 12 August 2009.
- ↑ "Eye injury ends Boucher's career". Cricinfo. ESPN. 10 July 2012. Retrieved 23 July 2012.
- ↑ "Rahul Dravid announces retirement from international cricket". The Times of India. Times Group. 9 March 2012. Retrieved 23 July 2012.
- ↑ "Match/series archive". Cricinfo. ESPN. Retrieved 16 August 2009.
- ↑ "Test matches – Team records – Results summary". Cricinfo. ESPN. Retrieved 29 October 2017.
- ↑ "Test matches – Team records – Largest margin of victory (by an innings)". Cricinfo. ESPN. Retrieved 8 August 2009.
- ↑ "Test matches – Team records – Largest margin of victory (by runs)". Cricinfo. ESPN. Retrieved 8 August 2009.
- ↑ "Records / Test matches / Team records / Tied matches". Cricinfo. ESPN. Retrieved 30 December 2011.
- ↑ "England tour of Zimbabwe, 1996/97". Cricinfo. ESPN. Retrieved 30 December 2011.
- ↑ "West Indies tour of India, 2011/12". Cricinfo. ESPN. Retrieved 7 January 2012.
- ↑ "Test matches – Team records – Smallest margin of victory (by wickets)". Cricinfo. ESPN. Retrieved 5 October 2010.
- ↑ "Test matches – Team records – Smallest margin of victory (by runs)". Cricinfo. ESPN. Retrieved 8 August 2009.
- ↑ "Test matches – Team records – Victory after a follow on". Cricinfo. ESPN. Retrieved 8 August 2009.
- ↑ "Test matches – Team records – Most consecutive wins". Cricinfo. ESPN. Retrieved 28 January 2011.
- ↑ "Test matches – Team records – Highest innings totals". Cricinfo. ESPN. Retrieved 14 September 2017.
- ↑ "Test matches – Team records – Lowest innings totals". Cricinfo. ESPN. Retrieved 14 September 2017.
- ↑ "Test matches – Team records – Highest fourth innings totals in won match". Cricinfo. ESPN. Archived from the original on 9 April 2014. Retrieved 14 September 2017.
- ↑ "Most runs in career". Cricinfo. ESPN. Retrieved 10 September 2018.
- ↑ "Record-holders for most number of Test runs". Cricinfo Blogs. ESPN. Archived from the original on 22 July 2012. Retrieved 20 March 2012.
- ↑ "Most runs in each batting position". Howstat Test Cricket. Howstat. Retrieved 23 January 2018.
- ↑ "Batting records". Cricinfo. ESPN. Retrieved 21 December 2017.
- ↑ "Stuart Law, batting statistics in Tests". Cricinfo. ESPN. Retrieved 21 December 2017.
- ↑ "Andy Lloyd, batting statistics in Tests". Cricinfo. ESPN. Retrieved 21 December 2017.
- ↑ "Test matches – Batting records – Highest career batting averages". Cricinfo. ESPN. Retrieved 20 December 2017.
- ↑ "Test matches – Batting records – Most runs in an innings". Cricinfo. ESPN. Retrieved 8 August 2009.
- ↑ "Test matches – Batting records – Most runs in an innings (progressive record holder)". Cricinfo. ESPN. Retrieved 10 January 2015.
- ↑ "Records – Test matches – Batting records – Most runs in a match". Cricinfo. ESPN. Retrieved 7 February 2014.
- ↑ "Test matches – Batting records – Most runs in a series". Cricinfo. ESPN. Retrieved 9 January 2012.
- ↑ "Test matches – Batting records – Most runs in a calendar year". Cricinfo. ESPN. Retrieved 20 March 2017.
- ↑ "The worst batsmen, and the most runs between dismissals". Cricinfo. ESPN. Retrieved 21 December 2017.
- ↑ "Adam Voges: Australia batsman takes Test average over 100 in New Zealand". BBC. Retrieved 21 December 2017.
- ↑ "Highest individual scores in each batting positions". Cricinfo. ESPNcrcinfo. Retrieved 29 January 2017.
- ↑ "Test matches – Batting records – Most runs in an innings as captain". Cricinfo. ESPN. Retrieved 8 August 2009.
- ↑ "Test matches - Batting records - Carrying bat through a completed innings". Cricinfo. ESPN.
- ↑ "Test matches – Batting records – Most runs off one over". Cricinfo. ESPN. Retrieved 8 August 2009.
- ↑ "Most hundreds in a career". Cricinfo. ESPN. Retrieved 19 September 2014.
- ↑ "Test matches – Batting records – Fastest hundreds". Cricinfo. ESPN. Retrieved 8 August 2009.
- ↑ "Test matches – Batting records – Most double hundreds in a career". Cricinfo. ESPN. Retrieved 19 September 2014.
- ↑ "Test matches – Batting records – Most triple hundreds in a career". Cricinfo. ESPN. Retrieved 6 February 2013.
- ↑ "Most runs in an innings". Cricinfo. ESPN. Retrieved 18 January 2012.
- ↑ "Test matches – Batting records – View innings by innings list – Runs scored greater than or equal to 400". Cricinfo. ESPN. Archived from the original on 29 June 2013. Retrieved 9 May 2013.
- ↑ "Most fifties in a career". Cricinfo. ESPN. Retrieved 1 June 2015.
- ↑ "Test matches – Batting records – Fastest fifties". Cricinfo. ESPN. Retrieved 1 June 2015.
- ↑ "Records–Test Matches–Batting records–Most fours in a career". Cricinfo. ESPN. Retrieved 1 May 2013.
- ↑ "Test matches – Bowling records – Most wickets in career". Cricinfo. ESPN. Retrieved 30 August 2009.
- ↑ "Australia v England in 1876/77". CricketArchive. Retrieved 30 August 2009.
- ↑ p44, Bill Frindall, The Guinness Book of Cricket Facts and Feats, Guinness Publishing, 1996
- ↑ "Evolution of most Test wickets". Cricinfo. Retrieved 2018-09-05.
- ↑ "A Graphical View of India vs Australia, 2nd Test match, Chennai, played 14–18 October 2004". CricketArchive. Retrieved 30 August 2009.
- ↑ "Test matches – Bowling records – Best career bowling average". Cricinfo. ESPN. Retrieved 8 August 2009.
- ↑ "Test matches – Bowling records – Best career bowling average (without qualification)". Cricinfo. ESPN. Retrieved 10 January 2015.
- ↑ "Test matches played by JJ Ferris". Cricinfo. ESPN. Archived from the original on 16 July 2012. Retrieved 15 August 2009.
- ↑ "Test matches – Bowling records – Best career strike rate". Cricinfo. ESPN. Retrieved 2 September 2017.
- ↑ "Test matches – Bowling records – Most five-wickets-in-an-innings in a career". Cricinfo. ESPN. Retrieved 23 July 2010.
- ↑ "Test matches – Bowling records – Most ten-wickets-in-a-match in a career". Cricinfo. ESPN. Retrieved 2 September 2017.
- ↑ "Test matches – Bowling records – Most wickets in a series". Cricinfo. ESPN. Retrieved 9 January 2012.
- ↑ "Test matches – Bowling records – Best figures in an innings". Cricinfo. ESPN. Retrieved 8 August 2009.
- ↑ "Test matches – Bowling records – Best figures in a match". Cricinfo. ESPN. Retrieved 8 August 2009.
- ↑ "Test matches – Bowling records – Best figures in an innings as captain". Cricinfo. ESPN. Retrieved 16 March 2017.
- ↑ "Test matches – Bowling records – Best figures in a match as captain". Cricinfo. ESPN. Retrieved 8 August 2009.
- ↑ "Test matches – Fielding records – Most catches in career". Cricinfo. ESPN. Retrieved 30 April 2013.
- ↑ "Test matches – Wicketkeeping records – Most dismissals in career". Cricinfo. ESPN. Retrieved 15 July 2012.
- ↑ "Test matches – Wicketkeeping records – Most catches in career". Cricinfo. ESPN. Retrieved 15 July 2012.
- ↑ "Test matches – Wicketkeeping records – Most stumpings in career". Cricinfo. ESPN. Retrieved 30 April 2013.
- 1 2 3 http://www.cricketcountry.com/articles/shakib-al-hasan-becomes-third-all-rounder-to-score-hundred-and-take-10-wickets-in-same-test-207619
- ↑ "Cricketers Who Have Taken 10 Wickets and a Century in a Test match". Cricinfo. ESPN. Retrieved 24 November 2014.
- ↑ "Test matches – Individual records (captains, players, umpires) – Most matches in career". Cricinfo. ESPN. Retrieved 30 April 2013.
- ↑ "Test matches – Individual records (captains, players, umpires) – Most matches as captain". Cricinfo. ESPN. Retrieved 20 April 2013.
- ↑ "Test matches – Individual records (captains, players, umpires) – Most matches won as captain". Cricinfo. ESPN. Archived from the original on 11 March 2016. Retrieved 29 January 2015.
- ↑ "Test matches – Partnership records – Highest partnerships by wicket". Cricinfo. ESPN. Retrieved 17 February 2014.
- ↑ "Test matches – Partnership records – Highest partnerships for any wicket". Cricinfo. ESPN. Retrieved 8 August 2009.
External links
- Records – Test matches ESPN Cricinfo
- HowSTAT!
- Test Records Cricket-Records.com
- Wisden Records in Test Matches Wisden