List of Indian states and territories by Human Development Index
The national average HDI for India in 2008 was 0.467.[1] By 2010, its average HDI had risen to 0.519.[2][3] UNDP, the sponsor of Human Development Index methodology since 1990, reported India's HDI to be 0.554 for 2012,[4] an 18% increase over its 2008 HDI. United Nations Declared India's HDI is 0.586 in 2014,[5] a 5.77% increase over 2012. As for the year 2016, HDI for India stood at 0.624.[6]
HDI is composite index that takes into consideration (1) Life expectancy, (2) Education and (3) Per capita income.
List
This is a list of by Human Development Index as of 2016 with data from the year 2015 for all states and territories of India.[7]
HDI from 1995–2015
Human Development Index (by UN Method) of Indian states since 1995.[7]
| Rank | State | HDI 1995 | HDI 2000 | HDI 2005 | HDI 2010 | HDI 2015 | Increase 1995–2015 |
|---|---|---|---|---|---|---|---|
| 1 | Kerala | 0.562 | 0.610 | 0.694 | 0.732 | 0.770 | |
| 2 | Goa | 0.579 | 0.623 | 0.684 | 0.751 | 0.763 | |
| ... | Chandigarh | 0.607 | 0.642 | 0.670 | 0.658 | 0.739 | |
| ... | Lakshadweep | 0.669 | 0.711 | 0.739 | 0.729 | 0.738 | |
| ... | Puducherry | 0.694 | 0.738 | 0.767 | 0.756 | 0.737 | |
| ... | Delhi | 0.630 | 0.673 | 0.700 | 0.718 | 0.734 | |
| ... | Andaman and Nicobar Islands | 0.663 | 0.704 | 0.732 | 0.722 | 0.731 | |
| 3 | Himachal Pradesh | 0.557 | 0.596 | 0.653 | 0.675 | 0.706 | |
| Punjab | 0.547 | 0.582 | 0.620 | 0.664 | 0.706 | ||
| 5 | Manipur | 0.525 | 0.563 | 0.603 | 0.691 | 0.699 | |
| 6 | Mizoram | 0.532 | 0.574 | 0.637 | 0.694 | 0.697 | |
| 7 | Sikkim | 0.515 | 0.549 | 0.598 | 0.643 | 0.696 | |
| ... | Daman and Diu | 0.628 | 0.669 | 0.695 | 0.686 | 0.695 | |
| 8 | Tamil Nadu | 0.507 | 0.546 | 0.605 | 0.655 | 0.694 | |
| 9 | Haryana | 0.515 | 0.550 | 0.594 | 0.639 | 0.687 | |
| 10 | Maharashtra | 0.523 | 0.561 | 0.607 | 0.651 | 0.683 | |
| 11 | Nagaland | 0.491 | 0.524 | 0.558 | 0.666 | 0.681 | |
| 12 | Jammu and Kashmir | 0.493 | 0.530 | 0.591 | 0.646 | 0.675 | |
| ... | Dadra and Nagar Haveli | 0.645 | 0.686 | 0.714 | 0.704 | 0.665 | |
| 13 | Karnataka | 0.481 | 0.517 | 0.567 | 0.610 | 0.662 | |
| Uttarakhand | 0.594 | 0.627 | 0.655 | 0.643 | 0.662 | ||
| 15 | Arunachal Pradesh | 0.471 | 0.501 | 0.531 | 0.639 | 0.661 | |
| 16 | Gujarat | 0.489 | 0.526 | 0.573 | 0.608 | 0.651 | |
| Telangana | 0.593 | 0.628 | 0.655 | 0.643 | 0.651 | ||
| 18 | Meghalaya | 0.435 | 0.470 | 0.531 | 0.621 | 0.648 | |
| 19 | Tripura | 0.499 | 0.532 | 0.561 | 0.613 | 0.645 | |
| 20 | Andhra Pradesh | 0.443 | 0.476 | 0.529 | 0.581 | 0.627 | |
| 21 | West Bengal | 0.474 | 0.506 | 0.540 | 0.576 | 0.620 | |
| 22 | Rajasthan | 0.432 | 0.462 | 0.505 | 0.547 | 0.601 | |
| 23 | Assam | 0.453 | 0.486 | 0.527 | 0.565 | 0.593 | |
| 24 | Chhattisgarh | 0.525 | 0.555 | 0.581 | 0.570 | 0.586 | |
| 25 | Odisha | 0.422 | 0.452 | 0.489 | 0.533 | 0.580 | |
| 26 | Jharkhand | 0.557 | 0.557 | 0.583 | 0.572 | 0.578 | |
| 27 | Madhya Pradesh | 0.419 | 0.450 | 0.493 | 0.533 | 0.577 | |
| 28 | Uttar Pradesh | 0.423 | 0.454 | 0.496 | 0.529 | 0.566 | |
| 29 | Bihar | 0.401 | 0.430 | 0.464 | 0.511 | 0.551 | |
| 0.460 | 0.493 | 0.536 | 0.581 | 0.624 |
Consumption-based HDI
There are many ways to calculate HDI, and its calculation is sensitive to base data and assumptions. Using another approach, UNDP India and Government of India calculated the HDI nationwide average to be 0.605 in 2006.[8] This data was published by the Indian Government.[1] Note that the 2007-2008 HDI values in the table below is not based on income as is the UNDP standard practice for global comparisons, but on estimated consumption expenditure – an assumption which underestimates the HDI than actual.[9] Further, data was unavailable for the following states and union territories: Chandigarh, Lakshadweep, Andaman and Nicobar Islands, Daman and Diu, Puducherry, and Dadra and Nagar Haveli.[10][11]
| Rank | State/Union Territory | consumption based HDI[12] (2007–08) |
|---|---|---|
| 1 | Kerala | 0.790 |
| 2 | Delhi | 0.750 |
| 3 | Himachal Pradesh | 0.652 |
| 4 | Goa | 0.617 |
| 5 | Punjab | 0.605 |
| 6 | NE (excluding Assam) | 0.573 |
| 7 | Maharashtra | 0.572 |
| 8 | Tamil Nadu | 0.570 |
| 9 | Haryana | 0.552 |
| 10 | Jammu and Kashmir | 0.542 |
| 11 | Gujarat | 0.527 |
| 12 | Karnataka | 0.519 |
| – | National average | 0.513 |
| 13 | West Bengal | 0.492 |
| 14 | Uttarakhand | 0.490 |
| 15 | Andhra Pradesh | 0.473 |
| 16 | Assam | 0.444 |
| 17 | Rajasthan | 0.434 |
| 18 | Uttar Pradesh | 0.380 |
| 19 | Jharkhand | 0.376 |
| 20 | Madhya Pradesh | 0.375 |
| 21 | Bihar | 0.367 |
| 22 | Odisha | 0.362 |
| 23 | Chhattisgarh | 0.358 |
Trend analysis
Compared with the previous Indian National Human Development Reports and the latest state-level government statistical report, India has significantly improved its HDI in all of its administrative subdivisions:
| Legend | ||||
|---|---|---|---|---|
|
Very High/High Human Development Index 0.850–0.899
0.800–0.849 |
Medium human development index 0.750–0.799
0.700–0.749
0.650–0.699
0.600–0.649
0.550–0.599
0.500–0.549 |
Low human development index 0.450–0.499
0.400–0.449
0.350–0.399
0.300–0.349
0.250–0.299
≤0.250 |
Lack of information | |
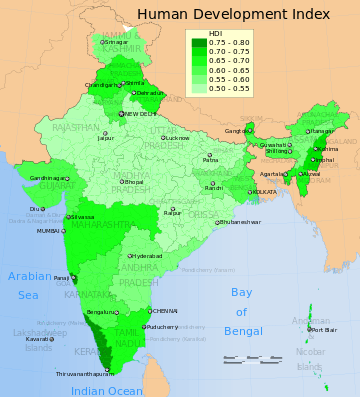
This is a list of Indian states by their respective Human Development Index (HDI), as of 2008.[1] Kerala stands first in Human Development Index among the states in India.
- 1981 to 2005 human development index in India
 National Human Development Report 1981
(1981 data)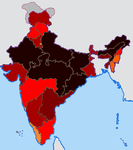 National Human Development Report 1991
(1991 data) National Human Development Report 2001
(2001 data) State-level Census and Statistics 2008 report
(2005 data)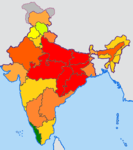 National Human Development Report 2011
(2007–2008 data)
References
- 1 2 3 "India Human Development Report 2011 (Towards Social Inclusion)" (PDF). IAMR, Planning Commission, Government of India. p. 257. Archived from the original (PDF) on 5 March 2016. Retrieved 5 April 2014.
- ↑ "Selected Socio-Economic Statistics India, 2011" (PDF). Ministry of Statistics and Programme Implementation, Government of India. October 2011. Table 11.1, page 165. Archived from the original (PDF) on 3 March 2016. Retrieved 24 January 2015.
- ↑ "India Human Development Report 2011 (Towards Social Inclusion)" (PDF). IAMR, Planning Commission, Government of India. p. 17. Archived from the original (PDF) on 5 March 2016. Retrieved 2 July 2014.
- ↑ Human Development Report 2013 UNDP, page 64, Tabel 3.1
- ↑ "Human Development Report 2014 – Sustaining Human Progress: Reducing Vulnerabilities and Building Resilience". United Nations Development Programme. Retrieved 24 January 2016.
- ↑ "India slips in human development index". thehindu.com. Retrieved 14 September 2017.
- 1 2 "Sub-national HDI - Area Database - Global Data Lab". hdi.globaldatalab.org. Retrieved 2018-09-13.
- ↑ Gendering Human Development Indices, Ministry of Women and Child Development, Govt of India with UNDP India (2009)
- ↑ "India Human Development Report 2011 (Towards Social Inclusion)" (PDF). IAMR, Planning Commission, Government of India. p. 24. Archived from the original (PDF) on 5 March 2016. Retrieved 2 July 2014.
- ↑ "Meghalaya Human Development Report 2008" (PDF). p. 23.
- ↑ "General Reports: Planning Commission, Government of India". planningcommission.nic.in. Retrieved 24 January 2016.
- ↑ "India Human Development Report 2011 (Towards Social Inclusion) – Summary" (PDF). IAMR, Planning Commission, Government of India. p. 2. Retrieved 27 October 2014.
- ↑ "Gendering Human Development Indices" (PDF). Ministry of Women and Child Development, Government of India with UNDP India. March 2009.