Leizhou
| Leizhou 雷州市 | |
|---|---|
| County-level city | |
 | |
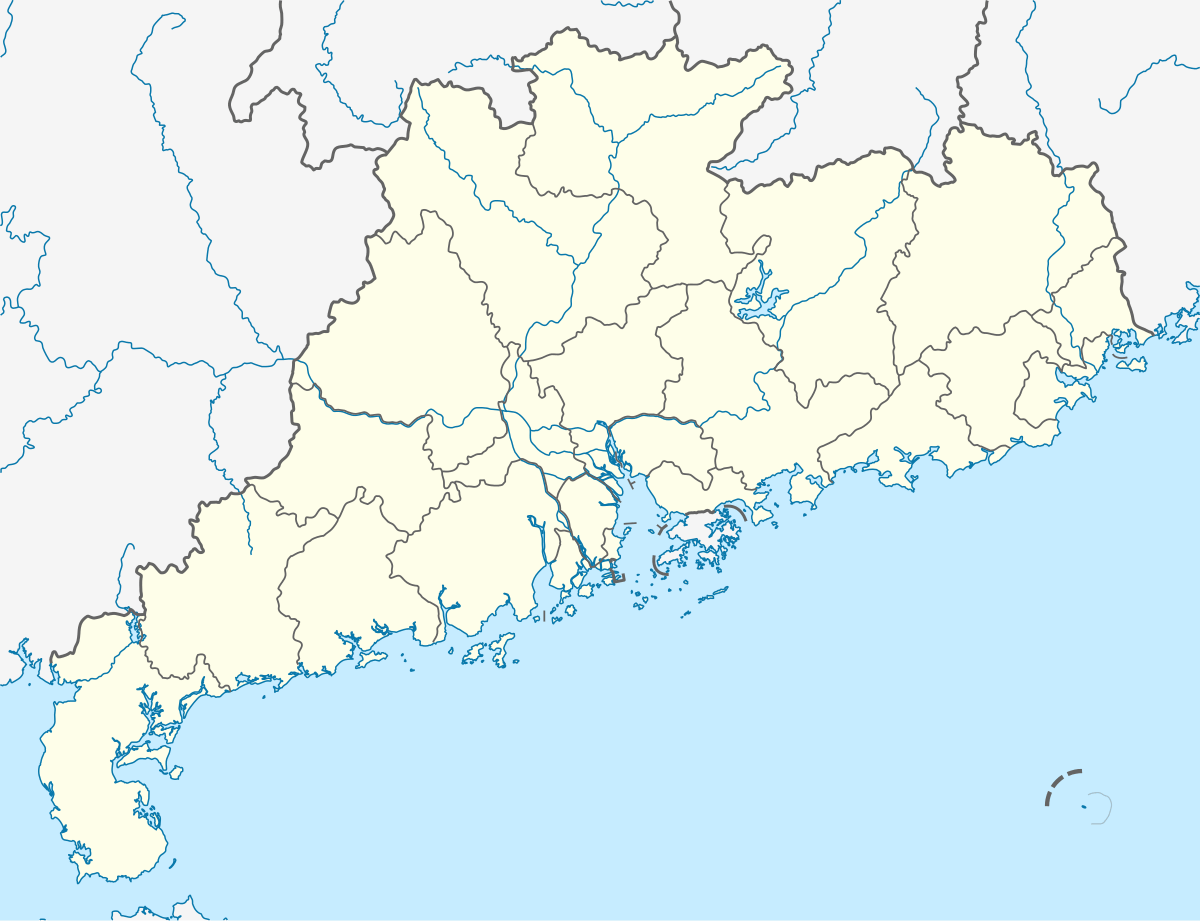 Leizhou Location in Guangdong | |
| Coordinates: 20°55′N 110°06′E / 20.917°N 110.100°ECoordinates: 20°55′N 110°06′E / 20.917°N 110.100°E | |
| Country | People's Republic of China |
| Province | Guangdong |
| Prefecture-level city | Zhanjiang |
| Population | |
| • Total | 279,124 |
| Time zone | UTC+8 (China Standard) |
| Leizhou | |||||||||||||||
| Chinese | 雷州 | ||||||||||||||
|---|---|---|---|---|---|---|---|---|---|---|---|---|---|---|---|
| Postal | Leichow | ||||||||||||||
| |||||||||||||||
Leizhou (Chinese: 雷州) is a county-level city in Guangdong Province, China. It is under the jurisdiction of Zhanjiang prefecture-level city.
The city was formerly known as Haikang County (postal: Hoihong); it was upgraded into a city in 1994.
Geography
Leizhou is located at the extreme southwestern end of Guangdong and lies on the Leizhou Peninsula.
Transportation
Climate
| Climate data for Leizhou (1981−2010) | |||||||||||||
|---|---|---|---|---|---|---|---|---|---|---|---|---|---|
| Month | Jan | Feb | Mar | Apr | May | Jun | Jul | Aug | Sep | Oct | Nov | Dec | Year |
| Record high °C (°F) | 29.5 (85.1) |
34.4 (93.9) |
37.5 (99.5) |
37.3 (99.1) |
38.6 (101.5) |
37.7 (99.9) |
38.5 (101.3) |
36.5 (97.7) |
36.3 (97.3) |
33.3 (91.9) |
32.9 (91.2) |
29.6 (85.3) |
38.6 (101.5) |
| Average high °C (°F) | 19.5 (67.1) |
19.8 (67.6) |
22.8 (73) |
27.3 (81.1) |
30.7 (87.3) |
32.5 (90.5) |
32.9 (91.2) |
32.2 (90) |
30.7 (87.3) |
28.5 (83.3) |
25.3 (77.5) |
21.3 (70.3) |
27 (80.5) |
| Daily mean °C (°F) | 15.9 (60.6) |
16.8 (62.2) |
19.6 (67.3) |
23.9 (75) |
26.8 (80.2) |
28.4 (83.1) |
28.7 (83.7) |
28.3 (82.9) |
27.0 (80.6) |
24.8 (76.6) |
21.2 (70.2) |
17.3 (63.1) |
23.2 (73.8) |
| Average low °C (°F) | 13.5 (56.3) |
14.7 (58.5) |
17.5 (63.5) |
21.5 (70.7) |
24.1 (75.4) |
25.5 (77.9) |
25.7 (78.3) |
25.6 (78.1) |
24.4 (75.9) |
22.1 (71.8) |
18.3 (64.9) |
14.4 (57.9) |
20.6 (69.1) |
| Record low °C (°F) | 4.7 (40.5) |
3.7 (38.7) |
4.8 (40.6) |
10.8 (51.4) |
15.6 (60.1) |
20.1 (68.2) |
21.8 (71.2) |
21.6 (70.9) |
17.0 (62.6) |
12.3 (54.1) |
6.6 (43.9) |
2.4 (36.3) |
2.4 (36.3) |
| Average precipitation mm (inches) | 19.0 (0.748) |
36.0 (1.417) |
43.7 (1.72) |
99.4 (3.913) |
213.0 (8.386) |
210.4 (8.283) |
231.2 (9.102) |
288.3 (11.35) |
244.4 (9.622) |
147.1 (5.791) |
47.4 (1.866) |
26.9 (1.059) |
1,606.8 (63.257) |
| Average relative humidity (%) | 83 | 89 | 90 | 89 | 86 | 84 | 83 | 85 | 85 | 82 | 78 | 78 | 84 |
| Source: China Meteorological Data Service Center | |||||||||||||
See also
| Sub-provincial cities |
| ||||||||||||||||||||||||||||||||||||||||||||||||||||||||||||||||
|---|---|---|---|---|---|---|---|---|---|---|---|---|---|---|---|---|---|---|---|---|---|---|---|---|---|---|---|---|---|---|---|---|---|---|---|---|---|---|---|---|---|---|---|---|---|---|---|---|---|---|---|---|---|---|---|---|---|---|---|---|---|---|---|---|---|
| Prefecture-level cities |
| ||||||||||||||||||||||||||||||||||||||||||||||||||||||||||||||||
| |||||||||||||||||||||||||||||||||||||||||||||||||||||||||||||||||
This article is issued from
Wikipedia.
The text is licensed under Creative Commons - Attribution - Sharealike.
Additional terms may apply for the media files.