Iowa's 1st congressional district
| Iowa's 1st congressional district | |
|---|---|
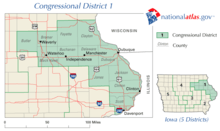
.tif.png) Iowa's 1st congressional district - since January 3, 2013. | |
| Current Representative | Rod Blum (R–Dubuque) |
| Distribution |
|
| Population (2000) | 585,302[1] |
| Median income | 38,727[1] |
| Ethnicity |
|
| Cook PVI | D+1[2] |
Iowa's 1st congressional district is a congressional district in the U.S. state of Iowa that covers the northeastern part of the state. The district includes Dubuque, Cedar Rapids, and Waterloo.
The district is currently represented by Republican Rod Blum.
Cities in the district
Redistricting
On June 22, 2001, the Iowa General Assembly passed a redistricting plan. The plan went into effect in 2002 for the 108th United States Congress. The prior redistricting plan was effective from 1992-2001.[3]
Presidential Elections results
Election results from presidential races:
| Year | Office | Results | Political parties that won the district |
|---|---|---|---|
| 2000 | President | Al Gore 52 - George W. Bush 45% | Democratic Party (United States) |
| 2004 | President | John Kerry 53 - George W. Bush 46% | Democratic Party (United States) |
| 2008 | President | Barack Obama 58 - John McCain 41% | Democratic Party (United States) |
| 2012 | President | Barack Obama 56 - Mitt Romney 43% | Democratic Party (United States) |
| 2016 | President | Donald Trump 49 - Hillary Clinton 45% | Republican Party (United States) |
List of representatives
| Representative | Party | Term | Note |
|---|---|---|---|
District created |
March 4, 1847 | ||
 |
Democratic | March 4, 1847 – June 29, 1850 | Seat declared vacant |
Vacant |
June 29, 1850 - December 20, 1850 | ||
 |
December 20, 1850 – March 3, 1851 | ||
|
Democratic | March 4, 1851 – March 3, 1855 | |
 |
Democratic | March 4, 1855 – March 3, 1857 | |
 |
Republican | March 4, 1857 – August 4, 1861 | Resigned to serve in the Civil War |
Vacant |
August 4, 1861 - October 8, 1861 | ||
 |
Republican | October 8, 1861 – March 3, 1869 | |
 |
Republican | March 4, 1869 – March 3, 1877 | |
 |
Republican | March 4, 1877 – March 3, 1879 | |
 |
Republican | March 4, 1879 – March 3, 1885 | |
|
Democratic | March 4, 1885 – March 3, 1887 | |
 |
Republican | March 4, 1887 – March 3, 1891 | |
|
Democratic | March 4, 1891 – March 3, 1893 | |
|
Republican | March 4, 1893 – March 3, 1895 | |
|
Republican | March 4, 1895 – March 3, 1899 | |
 |
Republican | March 4, 1899 – March 3, 1907 | |
|
Republican | March 4, 1907 – March 3, 1921 | |
 |
Republican | March 4, 1921 – March 3, 1933 | |
 |
Democratic | March 4, 1933 – December 2, 1938 | Resigned after being appointed as a commissioner of the Securities and Exchange Commission |
Vacant |
December 2, 1938 - January 3, 1939 | ||
 |
Republican | January 3, 1939 – January 3, 1955 | |
 |
Republican | January 3, 1955 – January 3, 1965 | |
 |
Democratic | January 3, 1965 – January 3, 1967 | |
|
Republican | January 3, 1967 – January 3, 1973 | |
 |
Democratic | January 3, 1973 – January 3, 1977 | |
 |
Republican | January 3, 1977 – January 3, 2003 | Redistricted to the 2nd district |
 |
Republican | January 3, 2003 – January 3, 2007 | Redistricted from the 2nd district |
 |
Democratic | January 3, 2007 – January 3, 2015 | |
 |
Republican | January 3, 2015 –present | Incumbent |
Historical election results
| Year[4] | Party affiliation | Winner | Number of votes | Party affiliation | Loser | Number of votes | Percentage of votes |
|---|---|---|---|---|---|---|---|
| 1920 | Republican | William F. Kopp | 38,100 | Democrat | E.W. McManus | 20,977 | 64% - 36% |
| 1922 | Republican | William F. Kopp | 26,651 | Democratic | John M. Lindley | 14,056 | 65% - 34% |
| 1924 | Republican | William F. Kopp | 42,711 | Democratic | James M. Bell | 17,110 | 71% - 29% |
| 1926 | Republican | William F. Kopp | 27,358 | Democratic | James M. Bell | 11,408 | 71% - 29% |
| 1928 | Republican | William F. Kopp | 45,806 | N/A | No Opponent | N/A | 100% - 0% |
| 1930 | Republican | William F. Kopp | 27,053 | Democratic | Max A. Conrad | 15,538 | 63% - 36% |
| 1932 | Democratic | Edward C. Eicher | 55,378 | Republican | William F. Kopp | 46,738 | 54% - 46% |
| 1934 | Democratic | Edward C. Eicher | 48,544 | Republican | E. R. Hicklin | 39,047 | 55% - 44% |
| 1936 | Democratic | Edward C. Eicher | 55,721 | Republican | John N. Calhoun | 53,474 | 51% - 49% |
| 1938 | Republican | Thomas E. Martin | 46,636 | Democratic | James P. Gaffney | 33,765 | 58% - 42% |
| 1940 | Republican | Thomas E. Martin | 70,120 | Democratic | Zoe S. Nabers | 46,040 | 60% - 40% |
| 1942 | Republican | Thomas E. Martin | 55,139 | Democratic | Vern W. Nall | 32,893 | 61% - 37% |
| 1944 | Republican | Thomas E. Martin | 72,729 | Democratic | Clair A. Williams | 60,048 | 55% - 45% |
| 1946 | Republican | Thomas E. Martin | 52,488 | Democratic | Clair A. Williams | 32,849 | 62% - 38% |
| 1948 | Republican | Thomas E. Martin | 70,959 | Democratic | James D. France | 60,860 | 53% - 46% |
| 1950 | Republican | Thomas E. Martin | 70,058 | Democratic | James D. France | 43,140 | 62% - 38% |
| 1952 | Republican | Thomas E. Martin | 105,526 | Democratic | Clair A. Williams | 62,011 | 63% - 37% |
| 1954 | Republican | Fred Schwengel | 67,128 | Democratic | John O'Connor | 50,577 | 57% - 43% |
| 1956 | Republican | Fred Schwengel | 94,223 | Democratic | Ronald O. Bramhall | 68,287 | 58% - 42% |
| 1958 | Republican | Fred Schwengel | 59,577 | Democratic | Thomas J. Dailey | 51,996 | 53% - 47% |
| 1960 | Republican | Fred Schwengel | 104,737 | Democratic | Walter J. Guenther | 67,287 | 61% - 39% |
| 1962 | Republican | Fred Schwengel | 65,975 | Democratic | Harold Stephens | 42,000 | 61% - 39% |
| 1964 | Democratic | John R. Schmidhauser | 84,042 | Republican | Fred Schwengel | 80,697 | 51% - 49% |
| 1966 | Republican | Fred Schwengel | 64,795 | Democratic | John R. Schmidhauser | 60,534 | 51% - 48% |
| 1968 | Republican | Fred Schwengel | 91,419 | Democratic | John R. Schmidhauser | 81,049 | 53% - 47% |
| 1970 | Republican | Fred Schwengel | 60,270 | Democratic | Edward Mezvinsky | 59,505 | 50% - 49% |
| 1972 | Democratic | Edward Mezvinsky | 107,099 | Republican | Fred Schwengel | 91,609 | 53% - 46% |
| 1974 | Democratic | Edward Mezvinsky | 75,687 | Republican | Jim Leach | 63,540 | 54% - 46% |
| 1976 | Republican | Jim Leach | 109,694 | Democratic | Edward Mezvinsky | 101,024 | 52% - 48% |
| 1978 | Republican | Jim Leach | 79,940 | Democratic | Richard E. Meyers | 45,037 | 63% - 36% |
| 1980 | Republican | Jim Leach | 133,349 | Democratic | Jim Larew | 72,602 | 64% - 35% |
| 1982 | Republican | Jim Leach | 89,595 | Democratic | Bill Gluba | 61,734 | 59% - 41% |
| 1984 | Republican | Jim Leach | 131,182 | Democratic | Kevin Ready | 65,293 | 68% - 33% |
| 1986 | Republican | Jim Leach | 86,834 | Democratic | John R. Whitaker | 43,985 | 66% - 34% |
| 1988 | Republican | Jim Leach | 112,746 | Democratic | Bill Gluba | 71,280 | 61% - 38% |
| 1990 | Republican | Jim Leach | 90,042 | Scattering | Scattering | 151 | 99% - 1% |
| 1992 | Republican | Jim Leach | 178,042 | Democratic | Jan J. Zonneveld | 81,600 | 68% - 31% |
| 1994 | Republican | Jim Leach | 110,448 | Democratic | Glen Winekauf | 69,461 | 60% - 38% |
| 1996 | Republican | Jim Leach | 129,242 | Democratic | Bob Rush | 111,595 | 53% - 46% |
| 1998 | Republican | Jim Leach | 106,419 | Democratic | Bob Rush | 79,529 | 57% - 42% |
| 2000 | Republican | Jim Leach | 164,972 | Democratic | Bob Simpson | 96,283 | 62% - 36% |
| 2002 | Republican | Jim Nussle | 112,280 | Democratic | Ann Hutchinson | 83,779 | 57% - 43% |
| 2004 | Republican | Jim Nussle | 159,993 | Democratic | Bill Gluba | 125,490 | 55% - 44% |
| 2006 | Democratic | Bruce Braley | 113,724 | Republican | Mike Whalen | 89,471 | 56% - 44% |
| 2008 | Democratic | Bruce Braley | 178,229 | Republican | David Hartsuch | 99,447 | 64% - 35% |
| 2010 | Democratic | Bruce Braley | 103,931[5] | Republican | Ben Lange | 99,976 | 49% - 48% |
| 2012 | Democratic | Bruce Braley | 222,422 | Republican | Ben Lange | 162,465 | 57% - 42% |
| 2014 | Republican | Rod Blum | 147,513 | Democratic | Pat Murphy | 140,086 | 51%-49% |
| 2016 | Republican | Rod Blum | 206,903 | Democratic | Monica Vernon | 177,403 | 53.7%-46.1% |
Recent election results
2002
| Party | Candidate | Votes | % | |
|---|---|---|---|---|
| Republican | Jim Nussle | 112,280 | 57.15 | |
| Democratic | Ann Hutchinson | 83,779 | 42.65 | |
| No party | Others | 396 | 0.20% | |
| Total votes | 196,455 | 100.00 | ||
| Turnout | ||||
| Republican hold | ||||
2004
| Party | Candidate | Votes | % | |
|---|---|---|---|---|
| Republican | Jim Nussle* | 159,993 | 55.16 | |
| Democratic | Bill Gluba | 125,490 | 43.26 | |
| Libertarian | Mark Nelson | 2,727 | 0.94 | |
| Independent | Denny Heath | 1,756 | 0.61 | |
| No party | Others | 88 | 0.03% | |
| Total votes | 290,054 | 100.00 | ||
| Turnout | ||||
| Republican hold | ||||
2006
| Party | Candidate | Votes | % | |||
|---|---|---|---|---|---|---|
| Democratic | Bruce Braley | 114,322 | 55.06 | |||
| Republican | Mike Whalen | 89,729 | 43.22 | |||
| Independent | James Hill | 2,201 | 1.06 | |||
| Libertarian | Albert W. Schoeman | 1,226 | 0.59 | |||
| No party | Others | 143 | 0.07% | |||
| Total votes | 207,621 | 100.00 | ||||
| Turnout | ||||||
| Democratic gain from Republican | ||||||
- NOTE: James Hill ran on the Pirate Party platform on the ballot.
2008
| Party | Candidate | Votes | % | |
|---|---|---|---|---|
| Democratic | Bruce Braley* | 186,991 | 64.56 | |
| Republican | David Hartsuch | 102,439 | 35.37 | |
| No party | Others | 199 | 0.07% | |
| Total votes | 289,629 | 100.00 | ||
| Turnout | ||||
| Democratic hold | ||||
2010
| Party | Candidate | Votes | % | |
|---|---|---|---|---|
| Democratic | Bruce Braley* | 104,428 | 49.52 | |
| Republican | Ben Lange | 100,219 | 47.52 | |
| Libertarian | Rob Petsche | 4,087 | 1.94 | |
| Independent | Jason A. Faulkner | 2,092 | 0.99 | |
| No party | Others | 76 | 0.04% | |
| Total votes | 210,902 | 100.00 | ||
| Turnout | ||||
| Democratic hold | ||||
2012
| Party | Candidate | Votes | % | |
|---|---|---|---|---|
| Democratic | Bruce Braley* | 222,422 | 54.90 | |
| Republican | Ben Lange | 162,465 | 40.10 | |
| Independent | Gregory Hughes | 4,772 | 1.18 | |
| Independent | George Todd Krail II | 931 | 0.23 | |
| No party | Others | 259 | 0.06% | |
| Total votes | 405,110 | 100.00 | ||
| Turnout | ||||
| Democratic hold | ||||
2014
| Party | Candidate | Votes | % | |||
|---|---|---|---|---|---|---|
| Republican | Rod Blum | 145,383 | 51.18 | |||
| Democratic | Pat Murphy | 138,335 | 48.70 | |||
| No party | Others | 348 | 0.12% | |||
| Total votes | 284,066 | 100.00 | ||||
| Republican gain from Democratic | ||||||
2016
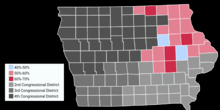
Map showing the results of the 2016 election in Iowa's First congressional district by County
| Party | Candidate | Votes | % | |
|---|---|---|---|---|
| Republican | Rod Blum | 206,903 | 53.7 | |
| Democratic | Monica Vernon | 177,403 | 46.1 | |
| No party | Others | 671 | 0.2% | |
| Total votes | 384,977 | 100.00 | ||
| Republican hold | ||||
Living former members of the U.S. House of Representatives from Iowa's 1st congressional district
As of March 2018, four former members of the U.S. House of Representatives from Iowa's 1st congressional district are alive.
| Representative | Term of office | Date of birth (and age) |
|---|---|---|
| Edward Mezvinsky | 1973–1977 | January 17, 1937 |
| Jim Leach | 1977–2003 | October 15, 1942 |
| Jim Nussle | 2003–2007 | June 27, 1960 |
| Bruce Braley | 2007–2015 | October 30, 1957 |
Historical district boundaries
See also
References
- 1 2 Washington Post page on the 1st District of Iowa
- ↑ "Partisan Voting Index – Districts of the 115th Congress" (PDF). The Cook Political Report. April 7, 2017. Retrieved April 7, 2017.
- ↑ "2001 Iowa Redistricting Plan,". Iowa General Assembly. 2001.
- ↑ "Election Statistics,". 2005. Archived from the original on 2007-07-25.
- ↑ CBS News http://www.cbsnews.com/election2010/state.shtml?state=IA. Missing or empty
|title=(help)
- Martis, Kenneth C. (1989). The Historical Atlas of Political Parties in the United States Congress. New York: Macmillan Publishing Company.
- Martis, Kenneth C. (1982). The Historical Atlas of United States Congressional Districts. New York: Macmillan Publishing Company.
- Congressional Biographical Directory of the United States 1774–present
Coordinates: 42°31′40″N 91°53′46″W / 42.52778°N 91.89611°W
This article is issued from
Wikipedia.
The text is licensed under Creative Commons - Attribution - Sharealike.
Additional terms may apply for the media files.