In vivo magnetic resonance spectroscopy
In vivo magnetic resonance spectroscopy (MRS) is a specialized technique associated with magnetic resonance imaging (MRI).[1][2]
Magnetic resonance spectroscopy (MRS), also known as nuclear magnetic resonance (NMR) spectroscopy, is a non-invasive, ionizing-radiation-free analytical technique that has been used to study metabolic changes in brain tumors, strokes, seizure disorders, Alzheimer's disease, depression and other diseases affecting the brain. It has also been used to study the metabolism of other organs such as muscles. In the case of muscles, NMR is used to measure the intramyocellular lipids content (IMCL).[3]
Magnetic resonance spectroscopy is an analytical technique that can be used to complement the more common magnetic resonance imaging (MRI) in the characterization of tissue. Both techniques typically acquire signal from hydrogen protons (other endogenous nuclei such as those of Carbon, Nitrogen, and Phosphorus are also used), but MRI acquires signal from primarily from protons which reside within water and fat, which are approximately a thousand times more abundant than the molecules detected with MRS. As a result MRI often uses the larger available signal to produce very clean 2D images, whereas MRS very frequently only acquires signal from a single localized region, referred to as a "voxel". MRS can be used to determine the relative concentrations and physical properties of a variety of biochemicals frequently referred to as "metabolites" due to their role in metabolism.
Data acquisition
Acquiring an MRS scan is very similar to that of MRI with a few additional steps preceding data acquisition. These steps include:
- Shimming the magnetic field: this step is taken to correct for the inhomogeneity of the magnetic field by tuning different pulses in the x, y, and z directions. This step is usually automated but can be performed manually.
- Suppressing the water signal: because water molecules contain hydrogen, and the relative concentration of water to metabolite is about 10,000:1, the water signal is often suppressed or the metabolite peaks will not be discernible in the spectra. This is achieved by adding water suppression pulses. Recent advances allow proton MRS without water suppression.[4]
- Choosing a spectroscopic technique: careful planning of measurements is important in the context of a specific experiment.
- Single Voxel Spectroscopy (SVS): has a minimum spatial resolution of approximately 1 cm3, and has the cleanest spectrum free from unwanted artifacts due to the small acquired volume.
- Magnetic Resonance Spectroscopic Imaging (MRSI): a 2-dimensional MRS technique which uses two phase-encoding directions to create a two-dimensional map of spectra. The drawbacks of this technique is that having two phase encoding directions requires lengthy scan time, and the larger volume of acquisition is more likely to introduce artefacts due to poorer shimming, unsuppressd water, as well as the inherent sinc point-spread-function due to the finite sampling of k-space which results in the signal from one voxel bleeding into all others.
Pulse Sequences
Similar to MRI, MRS uses pulse sequences to acquire signal from several different molecules to generate a spectra instead of an image. In MRS, STEAM (Stimulated Echo Acquisition Method) and PRESS (Point Resolved Spectroscopy) are the two primary pulse sequence techniques used. STEAM involves the acquisition of a stimulated echo by three 90° pulses. Meanwhile, PRESS entails a second echo acquired by a 90° excitation pulse followed by two 180° refocusing pulses.
Both of these techniques obtain their signal from the intersection of the three orthogonal planes, a singular voxel, of the slice-selective pulses.
In terms of advantages, STEAM is best for imaging metabolites with shorter T2 and has lower SAR, while PRESS has higher SNR than STEAM.
However, both STEAM and PRESS have their fair share of disadvantages. In STEAM, half of the signal is not used because acquisition is done by a stimulated echo. As a result, STEAM has 50% lower SNR than that of PRESS. In PRESS, the two chief drawbacks are lengthy echo time (TE) and chemical shift displacement (CSD) artifacts.[5] Lengthy echo time arises from the fact that PRESS uses two 180° pulses, unlike STEAM which uses exclusively 90° pulses. The duration of 180° pulses are generally longer than 90° pulses because it takes more energy to flip a net magnetization vector completely as opposed to only 90°. Chemical shift displacement artifacts arises partly because of less optimal slice selection profiles. Multiple 180° pulses does not allow a very short TE, resulting in less optimal slice selection profile. Additionally, multiple 180° pulses means smaller bandwidth and thus larger chemical shift displacement. Specifically, the chemical shift displacement artifacts occur because signals with different chemical shifts experience different frequency-encoded slice selections and thus do not originate from same volume. Additionally, this effect becomes greater at higher magnetic field strengths.
The PRESS sequence is the method of choice over STEAM for single-voxel spectroscopy (SVS) in 1H MRS.[5] However, STEAM is the dominate sequence for experiments with short TE and exact volume selection.
Besides STEAM and PRESS as the principal sequences used in in vivo magnetic resonance spectroscopy, there are adiabatic pulses. Adiabatic pulses produce uniform flip angles when there is extreme B1 inhomogeneity. Thus, these sequences allow us to achieve excitation that achieves the sought-for B1 insensitivity and off-resonance in the RF coil and sampled object. Specifically, adiabatic pulses solve the problem of signal dropout that comes from the different B1 flux patterns that result from the surface transmit coils used and the usage of normal pulses.[6] Adiabatic pulses are also useful for constraints on RF peak power for excitation and lowering tissue heating.
Uses
MRS allows doctors and researchers to obtain biochemical information about the tissues of the human body in a non-invasive way (without the need for a biopsy), whereas MRI only gives them information about the structure of the body (the distribution of water and fat).[7]
For example, whereas MRI can be used to assist in the diagnosis of cancer, MRS could potentially be used to assist in information regarding to the aggressiveness of the tumor.[8] Furthermore because many pathologies appear similar in diagnostic imaging (such as radiation-induced necrosis and recurring tumor following radiotherapy), MRS may in the future be used to assist in distinguishing between similarly-appearing prognoses.
MRS equipment can be tuned (just like a radio receiver) to pick up signals from different chemical nuclei within the body. The most common nuclei to be studied are protons (hydrogen), phosphorus, carbon, sodium and fluorine.
The types of biochemicals (metabolites) which can be studied include choline-containing compounds (which are used to make cell membranes), creatine (a chemical involved in energy metabolism), inositol and glucose (both sugars), N-acetylaspartate, and alanine and lactate which are elevated in some tumors.
At present MRS is mainly used as a tool by scientists (e.g. medical physicists and biochemists) for medical research projects, but it is becoming clear that it also has the ability to give doctors useful clinical information, especially with the discovery that it can be used to probe the concentration of alpha-Hydroxyglutaric acid, which is only present in IDH1 and IDH2 mutated gliomas, which alters the prescribed treatment regimen.
MRS is currently used to investigate a number of diseases in the human body, most notably cancer (in brain, breast and prostate), epilepsy, Alzheimer's Disease, Parkinson's disease and Huntington's chorea. MRS has been used to diagnose pituitary tuberculosis.[9]
Prostate cancer: Combined with a magnetic resonance imaging (MRI) and given equal results, then the three-dimensional MRS can predict the prevalence of a malignant degeneration of prostate tissue by approximately 90%. The combination of both methods may be helpful in the planning of biopsies and therapies of the prostate, as well as to monitor the success of a therapy.[10]
Example
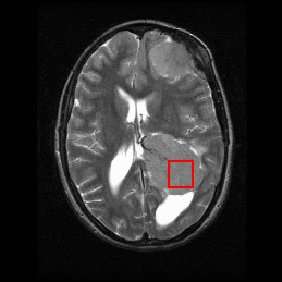
Shown below is an MRI brain scan (in the axial plane, that is slicing from front-to-back and side-to-side through the head) showing a brain tumor (meningioma) at the bottom right. The red box shows the volume of interest from which chemical information was obtained by MRS (a cube with 2 cm sides which produces a square when intersecting the 5 mm thick slice of the MRI scan).
Each biochemical, or metabolite, has a different peak in the spectrum which appears at a known frequency. The peaks corresponding to the amino acid alanine, are highlighted in red (at 1.4 ppm). This is an example of the kind of biochemical information which can help doctors to make their diagnosis. Other metabolites of note are choline (3.2 ppm) and creatine (3.0 ppm).
Applications of MRS
In 1H Magnetic Resonance Spectroscopy each proton can be visualized at a specific chemical shift (peak position along x-axis) depending on its chemical environment. This chemical shift is dictated by neighboring protons within the molecule. Therefore, metabolites can be characterized by their unique set of 1H chemical shifts. The metabolites that MRS probes for have known (1H) chemical shifts that have previously been identified in NMR spectra. These metabolites include:
- N-acetyl Aspartate (NAA): with its major resonance peak at 2.02 ppm, decrease in levels of NAA indicate loss or damage to neuronal tissue, which results from many types of insults to the brain. Its presence in normal conditions indicates neuronal and axonal integrity.
- Choline: with its major peak at 3.2 ppm, choline is known to be associated with membrane turnover, or increase in cell division. Increased choline indicates increase in cell production or membrane breakdown, which can suggest demyelination or presence of malignant tumors.
- Creatine and phosphocreatine: with its major peak at 3.0 ppm, creatine marks metabolism of brain energy. Gradual loss of creatine in conjunction with other major metabolites indicates tissue death or major cell death resulting from disease, injury or lack of blood supply. Increase in creatine concentration could be a response to cranialcerebral trauma. Absence of creatine may be indicative of a rare congenital disease.
- Lipids: with their major aliphatic peaks located in the 0.9–1.5 ppm range, increase in lipids is seen is also indicative of necrosis. These spectra are easily contaminated, as lipids are not only present in the brain, but also in other biological tissue such as the fat in the scalp and area between the scalp and skull.
- Lactate: Is an AX3 system which results in a doublet (two symmetric peaks) centered about 1.31 ppm, and a quartet (four peaks with relative peak heights of 1:2:2:1) centered about 4.10 ppm. The doublet at 1.31 ppm is typically quantified as the quartet may be suppressed through water saturation or obscured by residual water. In healthy subjects lactate is not visible, for its concentration is lower that the detection limit of MRS; however, presence of this peak indicates glycolysis has been initiated in an oxygen-deficient environment. Several causes of this include ischemia, hypoxia, mitochondrial disorders, and some types of tumors.
- Myo-inositol: with its major peak at 3.56 ppm, an increase in Myo-inositol has been seen in patients with Alzheimer's, dementia, and HIV patients.
- Glutamate and glutamine: these amino acids are marked by a series of resonance peaks between 2.2 and 2.4 ppm. Hyperammonemia, hepatic encephalopathy are two major conditions that result in elevated levels of glutamine and glutamate. MRS, used in conjunction with MRI or some other imaging technique, can be used to detect changes in the concentrations of these metabolites, or significantly abnormal concentrations of these metabolites.
- GABA can be detected primarily from its peaks at approximately 3.0 ppm, however because creatine has a strong singlet at 3.0 ppm with approximately 20x the amplitude a technique which exploits J-coupling must be used to accurately quantify GABA. The most common techniques for this are J-difference editing (MEGA), or J-resolved (as used in JPRESS)
- Glutathione can also be detected from its peak at peak at 3.0 ppm, however similar to GABA it also must use a method which exploits J-coupling to remove the overlaying creatine signal.
See also
References
- ↑ Dappert A, Guenther RS, Peyrard S, eds. (1992). In-vivo magnetic resonance spectroscopy. Berlin: Springer-Verlag. ISBN 978-3-540-55029-7.
- ↑ Jansen JF, Backes WH, Nicolay K, Kooi ME (August 2006). "1H MR spectroscopy of the brain: absolute quantification of metabolites". Radiology. 240 (2): 318–32. doi:10.1148/radiol.2402050314. PMID 16864664.
- ↑ Preul MC, Caramanos Z, Collins DL, Villemure JG, Leblanc R, Olivier A, Pokrupa R, Arnold DL (March 1996). "Accurate, noninvasive diagnosis of human brain tumors by using proton magnetic resonance spectroscopy". Nature Medicine. 2 (3): 323–5. doi:10.1038/nm0396-323. PMID 8612232.
- ↑ Dong Z (April 2015). "Proton MRS and MRSI of the brain without water suppression". Progress in Nuclear Magnetic Resonance Spectroscopy. 86-87: 65–79. doi:10.1016/j.pnmrs.2014.12.001. PMID 25919199.
- 1 2 van der Graaf M (March 2010). "In vivo magnetic resonance spectroscopy: basic methodology and clinical applications". European Biophysics Journal. 39 (4): 527–40. doi:10.1007/s00249-009-0517-y. PMC 2841275. PMID 19680645.
- ↑ de Graaf RA, Luo Y, Terpstra M, Garwood M (November 1995). "Spectral editing with adiabatic pulses". Journal of Magnetic Resonance. Series B. 109 (2): 184–93. doi:10.1006/jmrb.1995.0008. PMID 7582600.
- ↑ Gujar SK, Maheshwari S, Björkman-Burtscher I, Sundgren PC (September 2005). "Magnetic resonance spectroscopy". Journal of Neuro-Ophthalmology. 25 (3): 217–26. PMID 16148633.
- ↑ Fanelli A (2016). "Xenograft Models: In vivo imaging". Retrieved 3 December 2017.
- ↑ Saini KS, Patel AL, Shaikh WA, Magar LN, Pungaonkar SA (August 2007). "Magnetic resonance spectroscopy in pituitary tuberculoma". Singapore Medical Journal. 48 (8): 783–6. PMID 17657390.
- ↑ Mueller-Lisse UG, Scherr M (June 2003). "1H-MR-Spektroskopie der Prostata: Ein Überblick" [1H magnetic resonance spectroscopy of the prostate]. Der Radiologe (in German). 43 (6): 481–8. doi:10.1007/s00117-003-0902-y. PMID 12827263.