Hockey stick graph
Hockey stick graphs present the global or hemispherical mean temperature record of the past 500 to 2000 years as shown by quantitative climate reconstructions based on climate proxy records. These reconstructions have consistently shown a slow long term cooling trend changing into relatively rapid warming in the 20th century, with the instrumental temperature record by 2000 exceeding earlier temperatures.
The term "hockey stick graph" was popularized by the climatologist Jerry Mahlman, to describe the pattern shown by the Mann, Bradley & Hughes 1999 (MBH99) reconstruction, envisaging a graph that is relatively flat with a downward trend to 1900 as forming an ice hockey stick's "shaft" followed by a sharp, steady increase corresponding to the "blade" portion.[1][2] The reconstructions have featured in Intergovernmental Panel on Climate Change (IPCC) reports as evidence of global warming. Arguments over the reconstructions have been taken up by fossil fuel industry funded lobbying groups attempting to cast doubt on climate science.[3]
Paleoclimatology dates back to the 19th century, and the concept of examining varves in lake beds and tree rings to track local climatic changes was suggested in the 1930s.[4] In the 1960s, Hubert Lamb generalised from historical documents and temperature records of central England to propose a Medieval Warm Period from around 900 to 1300, followed by Little Ice Age. This was the basis of a "schematic diagram" featured in the IPCC First Assessment Report of 1990 beside cautions that the medieval warming might not have been global. The use of indicators to get quantitative estimates of the temperature record of past centuries was developed, and by the late 1990s a number of competing teams of climatologists found indications that recent warming was exceptional. Bradley & Jones 1993 introduced the "Composite Plus Scaling" (CPS) method used by most later large-scale reconstructions.[5][6] Their study was featured in the IPCC Second Assessment Report of 1995.
In 1998 Michael E. Mann, Raymond S. Bradley and Malcolm K. Hughes developed new statistical techniques to produce Mann, Bradley & Hughes 1998 (MBH98), the first eigenvector-based climate field reconstruction (CFR). This showed global patterns of annual surface temperature, and included a graph of average hemispheric temperatures back to 1400 with shading emphasising that uncertainties (to two standard error limits) were much greater in earlier centuries.[7] Jones et al. 1998 independently produced a CPS reconstruction extending back for a thousand years, and Mann, Bradley & Hughes 1999 (MBH99) used the MBH98 methodology to extend their study back to 1000.[2][8]
A version of the MBH99 graph was featured prominently in the 2001 IPCC Third Assessment Report (TAR), which also drew on Jones et al. 1998 and three other reconstructions to support the conclusion that, in the Northern Hemisphere, the 1990s was likely to have been the warmest decade and 1998 the warmest year during the past 1,000 years.[8] The graph became a focus of dispute for those opposed to the strengthening scientific consensus that late 20th century warmth was exceptional.[9] In 2003, as lobbying over the 1997 Kyoto Protocol intensified, a paper claiming greater medieval warmth was quickly dismissed by scientists in the Soon and Baliunas controversy.[10] Later in 2003, Stephen McIntyre and Ross McKitrick published McIntyre & McKitrick 2003 disputing the data used in MBH98 paper. In 2004 Hans von Storch published criticism of the statistical techniques as tending to underplay variations in earlier parts of the graph, though this was disputed and he later accepted that the effect was very small.[11] In 2005 McIntyre and McKitrick published criticisms of the principal components analysis methodology as used in MBH98 and MBH99. Their analysis was subsequently disputed by published papers including Huybers 2005 and Wahl & Ammann 2007 which pointed to errors in the McIntyre and McKitrick methodology. Political disputes led to the formation of a panel of scientists convened by the National Research Council, their North Report in 2006 supported Mann's findings with some qualifications, including agreeing that there were some statistical failings but these had little effect on the result.[12]
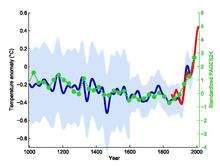
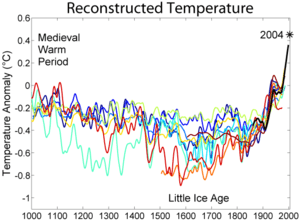
More than two dozen reconstructions, using various statistical methods and combinations of proxy records, support the broad consensus shown in the original 1998 hockey-stick graph, with variations in how flat the pre-20th century "shaft" appears.[12][13] The 2007 IPCC Fourth Assessment Report cited 14 reconstructions, 10 of which covered 1,000 years or longer, to support its strengthened conclusion that it was likely that Northern Hemisphere temperatures during the 20th century were the highest in at least the past 1,300 years.[14] Further reconstructions, including Mann et al. 2008 and PAGES 2k Consortium 2013, have supported these general conclusions.
Origins: the first paleoclimate reconstructions
Paleoclimatology influenced the 19th century physicists John Tyndall and Svante Arrhenius who found the greenhouse gas effect of carbon dioxide (CO2) in the atmosphere to explain how past ice ages had ended.[4] From 1919 to 1923, Alfred Wegener did pioneering work on reconstructing the climate of past eras in collaboration with Milutin Milanković,[15] publishing Die Klimate der geologischen Vorzeit (“The Climates of the Geological Past”) together with Wladimir Köppen, in 1924.[16] In the 1930s Guy Stewart Callendar compiled temperature records to look for changes. Wilmot H. Bradley showed that annual varves in lake beds showed climate cycles, and A. E. Douglass found that tree rings could track past climatic changes but these were thought to only show random variations in the local region. It was only in the 1960s that accurate use of tree rings as climate proxies for reconstructions was pioneered by Harold C. Fritts.[4]
In 1965 Hubert Lamb, a pioneer of historical climatology, generalised from temperature records of central England by using historical, botanical and archeological evidence to popularise the idea of a Medieval Warm Period from around 900 to 1300, followed by a cold epoch culminating between 1550 and 1700.[17][18] In 1972 he became the founding director of the Climatic Research Unit (CRU) in the University of East Anglia (UEA), which aimed to improve knowledge of climate history in both the recent and far distant past, monitor current changes in global climate, identify processes causing changes at different timescales, and review the possibility of advising about future trends in climate.[19] During the cold years of the 1960s, Lamb had anticipated that natural cycles were likely to lead over thousands of years to a future ice age, but after 1976 he supported the emerging view that greenhouse gas emissions caused by humanity would cause detectable global warming "by about A.D. 2000".[18]
The first quantitative reconstruction of Northern Hemisphere (NH) annual mean temperatures was published in 1979 by Brian Groveman and Helmut Landsberg. They used "a short-cut method" based on their earlier paper which showed that 9 instrumental stations could adequately represent an extensive gridded instrumental series, and reconstructed temperatures from 1579 to 1880 on the basis of their compilation of 20 time-series. These records were largely instrumental but also included some proxy records including two tree-ring series. Their method used nested multiple regression to allow for records covering different periods, and produced measures of uncertainty. The reconstruction showed a cool period extending beyond the Maunder Minimum, and warmer temperatures in the 20th century.[13][20] After this around a decade elapsed before Gordon Jacoby and Rosanne D'Arrigo produced the next quantitative NH reconstruction, published in 1989. This was the first based entirely on non-instrumental records, and used tree rings.[13] They reconstructed northern hemisphere annual temperatures since 1671 on the basis of boreal North American tree ring data from 11 distinct regions. From this, they concluded that recent warming was anomalous over the 300-year period, and went as far as speculating that these results supported the hypothesis that recent warming had human causes.[21]
IPCC First Assessment Report, 1990, supplement, 1992
Publicity over the concerns of scientists about the implications of global warming led to increasing public and political interest, and the Reagan administration, concerned in part about the political impact of scientific findings, successfully lobbied for the 1988 formation of the Intergovernmental Panel on Climate Change to produce reports subject to detailed approval by government delegates.[22] The IPCC First Assessment Report in 1990 noted evidence that Holocene climatic optimum around 5,000-6,000 years ago had been warmer than the present (at least in summer) and that in some areas there had been exceptional warmth during "a shorter Medieval Warm Period (which may not have been global)" about AD 950-1250, followed by a cooler period of the Little Ice Age which ended only in the middle to late nineteenth century. The report discussed the difficulties with proxy data, "mainly pollen remains, lake varves and ocean sediments, insect and animal remains, glacier termini" but considered tree ring data was "not yet sufficiently easy to assess nor sufficiently integrated with indications from other data to be used in this report." A "schematic diagram" of global temperature variations over the last thousand years[23] has been traced to a graph based loosely on Lamb's 1965 paper, nominally representing central England, modified by Lamb in 1982.[17] Mike Hulme describes this schematic diagram as "Lamb's sketch on the back of an envelope", a "rather dodgy bit of hand-waving".[24]
In Bradley et al. 1991, a working group of climatologists including Raymond S. Bradley, Malcolm K. Hughes, Jean Jouzel, Wibjörn Karlén, Jonathan Overpeck and Tom Wigley proposed a project to improve understanding of natural climatic variations over the last two thousand years so that their effect could be allowed for when evaluating human contributions to climate change. Climate proxy temperature data was needed at seasonal or annual resolution covering a wide geographical area to provide a framework for testing the part climate forcings had played in past variations, look for cycles in climate, and find if debated climatic events such as the Little Ice Age and Medieval Warm Period were global. Reconstructions were to be made of key climate systems, starting with three climatically sensitive regions: the Asian monsoon region, the El Niño–Southern Oscillation region and the Atlantic region. Areas where more data was needed were to be identified, and there was a need for improved data exchange with computer-based archiving and translation to give researchers access to worldwide paleoclimate information.[25]
The IPCC supplementary report, 1992, reviewed progress on various proxies. These included a study of 1,000 years of tree ring data from Tasmania which, like similar studies, did not allow for possible overestimate of warming due to increased CO2 levels having a fertilisation effect on tree growth. It noted the suggestion of Bradley et al. 1991 that instrumental records in specific areas could be combined with paleoclimate data for increased detail back to the 18th century.[26]
Composite plus scaling (CPS) reconstructions
Bradley and Jones 1993
Archives of climate proxies were developed: in 1993 Raymond S. Bradley and Phil Jones composited historical records, tree-rings and ice cores for the Northern Hemisphere from 1400 up to the 1970s to produce a decadal reconstruction.[27] Like later reconstructions including the MBH "hockey stick" studies, the Bradley & Jones 1993 reconstruction indicated a slow cooling trend followed by an exceptional temperature rise in the 20th century.[28] Their study also used the modern instrumental temperature record to evaluate how well the regions covered by proxies represented the northern hemisphere average, and compared the instrumental record with the proxy reconstruction over the same period. It concluded that the "Little Ice Age" period was complex, with evidence suggesting the influence of volcanic eruptions. It showed that temperatures since the 1920s were higher than earlier in the 500-year period, an indication of other factors which could most probably be attributed to human caused changes increasing levels of greenhouse gases.[29]
This paper introduced the "Composite Plus Scaling" (CPS) method which was subsequently used by most large-scale climate reconstructions of hemispheric or global average temperatures. In this method, also known as "Composite Plus Scale", selected climate proxy records were standardized before being averaged (composited), and then centred and scaled to provide a quantitative estimate of the target temperature series for the climate of the region or hemisphere over time. This method was implemented in various ways, including different selection processes for the proxy records, and averaging could be unweighted, or could be weighted in relation to an assessment of reliability or of area represented. There were also different ways of finding the scaling coefficient used to scale the proxy records to the instrumental temperature record.[30]
John A. Eddy had earlier tried to relate the rarity of sunspots during the Maunder Minimum to Lamb's estimates of past climate, but had insufficient information to produce a quantitative assessment. The problem was reexamined by Bradley in collaboration with solar physicists Judith Lean and Juerg Beer, using the findings of Bradley & Jones 1993. The Lean, Beer & Bradley 1995 paper confirmed that the drop in solar output appeared to have caused a temperature drop of almost 0.5 °C during the Little Ice Age, and increased solar output might explain the rise in early 20th century temperatures. A reconstruction of Arctic temperatures over four centuries by Overpeck et al. 1997 reached similar conclusions, but both these studies came up against the limitations of the climate reconstructions at that time which only resolved temperature fluctuations on a decadal basis rather than showing individual years, and produced a single time series so did not show a spatial pattern of relative temperatures for different regions.[31]
IPCC Second Assessment Report
The IPCC Second Assessment Report (SAR) of 1996 featured Figure 3.20 showing the Bradley & Jones 1993 decadal summer temperature reconstruction for the northern hemisphere, overlaid with a 50-year smoothed curve and with a separate curve plotting instrumental thermometer data from the 1850s onwards. It stated that in this record, warming since the late 19th century was unprecedented. The section proposed that "The data from the last 1000 years are the most useful for determining the scales of natural climate variability". Recent studies including the 1994 reconstruction by Hughes and Diaz questioned how widespread the Medieval Warm Period had been at any one time, thus it was not possible "to conclude that global temperatures in the Medieval Warm Period were comparable to the warm decades of the late 20th century." The SAR concluded, "it appears that the 20th century has been at least as warm as any century since at least 1400 AD. In at least some areas, the recent period appears to be warmer than has been the case for a thousand or more years".[32]
Tim Barnett of the Scripps Institution of Oceanography was working towards the next IPCC assessment with Phil Jones, and in 1996 told journalist Fred Pearce "What we hope is that the current patterns of temperature change prove distinctive, quite different from the patterns of natural variability in the past".[33]
A divergence problem affecting some tree ring proxies after 1960 had been identified in Alaska by Taubes 1995 and Jacoby & d'Arrigo 1995. Tree ring specialist Keith Briffa's February 1998 study showed that this problem was more widespread at high northern latitudes, and warned that it had to be taken into account to avoid overestimating past temperatures.[34]
Climate field reconstruction (CFR) methods; MBH 1998 and 1999
Variations on the "Composite Plus Scale" (CPS) method continued to be used to produce hemispheric or global mean temperature reconstructions. From 1998 this was complemented by Climate Field Reconstruction (CFR) methods which could show how climate patterns had developed over large spatial areas, making the reconstruction useful for investigating natural variability and long term oscillations as well as for comparisons with patterns produced by climate models. The CFR method made more use of climate information embedded in remote proxies, but was more dependent than CPS on assumptions that relationships between proxy indicators and large-scale climate patterns remained stable over time.[35]
Related rigorous statistical methods had been developed for tree ring data, with Harold C. Fritts publishing a 1991 study and a 1991 book showing methodology and examples of how to produces maps showing climate developments in North America over time. These methods had been used for regional reconstructions of temperatures, and other aspects such as rainfall.[36]
As part of his Phd research, Michael E. Mann worked with seismologist Jeffrey Park on developing statistical techniques for find long term oscillations of natural variability in the instrumental temperature record of global surface temperatures over the last 140 years; Mann & Park 1993 showed patterns relating to the El Niño–Southern Oscillation, and Mann & Park 1994 found what was later termed the Atlantic multidecadal oscillation. They then teamed up with Raymond S. Bradley to use these techniques on the dataset from his Bradley & Jones 1993 study with the aim of finding long term oscillations of natural variability in global climate. The resulting reconstruction went back to 1400, and was published in November as Mann, Park & Bradley 1995. They were able to detect that the multiple proxies were varying in a coherent oscillatory way, indicating both the multidecadal pattern in the North Atlantic and a longer term oscillation of roughly 250 years in the surrounding region. Their study did not calibrate these proxy patterns against a quantitative temperature scale, and a new statistical approach was needed to find how they related to surface temperatures in order to reconstruct past temperature patterns.[37][38]
Mann, Bradley and Hughes 1998
For his postdoctoral research Mann joined Bradley and tree ring specialist Malcolm K. Hughes to develop a new statistical approach to reconstruct underlying spatial patterns of temperature variation combining diverse datasets of proxy information covering different periods across the globe, including a rich resource of tree ring networks for some areas and sparser proxies such as lake sediments, ice cores and corals, as well as some historical records.[39]
Their global reconstruction was a major breakthrough in evaluation of past climate dynamics, and the first eigenvector-based climate field reconstruction (CFR) incorporating multiple climate proxy data sets of different types and lengths into a high-resolution global reconstruction.[7] To relate this data to measured temperatures, they used principal component analysis (PCA) to find the leading patterns, or principal components, of instrumental temperature records during the calibration period from 1902 to 1980. Their method was based on separate multiple regressions between each proxy record (or summary) and all of the leading principal components of the instrumental record. The least squares simultaneous solution of these multiple regressions used covariance between the proxy records. The results were then used to reconstruct large-scale patterns over time in the spatial field of interest (defined as the empirical orthogonal functions, or EOFs) using both local relationships of the proxies to climate and distant climate teleconnections.[30] Temperature records for almost 50 years prior to 1902 were analysed using PCA for the important step of validation calculations, which showed that the reconstructions were statistically meaningful, or skillful.[40]
A balance was required over the whole globe, but most of the proxy data came from tree rings in the Northern mid latitudes, largely in dense proxy networks. Since using all of the large numbers of tree ring records in would have overwhelmed the sparse proxies from the polar regions and the tropics, they used principal component analysis (PCA) to produce PC summaries representing these large datasets, and then treated each summary as a proxy record in their CFR analysis. Networks represented in this way included the North American tree ring network (NOAMER) and Eurasia.[41]
The primary aim of CFR methods was to provide the spatially resolved reconstructions essential for coherent geophysical understanding of how parts of the climate system varied and responded to radiative forcing, so hemispheric averages were a secondary product.[42] The CFR method could also be used to reconstruct Northern Hemisphere mean temperatures, and the results closely resembled the earlier CPS reconstructions including Bradley & Jones 1993.[7] Mann describes this as the least scientifically interesting thing they could do with the rich spatial patterns, but also the aspect that got the most attention. Their original draft ended in 1980 as most reconstructions only went that far, but an anonymous peer reviewer of the paper suggested that the curve of instrumental temperature records should be shown up to the present to include the considerable warming that had taken place between 1980 and 1998.[43]
The Mann, Bradley & Hughes 1998 (MBH98) multiproxy study on "Global-scale temperature patterns and climate forcing over the past six centuries" was submitted to the journal Nature on 9 May 1997, accepted on 27 February 1998 and published on 23 April 1998. The paper announced a new statistical approach to find patterns of climate change in both time and global distribution, building on previous multiproxy reconstructions. The authors concluded that "Northern Hemisphere mean annual temperatures for three of the past eight years are warmer than any other year since (at least) AD1400", and estimated empirically that greenhouse gases had become the dominant climate forcing during the 20th century.[44] In a review in the same issue, Gabriele C. Hegerl described their method as "quite original and promising", which could help to verify model estimates of natural climate fluctuations and was "an important step towards reconstructing space–time records of historical temperature patterns".[45]
Publicity and controversy on publication of MBH98
Release of the paper on 22 April 1998 was given exceptional media coverage, including questioning as to whether it proved that human influences were responsible for global warming. Mann would only agree that it was "highly suggestive" of that inference.[46] He said that "Our conclusion was that the warming of the past few decades appears to be closely tied to emission of greenhouse gases by humans and not any of the natural factors". Most proxy data are inherently imprecise, and Mann said "We do have error bars. They are somewhat sizable as one gets farther back in time, and there is reasonable uncertainty in any given year. There is quite a bit of work to be done in reducing these uncertainties." Climatologist Tom Wigley welcomed the progress made in the study, but doubted if proxy data could ever be wholly convincing in detecting the human contribution to changing climate.[47]
Phil Jones of the UEA Climatic Research Unit told the New York Times he was doubtful about adding the 150-year thermometer record to extend the proxy reconstruction, and compared this with putting together apples and oranges; Mann et al. said they used a comparison with the thermometer record to check that recent proxy data were valid. Jones thought the study would provide important comparisons with the findings of climate modeling, which showed a "pretty reasonable" fit to proxy evidence.[47] A commentary on MBH98 by Jones was published in Science on 24 April 1998. He noted that it used almost all the available long term proxy climate series, "and if the new multivariate method of relating these series to the instrumental data is as good as the paper claims, it should be statistically reliable." He discussed some of the difficulties, and emphasised that "Each paleoclimatic discipline has to come to terms with its own limitations and must unreservedly admit to problems, warts and all."[48]
The study was disputed by contrarian Pat Michaels with the claim that all of the warming took place between 1920 and 1935, before increased human greenhouse gas emissions.[49] The George C. Marshall Institute alleged that MBH98 was deceptive in only going back to 1400, and so not covering the Medieval Warm Period which predated industrial greenhouse gas emissions.[50] The same criticisms were made by Willie Soon and Sallie Baliunas.[51]
Pollack, Huang and Shen, Jones et al. 1998
In October 1998 the borehole reconstruction published by Pollack, Huang and Shen gave independent support to the conclusion that 20th century warmth was exceptional for the past 500 years.[52]
Jones, Keith Briffa, Tim P. Barnett and Simon Tett had independently produced a "Composite Plus Scale" (CPS) reconstruction extending back for a thousand years, comparing tree ring, coral layer, and glacial proxy records, but not specifically estimating uncertainties. Jones et al. 1998 was submitted to The Holocene on 16 October 1997; their revised manuscript was accepted on 3 February and published in May 1998. As Bradley recalls, Mann's initial view was that there was too little information and too much uncertainty to go back so far, but Bradley said "Why don't we try to use the same approach we used in Nature, and see if we could push it back a bit further?" Within a few weeks, Mann responded that to his surprise, "There is a certain amount of skill. We can actually say something, although there are large uncertainties."[1][53]
Mann, Bradley and Hughes 1999
In considering the 1998 Jones et al. reconstruction which went back a thousand years, Mann, Bradley and Hughes reviewed their own research and reexamined 24 proxy records which extended back before 1400. Mann carried out a series of statistical sensitivity tests, removing each proxy in turn to see the effect its removal had on the result. He found that certain proxies were critical to the reliability of the reconstruction, particularly one tree ring dataset collected by Gordon Jacoby and Rosanne D'Arrigo in a part of North America Bradley's earlier research had identified as a key region.[54] This dataset only extended back to 1400, and though another proxy dataset from the same region (in the International Tree-Ring Data Bank) went further back and should have given reliable proxies for earlier periods, validation tests only supported their reconstruction after 1400. To find out why, Mann compared the two datasets and found that they tracked each other closely from 1400 to 1800, then diverged until around 1900 when they again tracked each other. He found a likely reason in the CO2 "fertilisation effect" affecting tree rings as identified by Graybill and Idso, with the effect ending once CO2 levels had increased to the point where warmth again became the key factor controlling tree growth at high altitude. Mann used comparisons with other tree ring data from the region to produce a corrected version of this dataset. Their reconstruction using this corrected dataset passed the validation tests for the extended period, but they were cautious about the increased uncertainties.[55]
The Mann, Bradley and Hughes reconstruction covering 1,000 years (MBH99) was submitted in October 1998 to Geophysical Research Letters which published it in March 1999 with the cautious title Northern Hemisphere temperatures during the past millennium: inferences, uncertainties, and limitations to emphasise the increasing uncertainty involved in reconstructions of the period before 1400 when fewer proxies were available.[1][56] A University of Massachusetts Amherst news release dated 3 March 1999 announced publication in the 15 March issue of Geophysical Research Letters, "strongly suggesting that the 1990s were the warmest decade of the millennium, with 1998 the warmest year so far." Bradley was quoted as saying "Temperatures in the latter half of the 20th century were unprecedented", while Mann said "As you go back farther in time, the data becomes sketchier. One can’t quite pin things down as well, but, our results do reveal that significant changes have occurred, and temperatures in the latter 20th century have been exceptionally warm compared to the preceding 900 years. Though substantial uncertainties exist in the estimates, these are nonetheless startling revelations." While the reconstruction supported theories of a relatively warm medieval period, Hughes said "even the warmer intervals in the reconstruction pale in comparison with mid-to-late 20th-century temperatures."[57] The New York Times report had a colored version of the graph, distinguishing the instrumental record from the proxy evidence and emphasising the increasing range of possible error in earlier times, which MBH said would "preclude, as yet, any definitive conclusions" about climate before 1400.[58]
The reconstruction found significant variability around a long-term cooling trend of –0.02 °C per century, as expected from orbital forcing, interrupted in the 20th century by rapid warming which stood out from the whole period, with the 1990s "the warmest decade, and 1998 the warmest year, at moderately high levels of confidence." This was illustrated by the time series line graph Figure 2(a) which showed their reconstruction from AD 1000 to 1980 as a thin line, wavering around a thicker dark 40-year smoothed line. This curve followed a downward trend (shown as a thin dot-dashed line) from a Medieval Warm Period (about as warm as the 1950s) down to a cooler Little Ice Age before rising sharply in the 20th century. Thermometer data shown with a dotted line overlapped the reconstruction for a calibration period from 1902 to 1980, then continued sharply up to 1998. A shaded area showed uncertainties to two standard error limits, in medieval times rising almost as high as recent temperatures.[2][56][59] When Mann gave a talk about the study to the National Oceanic and Atmospheric Administration's Geophysical Fluid Dynamics Laboratory, Jerry Mahlman nicknamed the graph the "hockey stick",[1] with the slow cooling trend the "stick", and the anomalous 20th century warming the "blade".[28]
Critique and independent reconstructions
Briffa and Tim Osborn critically examined MBH99 in a May 1999 detailed study of the uncertainties of various proxies. They raised questions later adopted by critics of Mann's work, including the point that bristlecone pines from the Western U.S. could have been affected by pollution such as rising CO2 levels as well as temperature. The temperature curve was supported by other studies, but most of these shared the limited well dated proxy evidence then available, and so few were truly independent. The uncertainties in earlier times rose as high as those in the reconstruction at 1980, but did not reach the temperatures of later thermometer data. They concluded that although the 20th century was almost certainly the warmest of the millennium, the amount of anthropogenic warming remains uncertain."[60][61]
With work progressing on the next IPCC report, Chris Folland told researchers on 22 September 1999 that a figure showing temperature changes over the millennium "is a clear favourite for the policy makers' summary". Two graphs competed: Jones et al. (1998) and MBH99. In November, Jones produced a simplified figure for the cover of the short annual World Meteorological Organization report, which lacks the status of the more important IPCC reports. Two fifty-year smoothed curves going back to 1000 were shown, from MBH99 and Jones et al. (1998), with a third curve to 1400 from Briffa's new paper, combined with modern temperature data bringing the lines up to 1999: in 2010 the lack of a clarity about this change of data was criticised as misleading.[62]
Briffa's paper as published in the January 2000 issue of Quaternary Science Reviews showed the unusual warmth of the last century, but cautioned that the impact of human activities on tree growth made it subtly difficult to isolate a clear climate message.[63] In February 2000 Thomas J. Crowley and Thomas S. Lowery's reconstruction incorporated data not used previously. It reached the conclusion that peak Medieval warmth only occurred during two or three short periods of 20 to 30 years, with temperatures around 1950s levels, refuting claims that 20th century warming was not unusual.[64] An analysis by Crowley published in July 2000 compared simulations from an energy balance climate model with reconstructed mean annual temperatures from MBH99 and Crowley & Lowery (2000). While earlier reconstructed temperature variations were consistent with volcanic and solar irradiation changes plus residual variability, very large 20th-century warming closely agreed with the predicted effects of greenhouse gas emissions.[65]
Reviewing twenty years of progress in palaeoclimatology, Jones noted the reconstructions by Jones et al. (1998), MBH99, Briffa (2000) and Crowley & Lowery (2000) showing good agreement using different methods, but cautioned that use of many of the same proxy series meant that they were not independent, and more work was needed.[66]
IPCC Third Assessment Report, 2001
The Working Group 1 (WG1) part of the IPCC Third Assessment Report (TAR) included a subsection on multi-proxy synthesis of recent temperature change. This noted five earlier large-scale palaeoclimate reconstructions, then discussed the Mann, Bradley & Hughes 1998 reconstruction going back to 1400 AD and its extension back to 1000 AD in Mann, Bradley & Hughes 1999 (MBH99), while emphasising the substantial uncertainties in the earlier period. The MBH99 conclusion that the 1990s were likely to have been the warmest decade, and 1998 the warmest year, of the past millennium in the Northern Hemisphere, with "likely" defined as "66-90% chance", was supported by reconstructions by Crowley & Lowery 2000 and by Jones et al. 1998 using different data and methods. The Pollack, Huang & Shen 1998 reconstruction covering the past 500 years gave independent support for this conclusion, which was compared against the independent (extra-tropical, warm-season) tree-ring density NH temperature reconstruction of Briffa 2000.[8]
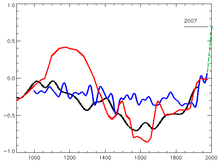
Its Figure 2.21 showed smoothed curves from the MBH99, Jones et al. and Briffa reconstructions, together with modern thermometer data as a red line and the grey shaded 95% confidence range from MBH99. Above it, figure 2.20 was adapted from MBH99.[8] Figure 5 in WG1 Technical Summary B (as shown to the right) repeated this figure without the linear trend line declining from AD 1000 to 1850.[67]
This iconic graph adapted from MBH99 was featured prominently in the WG1 Summary for Policymakers under a graph of the instrumental temperature record for the past 140 years. The text stated that it was "likely that, in the Northern Hemisphere, the 1990s was the warmest decade and 1998 the warmest year" in the past 1,000 years.[68] Versions of these graphs also featured less prominently in the short Synthesis Report Summary for Policymakers, which included a sentence stating that "The increase in surface temperature over the 20th century for the Northern Hemisphere is likely to have been greater than that for any other century in the last thousand years", and the Synthesis Report - Questions.[69]
The Working Group 1 scientific basis report was agreed unanimously by all member government representatives in January 2001 at a meeting held in Shanghai, China. A large poster of the IPCC illustration based on the MBH99 graph formed the backdrop when Sir John T. Houghton, as Co-Chair of the working group, presented the report in an announcement shown on television, leading to wide publicity.[1][70]
Scientific debates
The Huang, Pollack & Shen 2000 borehole temperature reconstruction covering the past five centuries supported the conclusion that 20th century warming was exceptional[71]
In a perspective commenting on MBH99, Wallace Smith Broecker argued that the Medieval Warm Period (MWP) was global. He attributed recent warming to a roughly 1500-year cycle which he suggested related to episodic changes in the Atlantic's conveyor circulation.[72]
A March 2002 tree ring reconstruction by Jan Esper et al. noted the debate, and Broecker's criticism that MBH99 did not show a clear MWP. They concluded that the MWP was likely to have been widespread in the extratropical northern hemisphere, and seemed to have approached late 20th century temperatures at times.[73] In an interview, Mann said the study did not contradict MBH as it dealt only with extratropical land areas, and stopped before the late 20th century. He reported that Edward R. Cook, a co-author on the paper, had confirmed agreement with these points,[74] and a later paper by Cook, Esper and D'Arrigo reconsidered the earlier paper's conclusions along these lines.[75]
Lonnie Thompson published a paper on "Tropical Glacier and Ice Core Evidence of Climate Change" in January 2003, featuring Figure 7 showing graphs based on ice cores closely resembling a graph based on the MBH99 reconstruction, combined with thermometer readings from Jones et al. 1999.[76]
RegEM climate field reconstruction
In March 2001 Tapio Schneider published his regularized expectation–maximization (RegEM) technique for analysis of incomplete climate data.[77] The original MBH98 and MBH99 papers avoided undue representation of large numbers of tree ring proxies by using a principal component analysis step to summarise these proxy networks, but from 2001 Mann stopped using this method and introduced a multivariate Climate Field Reconstruction (CFR) technique based on the RegEM method which did not require this PCA step. In May 2002 Mann and Scott Rutherford published a paper on testing methods of climate reconstruction which discussed this technique. By adding artificial noise to actual temperature records or to model simulations they produced synthetic datasets which they called "pseudoproxies". When the reconstruction procedure was used with these pseudoproxies, the result was then compared with the original record or simulation to see how closely it had been reconstructed. The paper discussed the issue that regression methods of reconstruction tended to underestimate the amplitude of variation.[78]
Controversy after IPCC Third Assessment Report
While the IPCC Third Assessment Report (TAR) drew on five reconstructions to support its conclusion that recent Northern Hemisphere temperatures were the warmest in the past 1,000 years, it gave particular prominence to an IPCC illustration based on the MBH99 paper.[68][70] The hockey stick graph was subsequently seen by mass media and the public as central to the IPCC case for global warming, which had actually been based on other unrelated evidence.[1] From an expert viewpoint the graph was, like all newly published science, preliminary and uncertain, but it was widely used to publicise the issue of global warming,[2][12] and it was targeted by those opposing ratification of the Kyoto Protocol on global warming.[1]
A literature review by Willie Soon and Sallie Baliunas, published in the relatively obscure journal Climate Research on 31 January 2003, used data from previous papers to argue that the Medieval Warm Period had been warmer than the 20th century, and that recent warming was not unusual. In March they published an extended paper in Energy & Environment, with additional authors.[79][80] The Bush administration's Council on Environmental Quality chief of staff Philip Cooney inserted references to the papers in the draft first Environmental Protection Agency Report on the Environment, and removed all references to reconstructions showing world temperatures rising over the last 1,000 years.[81] In the Soon and Baliunas controversy, two scientists cited in the papers said that their work was misrepresented,[79][80] and the Climate Research paper was criticised by many other scientists, including several of the journal's editors.[10] On 8 July Eos featured a detailed rebuttal of both papers by 13 scientists including Mann and Jones, presenting strong evidence that Soon and Baliunas had used improper statistical methods. Responding to the controversy, the publisher of Climate Research upgraded Hans von Storch from editor to editor in chief, but von Storch decided that the Soon and Baliunas paper was seriously flawed and should not have been published as it was. He proposed a new editorial system, and though the publisher of Climate Research agreed that the paper should not have been published uncorrected, he rejected von Storch's proposals to improve the editorial process, and von Storch with three other board members resigned.[79][82] Senator James M. Inhofe stated his belief that "manmade global warming is the greatest hoax ever perpetrated on the American people",[10][83] and a hearing of the United States Senate Committee on Environment and Public Works which he convened on 29 July 2003 heard the news of the resignations.[79][84]
Toronto businessman Stephen McIntyre downloaded datasets for MBH99, and obtained MBH98 datasets by request to Mann in April 2003.[85] At the suggestion of Sonja Boehmer-Christiansen, editor of the social science journal Energy & Environment, McIntyre wrote an article with the assistance of University of Guelph economics professor Ross McKitrick,[86][87] which Energy & Environment published on 27 October 2003.[88][89] The McIntyre & McKitrick 2003 paper (MM03) said that the Mann, Bradley & Hughes 1998 (MBH98) "hockey stick" shape was "primarily an artefact of poor data handling and use of obsolete proxy records."[90] Their criticism was comprehensively refuted by Wahl & Ammann 2007,[91] which showed errors in the methods used by McIntyre and McKitrick.[92]
The statistical methods used in the MBH reconstruction were questioned in a 2004 paper by Hans von Storch with a team including Eduardo Zorita,[93] which said that the methodology used to average the data and the wide uncertainties might have hidden abrupt climate changes, possibly as large as the 20th century spike in measured temperatures.[59] They used the pseudoproxy method which Mann and Rutherford had developed in 2002, and like them found that regression methods of reconstruction tended to underestimate the amplitude of variation, a problem covered by the wide error bars in MBH99. It was a reasonable critique of nearly all the reconstructions at that time, but MBH were singled out.[78] Other researchers subsequently found that the von Storch paper had an undisclosed additional step which, by detrending data before estimating statistical relationships, had removed the main pattern of variation.[94] The von Storch et al. view that the graph was defective overall was refuted by Wahl, Ritson and Ammann (2006).[91][95]
In 2004 McIntyre and McKitrick tried unsuccessfully to get an extended analysis of the hockey stick into the journal Nature.[96][97] At this stage Nature contacted Mann, Bradley, and Hughes, about minor errors in the online supplement to MBH98. In a corrigendum published on 1 July 2004 they acknowledged that McIntyre and McKitrick had pointed out errors in proxy data that had been included as supplementary information, and supplied a full corrected listing of the data. They included a documented archive of all the data used in MBH98, and expanded details of their methods. They stated that "None of these errors affect our previously published results."[98]
The McIntyre and McKitrick comment was accepted for publication by Geophysical Research Letters. McIntyre & McKitrick 2005 (MM05) reported a technical statistical error in the Mann, Bradley & Hughes 1998 (MBH98) method, which they said would produce hockey stick shapes from random data. This claim was given widespread publicity and political spin. Scientists found that the issues raised by McIntyre and McKitrick were minor and did not affect the main conclusions of MBH98 or Mann, Bradley & Hughes 1999.[91][96] Mann himself had already stopped using the criticised statistical method in 2001, when he changed over to the RegEM climate field reconstruction method.[99] To balance dense networks of tree-ring proxies against sparse proxy temperature records such as lake sediments, ice cores or corals, MBH 1998 (and 1999) used principal component analysis (PCA) to find the leading patterns of variation (PC1, PC2, PC3 etc.), with an objective method establish how many significant principal components should be kept so that the patterns put together characterized the original dataset.[100] McIntyre and McKitrick highlighted the effect of centering over the 1902–1980 period rather than the whole 1400–1980 period which would have changed the order of principal components so that the warming pattern of high altitude tree ring data was demoted from PC1 to PC4,[101] but instead of recalculating the objective selection rule which increased the number of significant PCs from two to five, they only kept PC1 and PC2. This removed the significant 20th century warming pattern of PC4, discarding data that produced the "hockey stick" shape,[102][103] Subsequent investigation showed that the "hockey stick" shape remained with the correct selection rule.[103]
The MM05 paper claimed that 1902–1980 centering would produce hockey stick shapes from "persistent red noise",[101] but their methods exaggerated the effect.[104] Tests of the MBH98 methodology on pseudoproxies formed with noise varying from red noise to white noise found that this effect caused only very small differences which were within the uncertainty range and had no significance for the final reconstruction.[105] McIntyre and McKitrick's code selected 100 simulations with the highest "hockey stick index" from the 10,000 simulations they had carried out, and their illustrations were taken from this pre-selected 1%.[106]
On 23 June 2005, Rep. Joe Barton, chairman of the House Committee on Energy and Commerce wrote joint letters with Ed Whitfield, Chairman of the Subcommittee on Oversight and Investigations, referring to the publicity and demanding full records on climate research, as well as personal information about their finances and careers, from the three scientists Mann, Bradley and Hughes.[107][108] Sherwood Boehlert, chairman of the House Science Committee, told his fellow Republican Joe Barton it was a "misguided and illegitimate investigation" apparently aimed at intimidating scientists. The U.S. National Academy of Sciences (NAS) president Ralph J. Cicerone proposed that the NAS should appoint an independent panel to investigate. Barton dismissed this offer,[109][110] but following Boehlert's November 2005 request, the National Academy of Science arranged for its National Research Council to set up a special committee chaired by Gerald North, to investigate and report.[111]
The North Report went through a rigorous review process,[112] and was published on 22 June 2006.[113] It concluded "with a high level of confidence that global mean surface temperature was higher during the last few decades of the 20th century than during any comparable period during the preceding four centuries", justified by consistent evidence from a wide variety of geographically diverse proxies, but "Less confidence can be placed in large-scale surface temperature reconstructions for the period from 900 to 1600".[71] It broadly agreed with the basic findings of the original MBH studies which had subsequently been supported by other reconstructions and proxy records, while emphasising uncertainties over earlier periods.[114] The contested principal component analysis methodology had a small tendency to bias results so was not recommended, but it had little influence on the final reconstructions, and other methods produced similar results.[115][116]
Barton's staffer contacted statistician Edward Wegman who produced the Wegman report with his graduate student Yasmin H. Said, and statistician David W. Scott, all statisticians with no expertise in climatology or other physical sciences.[117][118] The Wegman report was announced on 14 July 2006 in the Wall Street Journal,[119] and discussed at hearings of the United States House Energy Subcommittee on Oversight and Investigations on 19 July 2006,[119][120] and 27 July 2006.[121] The report was not properly peer reviewed. It reiterated McIntyre and McKitrick's claims on statistical failings in the MBH studies, but did not quantify whether correcting these points had any significant effect.[122] It included a social network analysis to allege a lack of independent peer review of Mann's work: this analysis has been discredited by expert opinion and found to have issues of plagiarism.[123][124]
Reconstructions 2003–2006
Using various high-resolution proxies including tree rings, ice cores and sediments, Mann and Jones published reconstructions in August 2003 which indicated that "late 20th century warmth is unprecedented for at least roughly the past two millennia for the Northern Hemisphere. Conclusions for the Southern Hemisphere and global mean temperature are limited by the sparseness of available proxy data in the Southern Hemisphere at present." They concluded that "To the extent that a ‘Medieval’ interval of moderately warmer conditions can be defined from about AD 800 – 1400, any hemispheric warmth during that interval is dwarfed in magnitude by late 20th century warmth."[125]
Borehole climate reconstructions in a paper by Pollack and Smerdon, published in June 2004, supported estimates of a surface warming of around 1 °C (1.8 °F) over the period from 1500 to 2000.[126]
In a study published in November 2004 Edward R. Cook, Jan Esper and Rosanne D'Arrigo re-examined their 2002 paper, and now supported MBH. They concluded that "annual temperatures up to AD 2000 over extra-tropical NH land areas have probably exceeded by about 0.3 °C the warmest previous interval over the past 1162 years".[75]
A study by Anders Moberg et al. published on 10 February 2005 used a wavelet transform technique to reconstruct Northern Hemisphere temperatures over the last 2,000 years, combining low-resolution proxy data such as lake and ocean sediments for century-scale or longer changes, with tree ring proxies only used for annual to decadal resolution. They found there had been a peak of temperatures around AD 1000 to 1100 similar to those reached in the years before 1990,[127] and supported the basic conclusion of MBH99 by stating "We find no evidence for any earlier periods in the last two millennia with warmer conditions than the post-1990 period".[128]
At the end of April 2005 Science published a reconstruction by J. Oerlemans based on glacier length records from different parts of the world, and found consistent independent evidence for the period from 1600 to 1990 supporting other reconstructions regarding magnitude and timing of global warming.[129]
On 28 February 2006 Wahl & Ammann 2006 was accepted for publication, and an "in press" copy was made available on the internet. Two more reconstructions were published, using different methodologies and supporting the main conclusions of MBH. Rosanne D'Arrigo, Rob Wilson and Gordon Jacoby suggested that medieval temperatures had been almost 0.7 °C cooler than the late 20th century but less homogenous,[130] Osborn and Briffa found the spatial extent of recent warmth more significant than that during the medieval warm period.[131][132] They were followed in April by a third reconstruction led by Gabriele C. Hegerl.[133]
IPCC Fourth Assessment Report, 2007
The IPCC Fourth Assessment Report (AR4) published in 2007 included a chapter on Paleoclimate, with a section on the last 2,000 years. This featured a graph showing 12 proxy based temperature reconstructions, including the three highlighted in the IPCC Third Assessment Report (TAR); Mann, Bradley & Hughes 1999 as before, Jones et al. 1998 and Briffa 2000 had both been calibrated by newer studies. In addition, analysis of the Medieval Warm Period cited reconstructions by Crowley & Lowery 2000 (as cited in the TAR) and Osborn & Briffa 2006. Ten of these 14 reconstructions covered 1,000 years or longer. Most reconstructions shared some data series, particularly tree ring data, but newer reconstructions used additional data and covered a wider area, using a variety of statistical methods. The section discussed the divergence problem affecting certain tree ring data.[14]
It concluded that "The weight of current multi-proxy evidence, therefore, suggests greater 20th-century warmth, in comparison with temperature levels of the previous 400 years, than was shown in the TAR. On the evidence of the previous and four new reconstructions that reach back more than 1 kyr, it is likely that the 20th century was the warmest in at least the past 1.3 kyr."[14] The SPM statement in the IPCC TAR of 2001 had been that it was "likely that, in the Northern Hemisphere, the 1990s was the warmest decade and 1998 the warmest year" in the past 1,000 years.[68] The AR4 SPM statement was that "Average Northern Hemisphere temperatures during the second half of the 20th century were very likely higher than during any other 50-year period in the last 500 years and likely the highest in at least the past 1,300 years. Some recent studies indicate greater variability in Northern Hemisphere temperatures than suggested in the TAR, particularly finding that cooler periods existed in the 12th to 14th, 17th and 19th centuries. Warmer periods prior to the 20th century are within the uncertainty range given in the TAR."[134]
Mann et al., 2008 and 2009
Further reconstructions were published, using additional proxies and different methodology. Juckes et al. 2007 and Lee, Zwiers & Tsao 2008 compared and evaluated the various statistical approaches.[135] In July 2008 Huang, Pollack and Shen published a suite of borehole reconstructions covering 20,000 years. They showed warm episodes in the mid-Holocene and the Medieval period, a little ice age and 20th century warming reaching temperatures higher than Medieval Warm Period peak temperatures in any of the reconstructions: they described this finding as consistent with the IPCC AR4 conclusions.[136]
In a paper published by PNAS on 9 September 2008, Mann and colleagues produced updated reconstructions of Earth surface temperature for the past two millennia.[35] This reconstruction used a more diverse dataset that was significantly larger than the original tree-ring study, at more than 1,200 proxy records. They used two complementary methods, both of which showed a similar "hockey stick" graph with recent increases in northern hemisphere surface temperature are anomalous relative to at least the past 1300 years. Mann said, "Ten years ago, the availability of data became quite sparse by the time you got back to 1,000 AD, and what we had then was weighted towards tree-ring data; but now you can go back 1,300 years without using tree-ring data at all and still get a verifiable conclusion."[137] In a PNAS response, McIntyre and McKitrick said that they perceived a number of problems, including that Mann et al used some data with the axes upside down.[138] Mann et al. replied that McIntyre and McKitrick "raise no valid issues regarding our paper" and the "claim that 'upside down' data were used is bizarre", as the methods "are insensitive to the sign of predictors." They also said that excluding the contentious datasets has little effect on the result.[139]
A study of the changing climate of the Arctic over the last 2,000 years, by an international consortium led by Darrell Kaufman of Northern Arizona University, was published on 4 September 2009. They examined sediment core records from 14 Arctic lakes, supported by tree ring and ice core records. Their findings showed a long term cooling trend consistent with cycles in the Earth's orbit which would be expected to continue for a further 4,000 years but had been reversed in the 20th century by a sudden rise attributed to greenhouse gas emissions. The decline had continued through the Medieval period and the Little Ice Age. The most recent decade, 1999–2008, was the warmest of the period, and four of the five warmest decades occurred between 1950 and 2000. Scientific American described the graph as largely replicating "the so-called 'hockey stick,' a previous reconstruction".[140]
Further support for the "hockey stick" graph came from a new method of analysis using Bayesian statistics developed by Martin Tingley and Peter Huybers of Harvard University, which produced the same basic shape, albeit with more variability in the past, and found the 1990s to have been the warmest decade in the 600-year period the study covered.[141]
2010 onwards
A 2,000 year extratropical Northern Hemisphere reconstruction by Ljungqvist published by Geografiska Annaler in September 2010 drew on additional proxy evidence to show both a Roman Warm Period and a Medieval Warm Period with decadal mean temperatures reaching or exceeding the reference 1961–1990 mean temperature level. Instrumental records of the period 1990–2010 were possibly above any temperature in the reconstruction period, though this did not appear in the proxy records. They concluded that their "reconstruction agrees well with the reconstructions by Moberg et al. (2005) and Mann et al. (2008) with regard to the amplitude of the variability as well as the timing of warm and cold periods, except for the period c. ad 300–800, despite significant differences in both data coverage and methodology."[142]
A 2010 opinion piece by David Frank, Jan Esper, Eduardo Zorita and Rob Wilson (Frank et al. 2010) noted that by then over two dozen large-scale climate reconstructions had been published, showing a broad consensus that there had been exceptional 20th century warming after earlier climatic phases, notably the Medieval Warm Period and Little Ice Age. There were still issues of large-scale natural variability to be resolved, especially for the lowest frequency variations, and they called for further research to improve expert assessment of proxies and to develop reconstruction methods explicitly allowing for structural uncertainties in the process.[13]
As several studies had noted, regression-based reconstruction methods tended to underestimate low-frequency variability. Bo Christiansen designed a new method (LOC) to overcome this problem, and with Ljungqvist used LOC to produce a 1,000 year reconstruction published in 2011. This showed more low frequency variability and a colder Little Ice Age than previous studies.[143] They then extended the LOC reconstruction back using selected proxies which had a documented relation to temperature and passed a screening procedure. This 2,000 year reconstruction, published in 2012, again showed more variability than earlier reconstructions. It found a homogenous Little Ice Age from 1580–1720 showing colder conditions in all areas, and a well defined but possibly less homogenous Medieval Warm Period peak around 950–1050, reaching or slightly exceeding mid 20th century temperatures as indicated by previous studies including Mann et al. 2008 and 2009.[144]
Ljungqvist et al. 2012 used a larger network of proxies than previous studies, including use low-resolution proxy data with as few as two data points per century, to produce a reconstruction showing centennial patterns of temperature variability in space and time for northern hemisphere land areas over the last 1,200 years. At this broad scale, they found widespread warmth from the 9th to 11th centuries approximating to the 20th century mean, with dominant cooling from the 16th to 18th centuries. The greatest warming occurred from the 19th to the 20th centuries, and they noted that instrumental records of recent decades were much warmer than the 20th century mean. Their spatial reconstruction showed similarities to the Mann et al. 2009 climate field reconstruction, though the different resolution meant these were not directly comparable. The results were robust, even when significant numbers of proxies were removed.[145]
Marcott et al. 2013 used seafloor and lake bed sediment proxies, which were completely independent of those used in earlier studies, to reconstruct global temperatures over the past 11,300 years, covering the entire Holocene, and showing over the last 1,000 years confirmation of the original MBH99 hockey stick graph.[146] Temperatures had slowly risen from the last ice age to reach a level which lasted from 10,000 to 5,000 years ago, then in line with Milankovitch cycles had begun a slow decline, interrupted by a small rise during the Medieval Warm Period, to the Little Ice Age. That decline had then been interrupted by a uniquely rapid rise in the 20th century to temperatures which were already the warmest for at least 4,000 years, within the range of uncertainties of the highest temperatures in the whole period, and on current estimates were likely to exceed those temperatures by 2100.[147]
See also
Notes
- 1 2 3 4 5 6 7 Monastersky 2006, p. 10.
- 1 2 3 4 Weart 2011c, The Hockey Stick and Beyond
- ↑ Pearce 2010, pp. 80–85, Connor 2013
- 1 2 3 Weart 2013
- ↑ Weart 2011c, Fingerprints (1990s-2000s)
- ↑ Jones et al. 2009.
- 1 2 3 Wahl & Ammann 2007
- 1 2 3 4 Folland et al. 2001, 2.3.2.2 Multi-proxy synthesis of recent temperature change Archived 2011-06-04 at the Wayback Machine.
- ↑ Pearce & 2010_pt3 "Part three: Hockey stick graph took pride of place in IPCC report, despite doubts".
- 1 2 3 Revkin, 5 August 2003 (NYT).
- ↑ The Decay of the Hockey Stick, Nature "Climate Feedback" blog post by von Storch. "... we do not think that McIntyre has substantially contributed in the published peer-reviewed literature to the debate about the statistical merits of the MBH and related method." (comment by von Storch & Zorita, May 7, 2007 07:35 PM, in response to multiple comments on their failure to acknowledge McIntyre and McKitrick's contributions)
- 1 2 3 Pearce & 2010_pt4, "Part four: Climate change debate overheated after sceptics grasped 'hockey stick'".
- 1 2 3 4 Frank et al. 2010.
- 1 2 3 Jansen et al. 2007, Section 6.6: The Last 2,000 Years.
- ↑ introduction to the English edition, The Climates of the Geological Past, (2015), retrieved August 28, 2015
- ↑ Köppen, W. & Wegener, A. (1924): Die Klimate der geologischen Vorzeit, Borntraeger Science Publishers. In English as The Climates of the Geological Past (2015).
- 1 2 3 Jones et al. 2009, pp. 34, 36.
- 1 2 Weart 2011c, Hubert Lamb; Lamb 1965
- ↑ Lamb, Clayton & Wigley 1997, pp. xxvii—xxix
- ↑ Landsberg, Groveman & Hakkarinen 1978, Groveman & Landsberg 1979
- ↑ Mann 2012, pp. 274–275.
Jacoby & D'Arrigo 1989. - ↑ Pearce 2010, pp. 37–39; Weart 2011o, Global Warming as a Political Issue (1980s)
- ↑ Folland et al. 1990, pp. 199–202.
- ↑ Pearce 2010, pp. 45–46.
- ↑ Bradley et al. 1991
- ↑ Folland et al. 1992
- ↑ Jones et al. 2009, p. 36.
- 1 2 Wahl & Ammann 2007.
- ↑ Bradley & Jones 1993.
- 1 2 Jones et al. 2009, pp. 21–22.
- ↑ Mann 2012, pp. 40–41
- ↑ Nicholls et al. 1996, pp. 173–176, fig 3.20; Hughes & Diaz 1994.
- ↑ Pearce 2010, p. 44.
- ↑ Briffa et al. 1998,
d'Arrigo et al. 2008 - 1 2 Mann et al. 2008
- ↑ Jones & Mann 2004
- ↑ Mann 2012, pp. 28–34, 270
- ↑ Mann, Park & Bradley 1995.
- ↑ Mann 2012, pp. 40–48
- ↑ Mann 2012, pp. 47–48
- ↑ Mann 2012, pp. 43, 45
- ↑ Ammann & Wahl 2007
- ↑ Mann 2012, pp. 43, 48
- ↑ Mann, Bradley & Hughes 1998
- ↑ Hegerl 1998
- ↑ Mann 2012, pp. 48–50
- 1 2 Stevens 1998.
- ↑ Jones 1998.
- ↑ Mann 2012, p. 106, Michaels 1998
- ↑ Marshall Institute 1998.
- ↑ Mann 2012, p. 106, Soon & Baliunas 1998, Mann 1998.
- ↑ Pollack, Huang & Shen 1998
- ↑ Jones et al. 1998
- ↑ Mann 2012, pp. 50–51; Jacoby & D'Arrigo 1989; Bradley 1996.
- ↑ Mann 2012, pp. 51–53; Graybill & Idso 1993.
- 1 2 Mann, Bradley & Hughes 1999
- ↑ UMass press release, 3 March 1999.
- ↑ Stevens 1999.
- 1 2 Weart 2011c, The influential 1999 "hockey stick" reconstruction
- ↑ Pearce 2010, pp. 50–51
- ↑ Briffa & Osborn 1999.
- ↑ Pearce 2010, p. 48; Jones and Davies, quoted in UEA press release, 24 Nov. 2009; ICCER 2010, pp. 59–60: "The WMO report is a short document produced annually. It does not have the status or importance of the IPCC reports."
- ↑ Briffa 2000
- ↑ Crowley & Lowery 2000
- ↑ Crowley 2000
- ↑ Jones 2000.
- ↑ Albritton et al. 2001, Technical Summary B Archived 2016-03-04 at the Wayback Machine., Figure 5 Archived 2012-09-30 at the Wayback Machine..
- 1 2 3 IPCC WG1 SPM 2001, Figure 1(b).
- ↑ IPCC TAR SYR 2001 Summary for Policymakers Archived 2013-04-04 at the Wayback Machine.: Question 2 Archived 2011-06-04 at the Wayback Machine., Figure SPM-10b Archived 2012-09-30 at the Wayback Machine., Question 9 Archived 2013-04-04 at the Wayback Machine.; Figure 9-1b Archived 2012-09-30 at the Wayback Machine., Figure 2-3 Archived 2012-09-30 at the Wayback Machine..
- 1 2 Kirby, 22 Jan. 2001 (BBC News)
- 1 2 North et al. 2006, pp. 1–3
- ↑ Broecker 2001
- ↑ Esper, Cook & Schweingruber 2002
- ↑ Mann, interviewed by Flatow, 29 March 2002 (NPR).
- 1 2 Cook, Esper & D'Arrigo 2004.
- ↑ Thompson et al. 2003.
- ↑ Schneider 2001
- 1 2 Mann 2012, pp. 104–105, 306; Mann & Rutherford 2002
- 1 2 3 4 Monastersky 2003.
- 1 2 Soon & Baliunas 2003.
- ↑ Revkin 2005, Waxman 2007
- ↑ Mann et al. 2003.
- ↑ Inhofe, 4 Jan. 2005 (speech); quoted in Congressional Record, 28 July 2003.
- ↑ HCEPW, 29 July 2003 (hearing).
- ↑ McIntyre, 28 Oct. 2003 (blog).
- ↑ McKitrick, Ross; McIntyre, Stephen (November 2003), Ross McKitrick, archived from the original on 27 November 2003, retrieved 10 September 2012
- ↑ Thacker 2005b.
Mann 2012, pp. 122–123. - ↑ Appell, David (2004), Quark Soup: Timing of M&M in E&E, archived from the original on 2 December 2003, retrieved 10 September 2012
- ↑ Mann 2012, p. 122
- ↑ McIntyre & McKitrick 2003a.
- 1 2 3 Weart 2011c, footnote 48, (p. 19, n1 in pdf).
- ↑ Jansen et al. 2007, Sec. 6.6.1.1: What Do Reconstructions Based on Palaeoclimatic Proxies Show?, p. 466.
- ↑ ICCER 2010, von Storch et al. 2004.
- ↑ Mann 2012, pp. 105, 295
- ↑ Wahl, Ritson & Ammann 2006.
- 1 2 Pearce 2010, pp. 93–96
- ↑ McIntyre, Stephen (2004), Welcome to Climate2003, archived from the original on 2 September 2004, retrieved 10 September 2012 , McIntyre, Stephen; McKitrick, Ross (1 July 2004), M&M03 Page, archived from the original on 12 September 2004, retrieved 10 September 2012
- ↑ Mann, Bradley & Hughes 2004, Mann 2012, pp. 304–305.
- ↑ Mann 2012, pp. 306–307
- ↑ Mann 2012, pp. 131–136
- 1 2 McIntyre & McKitrick 2005.
- ↑ Mann 2012, pp. 137, 306–307]
- 1 2 Wahl & Ammann 2007
- ↑ Huybers 2005
- ↑ von Storch & Zorita 2005.
- ↑ Mann 2012, pp. 242–243, 362–363
- ↑ HCEC, 23 June 2005; Barton & Whitfield 2005.
- ↑ Washington Post editorial, 23 July 2005, Hunting Witches".
- ↑ Eilperin, 18 July 2005 (Washington Post).
- ↑ Waxman, 1 July 2005 (letter).
- ↑ Revkin, 22 June 2006 (NYT).
- ↑ North et al. 2006, pp. viii, xi
- ↑ NAS press release, 22 June 2006.
- ↑ North et al. 2006, pp. 3–4
- ↑ North et al. 2006, pp. 112–116
- ↑ NAS press conference, 22 June 2006.
- ↑ Said 2007
- ↑ Mann 2012, pp. 160, 357, Said 2005
- 1 2 WSJ editorial, 14 July 2006, Hockey Stick Hokum.
- ↑ HCEC Hearings, 19 July 2006, p. 1.
- ↑ HCEC Hearings, 19 July 2006, p. III.
- ↑ HCEC Hearings, 19 July 2006, pp. 697–698 (27 July).
- ↑ Vergano, 15 May 2011.
- ↑ Vergano, 16 May 2011.
- ↑ Mann & Jones 2003.
- ↑ Pollack & Smerdon 2004.
- ↑ Moberg et al. 2005.
- ↑ Weart 2009 (graph).
- ↑ Oerlemans 2005.
- ↑ D'Arrigo, Wilson & Jacoby 2006.
- ↑ Osborn & Briffa 2006.
- ↑ North et al. 2006, pp. 113–115.
- ↑ Hegerl et al. 2006.
- ↑ AR4 WG1 SPM A Palaeoclimatic Perspective
- ↑ Mann 2012, pp. 140, 308
- ↑ Huang, Pollack & Shen 2008
- ↑ Black, 1 Sep. 2008 (BBC News).
- ↑ McIntyre & McKitrick 2009.
- ↑ Mann, Bradley & Hughes 2009.
- ↑ Kaufman et al. 2009; UCAR news release, 3 Sept. 2009; Bello 2009.
- ↑ Appell 2009; Tingley & Huybers 2010a
- ↑ Ljungqvist 2010
- ↑ Christiansen & Ljungqvist 2011
- ↑ Christiansen & Ljungqvist 2012
- ↑ Ljungqvist et al. 2012
- ↑ Lemonick 2013
- ↑ Gillis 2013
References in chronological sequence
1965
- Lamb, H. (1965), "The early medieval warm epoch and its sequel", Palaeogeography, Palaeoclimatology, Palaeoecology, 1: 13–37, Bibcode:1965PPP.....1...13L, doi:10.1016/0031-0182(65)90004-0 .
1978
- Landsberg, H. E.; Groveman, B. S.; Hakkarinen, I. M. (1978), "A simple method for approximating the annual temperature of the northern hemisphere" (PDF), Geophysical Research Letters, 5 (6): 505–506, Bibcode:1978GeoRL...5..505L, doi:10.1029/GL005i006p00505 .
1979
- Groveman, B. S.; Landsberg, H. E. (1979), "Simulated northern hemisphere temperature departures 1579-1880" (PDF), Geophysical Research Letters, 6 (10): 767–769, Bibcode:1979GeoRL...6..767G, doi:10.1029/GL006i010p00767 .
1989
- Jacoby, Gordon C.; D'Arrigo, Roseanne (February 1989), "Reconstructed Northern Hemisphere annual temperature since 1671 based on high-latitude tree-ring data from North America", Climatic Change, 14 (1): 39–59, Bibcode:1989ClCh...14...39J, doi:10.1007/BF00140174 .
1990
- Folland; et al. (1990), "Chap. 7: Observed Climate Variation and Change" (PDF), Climate Change: The IPCC Scientific Assessment (1990), Report prepared for Intergovernmental Panel on Climate Change by Working Group I
- IPCC FAR WG1 (1990), Houghton, J.T.; Jenkins, G.J.; Ephraums, J.J., eds., Climate Change: The IPCC Scientific Assessment (1990), Report prepared for Intergovernmental Panel on Climate Change by Working Group I, Cambridge University Press, ISBN 0-521-40360-X (pb: 0-521-40720-6).
1991
- Fritts, Harold C. (1 January 1991), Reconstructing large-scale climatic patterns from tree-ring data : a diagnostic analysis, Tucson: University of Arizona Press, ISBN 0-8165-1218-3 , abstract
- Bradley; et al. (1991), "Global Change: The last 2000 years. Report of Working Group 1." (PDF), Global Changes of the Past, UCAR/Office for Interdisciplinary Earth Studies, Boulder, Coloradoa, pp. 11–24 .
1992
- Folland, C.K.; Karl, T.R.; Nicholls, N.; Nyenzi, B.S.; Parker, D.E.; Vinnikov, K.Ya. (1992), "Section C - Observed Climate Variability and Change" (PDF), Climate Change 1992: The Supplementary Report to the IPCC Scientific Assessment , in IPCC supplementary report, 1992.
1993
- Graybill, Donald A.; Idso, Sherwood B. (January 1993), "Detecting the aerial fertilization effect of atmospheric CO2 enrichment in tree-ring chronologies", Global Biogeochemical Cycles, 7 (1): 81–95, Bibcode:1993GBioC...7...81G, doi:10.1029/92GB02533 .
- Mann, M. E.; Park, J. (June 1993), "Spatial correlations of interdecadal variation in global surface temperatures", Geophysical Research Letters, 20 (11): 1055–1058, Bibcode:1993GeoRL..20.1055M, doi:10.1029/93GL00752 .
- Bradley, Raymond S.; Jones, Philip D. (December 1993), "'Little Ice Age' summer temperature variations; their nature and relevance to recent global warming trends" (PDF), The Holocene, 3 (4): 367–376, doi:10.1177/095968369300300409 .
1994
- Hughes, Malcolm K.; Diaz, Henry F. (1 March 1994), "Was there a 'medieval warm period', and if so, where and when?", Climatic Change, 26 (2–3): 109–142, Bibcode:1994ClCh...26..109H, doi:10.1007/BF01092410 .
- Mann, M. E.; Park, J. (20 December 1994), "Global scale modes of surface temperature variability on interannual to century time scales" (PDF), Geophysical Research Letters, 99: 25819–25833, Bibcode:1994JGR....9925819M, doi:10.1029/94jd02396 .
1995
- Taubes, G. (17 March 1995), "Is a Warmer Climate Wilting the Forests of the North?", Science, 267 (5204): 1595, Bibcode:1995Sci...267.1595T, doi:10.1126/science.267.5204.1595, PMID 17808119 .
- Jacoby, G. C.; d'Arrigo, R. D. (June 1995), "Tree ring width and density evidence of climatic and potential forest change in Alaska", Global Biogeochemical Cycles, 9 (2): 227–234, Bibcode:1995GBioC...9..227J, doi:10.1029/95GB00321,
The recent increase in temperatures combined with drier years may be changing the tree response to climate
. - Mann, Michael E.; Park, Jeffrey; Bradley, Raymond S. (16 November 1995), "Global interdecadal and century-scale climate oscillations during the past five centuries", Nature, 378 (6554): 266–270, Bibcode:1995Natur.378..266M, doi:10.1038/378266a0 .
- Lean, J.; Beer, J.; Bradley, R. (December 1995), "Reconstruction of solar irradiance since 1610: Implications for climate change" (PDF), Geophysical Research Letters, 22 (23): 3195–3198, Bibcode:1995GeoRL..22.3195L, doi:10.1029/95GL03093 .
1996
- Bradley, Raymond S. (1996), "Are there optimum sites for global paleotemperature reconstruction?" (PDF), in Jones, Phil; Bradley, Raymond S.; Jouzel, Jean, Climate Variations and Forcing Mechanisms of the Last 2000 years, NATO ASI Series, 141, Springer-Verlag, Berlin, pp. 603–624 .
- Nicholls; et al. (1996), "Chap. 3: Observed Climate Variability and Change", Climate Change 1995: The Science of Climate Change, Contribution of Working Group I to the Second Assessment Report of the Intergovernmental Panel on Climate Change
- IPCC SAR WG1 (1996), Houghton, J.T.; Meira Filho, L.G.; Callander, B.A.; Harris, N.; Kattenberg, A.; Maskell, K., eds., Climate Change 1995: The Science of Climate Change, Contribution of Working Group I to the Second Assessment Report of the Intergovernmental Panel on Climate Change, Cambridge University Press, ISBN 0-521-56433-6 (pb: 0-521-56436-0) pdf.
- Michaels, Pat (18 March 1996), Feature: Congressional Brouhaha Over U.N. Report, World Climate Report, retrieved 1 January 2013 .
1997
- Lamb, H. H.; Clayton, K. M.; Wigley, T. M. L. (1997), "The Climatic Research Unit at Twenty-five Years", in Hulme, Michael; Barrow, Elaine, Climates of the British Isles: present, past and future, Routledge, ISBN 978-0-415-13016-5 .
- Overpeck, J.; Hughen, K.; Hardy, R.; Bradley, R.; et al. (14 November 1997), "Arctic Environmental Change of the Last Four Centuries", Science, 278 (5341): 1251–1256, Bibcode:1997Sci...278.1251O, doi:10.1126/science.278.5341.1251 .
- Fisher, D. A. (1997), "High resolution reconstructed Northern Hemisphere temperatures for the last few centuries: using regional average tree ring, ice core and historical annual time series", Paper U32C-7 in Supplement to EOS. Transactions .
1998
- Briffa, Keith R.; Schweingruber, F. H.; Jones, Phil D.; Osborn, Tim J.; Shiyatov, S. G.; Vaganov, E. A. (12 February 1998), "Reduced sensitivity of recent tree-growth to temperature at high northern latitudes" (PDF), Nature, 391 (6668): 678–682, Bibcode:1998Natur.391..678B, doi:10.1038/35596 .
- Mann, Michael E.; Bradley, Raymond S.; Hughes, Malcolm K. (23 April 1998), "Global-scale temperature patterns and climate forcing over the past six centuries" (PDF), Nature, 392 (6678): 779–787, Bibcode:1998Natur.392..779M, doi:10.1038/33859 . Corrigendum: Mann, Bradley & Hughes 2004.
- Hegerl, G. (23 April 1998), "The past as guide to the future" (PDF), Nature, 392 (6678): 758–759, Bibcode:1998Natur.392..758H, doi:10.1038/33799 .
- Jones, Phil D. (24 April 1998), "CLIMATE CHANGE: It Was the Best of Times, It Was the Worst of Times", Science, 280 (5363): 544–545, doi:10.1126/science.280.5363.544 .
- Cushman, John H., Jr. (26 April 1998), "Industrial Group Plans To Battle Climate Treaty", New York Times, retrieved 19 December 2011 .
- Stevens, William K. (28 April 1998), "New Evidence Finds This Is Warmest Century in 600 Years", New York Times, retrieved 2011-03-07 .
- Jones, Phil D.; Briffa, K. R.; Barnett, T. P.; Tett, S. F. B. (May 1998), "High-resolution palaeoclimatic records for the last millennium: interpretation, integration and comparison with General Circulation Model control-run temperatures", The Holocene, 8 (4): 455–471, doi:10.1191/095968398667194956 .
- Michaels, Pat (11 May 1998), Feature: Science Pundits Miss Big Picture Again, World Climate Report, retrieved 30 December 2012 .
- Briffa, K. R.; Jones, P. D.; Schweingruber, F. H.; Osborn, T. J. (4 June 1998), "Influence of volcanic eruptions on Northern Hemisphere summer temperature over the past 600 years" (PDF), Nature, 393 (6684): 450–455, Bibcode:1998Natur.393..450B, doi:10.1038/30943, archived from the original (PDF) on 1 April 2012 .
- Marshall Institute (30 June 1998), 1997: Warmest Year Since 1400?, George C. Marshall Institute, retrieved 8 May 2012 .
- Soon, Willie; Baliunas, Sallie (10 August 1998), Cutting Edge: The Summer of Our Discontent, World Climate Report, retrieved 1 January 2013 .
- Mann, Michael E. (28 September 1998), Cutting Edge: On Reconstructing Past Centuries' Temperatures, World Climate Report, retrieved 1 January 2013 .
- Pollack, Henry N.; Huang, Shaopeng; Shen, Po-Yu (9 October 1998), "Climate change record in subsurface temperatures: A global perspective" (PDF), Science, 282 (5387): 279–281, Bibcode:1998Sci...282..279P, doi:10.1126/science.282.5387.279, PMID 9765150 .
1999
- 1998 Was Warmest Year of Millennium, UMass Amherst Climate Researchers Report, UMass Amherst Office of News & Information, 3 March 1999, archived from the original on 29 June 2011, retrieved 2011-03-06 .
- Mann, Michael E.; Bradley, Raymond S.; Hughes, Malcolm K. (1999), "Northern hemisphere temperatures during the past millennium: Inferences, uncertainties, and limitations" (PDF), Geophysical Research Letters, 26 (6): 759–762, Bibcode:1999GeoRL..26..759M, doi:10.1029/1999GL900070 .
- Stevens, William K. (9 March 1999), "Song of the Millennium: Cool Prelude and a Fiery Coda", New York Times (Science News) . (source for graph)
- Briffa, Keith R.; Osborn, Timothy J. (7 May 1999), "CLIMATE WARMING: Seeing the Wood from the Trees", Science, 284 (5416): 926–927, doi:10.1126/science.284.5416.926 .
2000
- Briffa, Keith R. (1 January 2000), "Annual climate variability in the Holocene: interpreting the message of ancient trees", Quaternary Science Reviews, 19 (1–5): 87–105, Bibcode:2000QSRv...19...87B, doi:10.1016/S0277-3791(99)00056-6 .
- Huang, Shaopeng; Pollack, Henry N.; Shen, Po-Yu (17 February 2000), "Temperature trends over the past five centuries reconstructed from borehole temperatures" (PDF), Nature, 403 (6771): 756–758, Bibcode:2000Natur.403..756H, doi:10.1038/35001556, PMID 10693801 .
- Crowley, Thomas J.; Lowery, Thomas S. (February 2000), "How Warm Was the Medieval Warm Period?", AMBIO: A Journal of the Human Environment, 29 (1): 51–54, doi:10.1579/0044-7447-29.1.51 .
- Sullivan, Bruce (30 May 2000), Scientists Say Global Warming Theory is a Lot of Hot Air, CNSNews.com, archived from the original on 8 September 2005, retrieved 30 December 2012 .
- Jones, Phil (June 2000), CRU Information Sheet no. 5: The Millennial Temperature Record, University of East Anglia, retrieved 2011-03-07 .
- Crowley, T. J. (14 July 2000), "Causes of Climate Change over the Past 1000 Years" (PDF), Science, 289 (5477): 270–7, Bibcode:2000Sci...289..270C, doi:10.1126/science.289.5477.270, PMID 10894770, archived from the original (PDF) on 2015-08-13, retrieved 2014-02-04 .
2001
- Kirby, Alex (22 January 2001). "SCI/TECH: Human effect on climate 'beyond doubt'". BBC News. Retrieved 21 October 2012.
- Briffa, K. R.; Osborn, T. J.; Schweingruber, F. H.; Harris, I. C.; Jones, P. D.; Shiyatov, S. G.; Vaganov, E. A. (16 February 2001), "Low-frequency temperature variations from a northern tree ring density network", Journal of Geophysical Research, 106 (D3): 2929, Bibcode:2001JGR...106.2929B, doi:10.1029/2000JD900617 .
- Broecker, W. S. (23 February 2001), "PALEOCLIMATE: Was the Medieval Warm Period Global?" (PDF), Science, 291 (5508): 1497–1499, doi:10.1126/science.291.5508.1497, PMID 11234078, archived from the original (PDF) on 19 March 2013
- Schneider, T. (March 2001), "Analysis of Incomplete Climate Data: Estimation of Mean Values and Covariance Matrices and Imputation of Missing Values", Journal of Climate, 14 (5): 853–853, Bibcode:2001JCli...14..853S, doi:10.1175/1520-0442(2001)014<0853:AOICDE>2.0.CO;2 .
- Daly, John L. (2001), The Hockey Stick: A New Low in Climate Science, Archived from the original on 2001-04-14, retrieved 2012-10-18 (graph attribution corrected by ).
- Jones, P. D.; Osborn, T. J.; Briffa, K. R. (27 April 2001), "The Evolution of Climate over the Last Millennium", Science, 292 (5517): 662–667, Bibcode:2001Sci...292..662J, doi:10.1126/science.1059126, PMID 11326088 .
- IPCC WG1 SPM (2001), "Summary for Policymakers", Climate Change 2001: The Scientific Basis, Contribution of Working Group I to the Third Assessment Report of the Intergovernmental Panel on Climate Change
- Albritton; et al. (2001), "Technical Summary", Climate Change 2001: The Scientific Basis, Contribution of Working Group I to the Third Assessment Report of the Intergovernmental Panel on Climate Change
- Folland; et al. (2001), "Chapter 2: Observed Climate Variability and Change", Climate Change 2001: The Scientific Basis, Contribution of Working Group I to the Third Assessment Report of the Intergovernmental Panel on Climate Change, archived from the original on 2014-10-06
- IPCC TAR WG1 (2001), Houghton, J.T.; Ding, Y.; Griggs, D.J.; Noguer, M.; van der Linden, P.J.; Dai, X.; Maskell, K.; Johnson, C.A., eds., Climate Change 2001: The Scientific Basis, Contribution of Working Group I to the Third Assessment Report of the Intergovernmental Panel on Climate Change, Cambridge University Press, ISBN 0-521-80767-0, archived from the original on 2016-03-30 (pb: 0-521-01495-6).
- IPCC TAR SYR (2001), Watson, R. T.; the Core Writing Team, eds., Climate Change 2001: Synthesis Report, Contribution of Working Groups I, II, and III to the Third Assessment Report of the Intergovernmental Panel on Climate Change, Cambridge University Press, ISBN 0 521 80770 0 (pb: 0-521-01507-3).
2002
- Esper, J.; Cook, E. R.; Schweingruber, F. H. (22 March 2002), "Low-Frequency Signals in Long Tree-Ring Chronologies for Reconstructing Past Temperature Variability" (PDF), Science, 295 (5563): 2250–2253, Bibcode:2002Sci...295.2250E, doi:10.1126/science.1066208, PMID 11910106 .
- Flatow, Ira (29 March 2002), Interview: Michael Mann discusses a study that shows the pattern of global warming in the previous centuries may actually be part of a natural climate cycle, as evidenced by tree ring data (PDF), NPR Science Friday, retrieved 2011-03-07 .
- Mann, M. E.; Rutherford, S. (31 May 2002), "Climate reconstruction using 'Pseudoproxies'" (PDF), Geophysical Research Letters, 29 (10): 139–1–139–4, Bibcode:2002GeoRL..29.1501M, doi:10.1029/2001GL014554 .
- de Freitas, C. R. (June 2002), "Are observed changes in the concentration of carbon dioxide in the atmosphere really dangerous?" (PDF), Bulletin of Canadian Petroleum Geology, 30 (2): 297, 307–311, archived from the original (PDF) on May 26, 2003, retrieved 2011-07-15 .
- Essex, Christopher; McKitrick, Ross (2002), Taken By Storm : the troubled science, policy, and politics of global warming, Toronto, Ont.: Key Porter Books, ISBN 1-55263-212-1 .
- Fraser Institute (2002), 2002 Annual Report (PDF), archived from the original (PDF) on 2011-08-11, retrieved 2011-07-16 .
2003
- Soon, Wille; Baliunas, Sallie (31 January 2003), "Proxy climatic and environmental changes of the past 1000 years" (PDF), Climate Research, 23 (2): 89–110, Bibcode:2003ClRes..23...89S, doi:10.3354/cr023089 .
- U.S. Senate (28 July 2003), Hearing: Science of Climate Change, Congressional Record, 149 (113), U.S. Government Printing Office, p. S10022, retrieved 31 August 2012
- Committee on Environment and Public Works (29 July 2003), "Climate History and the Science Underlying Fate, Transport, and Health Effects of Mercury Emissions", Senate Hearing 108-359, U.S. Government Printing Office, retrieved 2011-03-06 .
- Revkin, Andrew C. (5 August 2003), "Politics Reasserts Itself in the Debate Over Climate Change and Its Hazards", New York Times, retrieved 2012-02-26 .
- Mann, Michael E.; Jones, Phil D. (14 August 2003), "Global surface temperatures over the past two millennia" (PDF), Geophysical Research Letters, 30 (15), Bibcode:2003GeoRL..30.1820M, doi:10.1029/2003GL017814 .
- Monastersky, Richard (4 September 2003), "Storm Brews Over Global Warming", Chronicle of Higher Education, retrieved 2011-03-06 .
- McIntyre, Stephen; McKitrick, Ross (November 2003a), "Corrections to the Mann et al. (1998) Proxy Data Base and Northern Hemispheric Average Temperature Series" (PDF), Energy & Environment, 14 (6): 751–771, doi:10.1260/095830503322793632, ISSN 0958-305X ("MM03").
- Tech Central Station (27 October 2003), TCS Newsflash: Important Global Warming Study Audited -- Numerous Errors Found; New Research Reveals the UN IPCC 'Hockey Stick' Theory of Climate Change is Flawed, Business Wire, retrieved 20 September 2012 .
- McIntyre, Stephen (28 October 2003), A. Chronology of Data Correspondence, Climate2003, archived from the original on 11 December 2003, retrieved 10 September 2012 .
- McIntyre, Stephen (2003), Welcome to Climate2003, Climate2003, archived from the original on 29 October 2003, retrieved 10 September 2012 .
- Schulz, Nick (28 October 2003), "Researchers question key global-warming study [op-ed]", USA Today . [See correction of 13 November.]
- Mann, Michael E.; Bradley, Raymond S.; Hughes, Malcolm K. (3 November 2003), Note on Paper by McIntyre and McKitrick in Energy and Environment (PDF), University of Virginia website, archived from the original (PDF) on November 6, 2003, retrieved 2012-11-28 , linked from Comments on McIntyre and McKitrick Paper as archived on 9 December 2003.
- USA Today (13 November 2003), "Corrections & Clarifications" (PDF), USA Today . [Correction to Schulz op-ed of 28 October.]
- Vergano, Dan (18 November 2003), "Global warming debate heats up Capitol Hill", USA Today .
- McIntyre, Stephen; McKitrick, Ross (18 November 2003b), The IPCC, the "Hockey Stick" Curve, and the Illusion of Experience (PDF), Washington, D.C.: George C. Marshall Institute Washington Roundtable on Science and Public policy, archived from the original (PDF) on 7 May 2004 .
- Mann, Michael E.; Ammann, Caspar M.; Bradley, Ray; Briffa, Keith R.; Jones, Philip D.; Osborn, Tim; Crowley, Tom; Hughes, Malcolm; Oppenheimer, Michael; Overpeck, Jonathan; Rutherford, Scott; Trenberth, Kevin; Wigley, Tom (2003), "On Past Temperatures and Anomalous Late-20th Century Warmth" (PDF), Eos, Transactions American Geophysical Union, 84 (27): 256, Bibcode:2003EOSTr..84..256M, doi:10.1029/2003EO270003 .
- Thompson, L.G.; Mosley-Thompson, E.; Davis, M.E.; Lin, P.-N.; Henderson, K.; Mashiotta, T.A. (2003), "Tropical glacier and ice core evidence of climate change on annual to millennial time scales." (PDF), Climatic Change, 59: 137–155, doi:10.1007/978-94-015-1252-7_8, archived from the original (PDF) on 2010-12-04 .
2004
- Briffa, K. R.; Osborn, T. J.; Schweingruber, F. H. (January 2004), "Large-scale temperature inferences from tree rings: A review", Global and Planetary Change, 40 (1–2): 11–26, Bibcode:2004GPC....40...11B, doi:10.1016/S0921-8181(03)00095-X .
- Jones, P. D.; Mann, M. E. (6 May 2004), "Climate over past millennia" (PDF), Reviews of Geophysics, 42 (2), Bibcode:2004RvGeo..42.2002J, doi:10.1029/2003RG000143 .
- Pollack, Henry N.; Smerdon, Jason E. (5 June 2004), "Borehole climate reconstructions: Spatial structure and hemispheric averages", Journal of Geophysical Research, 109 (D11106), Bibcode:2004JGRD..10911106P, doi:10.1029/2003JD004163 .
- Boykoff, M.; Boykoff, J. (July 2004), "Balance as bias: global warming and the US prestige press1" (PDF), Global Environmental Change Part A, 14 (2): 125–136, doi:10.1016/j.gloenvcha.2003.10.001, archived from the original (PDF) on 2015-11-06 .
- Mann, Michael E.; Bradley, Raymond S.; Hughes, Malcolm K. (1 July 2004), "Corrigendum: Global-scale temperature patterns and climate forcing over the past six centuries" (PDF), Nature, 430 (6995): 105–105, Bibcode:2004Natur.430..105M, doi:10.1038/nature02478 .
- "Climate legacy of 'hockey stick'". BBC News. 16 July 2004. Retrieved 2007-05-08.
- Mooney, Chris (13 September 2004), "CSI | Déjà vu All Over Again", Skeptical Inquirer, retrieved 2011-12-04 .
- Muller, Richard (15 October 2004), Global Warming Bombshell, Technology Review .
- von Storch, Hans; Zorita, Eduardo; Jones, Julie M.; Dimitriev, Yegor; González-Rouco, Fidel; Tett, Simon F. B. (22 October 2004), "Reconstructing Past Climate from Noisy Data", Science, 306 (5696): 679–682, Bibcode:2004Sci...306..679V, doi:10.1126/science.1096109, PMID 15459344 .
- Osborn, Timothy J.; Briffa, Keith R. (22 October 2004), "CLIMATE: the Real Color of Climate Change?" (PDF), Science, 306 (5696): 621–622, doi:10.1126/science.1104416, PMID 15459347 .
- McIntyre, Stephen (26 October 2004), "Oct. 26, 2004 "SPAGHETTI DIAGRAMS"", Webpage of Stephen McIntyre, Climate2003, archived from the original on 24 January 2005, retrieved 10 September 2012 .
- Cook, Edward R.; Esper, Jan; D'Arrigo, Rosanne D. (November 2004), "Extra-tropical Northern Hemisphere land temperature variability over the past 1000 years", Quaternary Science Reviews, 23 (20–22): 2063–2074, Bibcode:2004QSRv...23.2063C, doi:10.1016/j.quascirev.2004.08.013 .
2005
- Inhofe, James M. (4 January 2005), Climate Change Update Senate Floor Statement, U.S. Senator James M. Inhofe, archived from the original on 12 January 2005, retrieved 2011-03-07 .
- Mann, Michael; Rahmstorf, Stefan; Schmidt, Gavin; Steig, Eric; Connolley, William (10 January 2005), Senator Inhofe on Climate Change, RealClimate, retrieved 2011-03-07 .
- Mooney, Chris (11 January 2005), Warmed Over, CBS News, retrieved 2011-03-07 . Reprinted from The American Prospect, 10 January 2005.
- Crok, Marcel (January 2005a), Proof that mankind causes climate change is refuted, Kyoto protocol based on flawed statistics (PDF) (Translation: Angela den Tex), Natuurwetenschap & Techniek, retrieved 29 November 2012 , 1 February 2005 issue, online publication linked from Climate Audit on 27 January.
- Crok, Marcel (27 January 2005b), Breaking the hockey stick, National Post, archived from the original on 20 August 2011, retrieved 29 November 2012 .
- McIntyre, Steve (3 February 2005), "Climateaudit", Climate Audit, Climate Audit, archived from the original on 4 February 2005, retrieved 10 September 2012 .
- Moberg, Anders; Sonechkin, Dmitry M.; Holmgren, Karin; Datsenko, Nina M.; Karlén, Wibjörn; Lauritzen, S. E. (10 February 2005), "Highly variable Northern Hemisphere temperatures reconstructed from low- and high-resolution proxy data", Nature, 433 (7026): 613–617, Bibcode:2005Natur.433..613M, doi:10.1038/nature03265, PMID 15703742 . Corrigendum: Moberg et al. 2006.
- McIntyre, Stephen; McKitrick, Ross (12 February 2005), "Hockey sticks, principal components, and spurious significance", Geophysical Research Letters, 32 (3): L03710, Bibcode:2005GeoRL..32.3710M, doi:10.1029/2004GL021750 .
- McKitrick, R.; McIntyre, S. (2005), "The M&M Critique of the MBH98 Northern Hemisphere Climate Index: Update and Implications" (PDF), Energy & Environment, 16: 69–100, doi:10.1260/0958305053516226, archived from the original (PDF) on March 25, 2005 .
- Regalado, Antonio (14 February 2005), "In Climate Debate, The 'Hockey Stick' Leads to a Face-Off", Wall Street Journal .
- Schmidt, Gavin; Ammann, Caspar (18 February 2005), Dummies guide to the latest "Hockey Stick" controversy, RealClimate, retrieved 2011-03-07 .
- Appell, David (21 February 2005), "Behind the Hockey Stick", Scientific American [webpage], retrieved 2011-03-07 .
- Said, Yasmin H. (2005), Agent-Based Simulation of Ecological Alcohol Systems, A dissertation submitted in partial fulfillment of the requirements for the degree of Doctorate of Philosophy at George Mason University (PDF), George Mason University, archived from the original (PDF) on 5 September 2006 .
- Rincon, Paul (16 March 2005). "Row over climate 'hockey stick'". BBC News. Retrieved 2011-03-04.
- McKitrick, Ross (4 April 2005), What is the ‘Hockey Stick’ Debate About? (PDF), Managing Climate Change—Practicalities and Realities in a Post-Kyoto Future, Parliament House, Canberra Australia: Australia Asia Pacific Economic Cooperation Study Centre, Archived from the original on 19 September 2006 ().
- Oerlemans, J. (29 April 2005), "Extracting a Climate Signal from 169 Glacier Records" (PDF), Science, 308 (5722): 675–677, Bibcode:2005Sci...308..675O, doi:10.1126/science.1107046, PMID 15746388 .
- Revkin, Andrew C. (8 June 2005), Bush Aide Softened Greenhouse Gas Links to Global Warming, The New York Times, retrieved 29 January 2013 .
- Media Advisory: The Hockey Stick Controversy - New Analysis Reproduces Graph of Late 20th Century Temperature Rise, University Corporation for Atmospheric Research, 11 May 2005, archived from the original on 2011-05-14, retrieved 2011-03-04 .
- House Committee on Energy and Commerce (23 June 2005), Letters Requesting Information Regarding Global Warming Studies, United States House Committee on Energy and Commerce, archived from the original on 28 June 2005, retrieved 2011-03-04 .
- Barton, Joe; Whitfield, Ed (23 June 2005), Letter to Dr. Michael Mann (PDF), United States House Committee on Energy and Commerce, archived from the original (PDF) on 7 February 2012, retrieved 2011-03-04 .
- Waxman, Henry A. (1 July 2005), Letter to Chairman Barton (PDF), henrywaxman.house.gov, archived from the original (PDF) on 2009-10-07 .
- Monastersky, Richard (1 July 2005), "Congressman Demands Complete Records on Climate Research by 3 Scientists Who Support Theory of Global Warming", The Chronicle of Higher Education, retrieved 2011-03-04 .
- Leshner, Alan I. (13 July 2005), Letter to Joe Barton (PDF) .
- Mann, Michael E. (15 July 2005), Letter to Chairman Barton and Chairman Whitfield (PDF), RealClimate, archived from the original (PDF) on 27 July 2011, retrieved 2011-03-04 .
- Twenty scientists (15 July 2005), Letter to Chairman Barton and Chairman Whitfield (PDF), RealClimate, archived from the original (PDF) on 27 July 2011 .
- Schmidt, Gavin; Rahmstorf, Stefan (18 July 2005), Scientists respond to Barton, RealClimate, retrieved 2011-03-04 .
- Eilperin, Juliet (18 July 2005), "GOP Chairmen Face Off on Global Warming", Washington Post .
- Pease, Roland (18 July 2005). "Politics plays climate 'hockey'". BBC News. Retrieved 2011-03-04.
- Editorial (23 July 2005), "Hunting Witches", Washington Post .
- Milloy, Steven (31 July 2005). "Tree Ring Circus - Opinion - FOXNews.com". Fox News. Retrieved 2011-03-09.
- Rutherford, S.; Mann, Michael E.; Osborn, T. J.; Briffa, Keith R.; Jones, Phil D.; Bradley, Raymond S.; Hughes, Malcolm K. (July 2005), "Proxy-Based Northern Hemisphere Surface Temperature Reconstructions: Sensitivity to Method, Predictor Network, Target Season, and Target Domain" (PDF), Journal of Climate, 18 (13): 2308–2329, Bibcode:2005JCli...18.2308R, doi:10.1175/JCLI3351.1 .
- Huybers, P. (21 October 2005), "Comment on "Hockey sticks, principal components, and spurious significance" by S. McIntyre and R. McKitrick" (PDF), Geophysical Research Letters, 32 (L20705), Bibcode:2005GeoRL..3220705H, doi:10.1029/2005GL023395, archived from the original (PDF) on 3 May 2013 .
- von Storch, Hans; Zorita, Eduardo (21 October 2005), "Comment on "Hockey sticks, principal components, and spurious significance" by S. McIntyre and R. McKitrick" (PDF), Geophysical Research Letters, 32 (L20701), Bibcode:2005GeoRL..3220701V, doi:10.1029/2005GL022753, archived from the original (PDF) on 9 March 2012 .
- Thacker, Paul D. (31 October 2005a), "Skeptics get a journal" (PDF), Environmental Science & Technology, 39 (21): 432A–437A, Bibcode:2005EnST...39..432P, doi:10.1021/es053378b, PMID 16294841 .
- Thacker, Paul D. (1 November 2005b), "How a global-warming skeptic became famous", Environmental Science & Technology, 39 (21): 436A–437A, Bibcode:2005EnST...39..432P, doi:10.1021/es053378b, PMID 16294841 .
- Bürger, G.; Cubasch, U. (14 December 2005), "Are multiproxy climate reconstructions robust?", Geophysical Research Letters, 32 (23), Bibcode:2005GeoRL..3223711B, doi:10.1029/2005GL024155 .
2006
- D'Arrigo, Rosanne; Wilson, Rob; Jacoby, Gordon (7 February 2006), "On the long-term context for late twentieth century warming", Journal of Geophysical Research, 111 (D03103), Bibcode:2006JGRD..11103103D, doi:10.1029/2005JD006352 .
- Osborn, Timothy J.; Briffa, Keith R. (10 February 2006), "The Spatial Extent of 20th-Century Warmth in the Context of the Past 1200 Years" (PDF), Science, 311 (5762): 841–844, Bibcode:2006Sci...311..841O, doi:10.1126/science.1120514, PMID 16469924 .
- Regalado, Antonio (10 February 2006a), Academy to Referee Climate-Change Fight, Wall Street Journal, retrieved 30 January 2013 .
- Moberg, Anders; Sonechkin, Dimitry M.; Holmgren, Karin; Datsenko, Nina M.; Karlén, Wibjörn; Lauritzen, Stein-Erik (23 February 2006), "Corrigendum: Highly variable Northern Hemisphere temperatures reconstructed from low- and high-resolution proxy data", Nature, 439 (7079): 1014, Bibcode:2006Natur.439.1014M, doi:10.1038/nature04575 .
- Wahl, E. R.; Ammann, C. M. (3 March 2006), "Robustness of the Mann, Bradley, Hughes reconstruction of Northern Hemisphere surface temperatures: Examination of criticisms based on the nature and processing of proxy climate evidence", Climatic Change, in press, archived from the original on 3 May 2006, retrieved 2013-01-31 . paper dated 24 February 2006
- Hegerl, Gabriele C.; Crowley, Thomas J.; Hyde, William T.; Frame, David J. (20 April 2006), "Climate sensitivity constrained by temperature reconstructions over the past seven centuries", Nature, 440 (7087): 1029–1032, Bibcode:2006Natur.440.1029H, doi:10.1038/nature04679, PMID 16625192 .
- Wahl, Eugene R.; Ritson, David M.; Ammann, Casper M. (28 April 2006), "Comment on 'Reconstructing Past Climate from Noisy Data'" (PDF), Science, 312 (5773): 529b–529b, doi:10.1126/science.1120866, PMID 16645079 .
- Smith, Claire L.; Baker, Andy; Fairchild, Ian J.; Frisia, Silvia; Borsato, Andrea (3 May 2006), "Reconstructing hemispheric-scale climates from multiple stalagmite records", International Journal of Climatology, 26 (10): 1417–1424, Bibcode:2006IJCli..26.1417S, doi:10.1002/joc.1329 , Figure 1.
- Gore, Al (26 May 2006), An inconvenient truth: the planetary emergency of global warming and what we can do about it, London: Bloomsbury, pp. 63–65, ISBN 0-7475-8906-2,
Rodale Books; First Edition (May 26, 2006)
. - Hoke, Greg (2006), "An Inconvenient Truth - Transcript", Ice Cores: The 650,000 Record, archived from the original on 2006-11-05, retrieved 2011-03-07 .
- "[Audio recording of National Academies press conference]". The National Academies. 22 June 2006. Real Audio or mp3 download.
- North, Gerald R.; Biondi, Franco; Bloomfield, Peter; Christy, John R.; Cuffey, Kurt M.; Dickinson, Robert E.; Druffel, Ellen R. M.; Nychka, Douglas; Otto-Bliesner, B.; Roberts, N.; Turekian, K.; Wallace, J. (22 June 2006), Surface temperature reconstructions for the last 2,000 years, Washington, D.C.: National Academies Press, ISBN 0-309-10225-1 . (North Report).
- Office of News and Public Information (22 June 2006), 'High Confidence' That Planet Is Warmest in 400 Years, The National Academies, retrieved 18 August 2012 .
- Boehlert, Sherwood (22 June 2006), Statement by Science Committee Chairman Sherwood Boehlert (R-NY) regarding the National Academy of Sciences Report, Surface Temperature Reconstructions for the Last 2,000 Years: (PDF), Committee on Science - U.S. House of Representatives, archived from the original (PDF) on 29 June 2006, retrieved 7 September 2012 .
- RealClimate (22 June 2006), National Academies Synthesis Report, RealClimate, retrieved 2010-08-01 .
- Revkin, Andrew C. (22 June 2006), "Science Panel Backs Study on Warming Climate", New York Times .
- Pielke, Roger, Jr. (22 June 2006), "Quick Reaction to the NRC Hockey Stick Report", Prometheus: The Science Policy Blog (CIRES) . (Announcement of North et al. 2006.)
- von Storch, Hans; Zorita, Eduardo (22 June 2006), Press release and comment on the NAS report "Surface Temperature Reconstructions for the last 200 Years" .
- Heilprin, John (23 June 2006) [22 June 2006]. "Study: Earth is hottest now in 2,000 years; humans responsible for much of the warming". USA Today. Retrieved 6 September 2012. .
- "Backing for 'hockey stick' graph". BBC News. 23 June 2006. Retrieved 6 September 2012. .
- Daley, Beth (23 June 2006), "National panel supports '98 global warming evidence", The Boston Globe, retrieved 18 August 2012 .
- NewsMax.com (23 June 2006), Sen. Inhofe: NAS Report Refutes Global Warming Theory, Newsmax Media, archived from the original on 29 January 2013, retrieved 7 September 2012 .
- Regalado, Antonio (23 June 2006), "Panel Study Fails To Settle Debate On Past Climates", Wall Street Journal .
- Brumfiel, Geoff (29 June 2006), "Academy affirms hockey-stick graph", Nature, 441 (7097): 1032–3, Bibcode:2006Natur.441.1032B, doi:10.1038/4411032a, PMID 16810211 .
- Rahmstorf, Stefan (30 June 2006), "Testing Climate Reconstructions" (PDF), Science, 312 (5782): 1872–1873, doi:10.1126/science.312.5782.1872b, PMID 16809508 .
- Editorial (14 July 2006), "Hockey Stick Hokum", Wall Street Journal .
- Mongabay.com (16 July 2006), War of words over new climate change report, 'hockey stick' model: Leading scientist says House climate report is "politicized", Mongabay.com, archived from the original on 7 May 2013 .
- U.S. House Committee on Energy and Commerce — Press Office (2006), Report Raises New Questions About Climate Change Assessments (PDF), archived from the original (PDF) on 2006-07-19 .
- Wegman, Edward J.; Said, Yasmin H.; Scott, David W. (2006), "Ad Hoc Committee Report On The 'Hockey Stick' Global Climate Reconstruction" (PDF), Congressional Report, United States House Committee on Energy and Commerce (published 14 July 2006), archived from the original (PDF) on 16 July 2006, retrieved 22 October 2012 (Wegman Report).
- Quiggin, John (15 July 2006), Adventures in social network analysis, Crooked Timber, retrieved 2010-08-01 .
- RealClimate (19 July 2006), The missing piece at the Wegman hearing, RealClimate, retrieved 2010-08-01 .
- House Committee on Energy and Commerce (July 2006), Questions surrounding the 'Hockey stick' temperature studies: Implications for climate change assessments, Hearings before the Subcommittee on Oversight and Investigations of the Committee on Energy and Commerce, 109th Congress, Second session, U.S. Government Printing Office, retrieved 2010-08-01 (154 MB PDF).
- Bradley, Raymond S.; Hughes, Malcolm K.; Mann, Michael E. (10 August 2006), "Authors were clear about hockey-stick uncertainties", Nature, 442 (7103): 627, Bibcode:2006Natur.442..627B, doi:10.1038/442627b, PMID 16900179 .
- Ritson, David (16 August 2006), letter to Congressman Henry Waxman (PDF), retrieved 10 February 2013 , enclosure: e-mailed requests.
- North, Gerald (29 August 2006b), "Surface Temperature Reconstructions for the Last Millennium", seminar at Texas A&M University, archived from the original (mp4 audio and presentation) on 2012-03-07, retrieved 2012-02-12 .
- Monastersky, Richard (moderator) (6 September 2006), "A Scientific Graph Stands Trial", The Chronicle of Higher Education — Live Discussions, archived from the original on 2007-09-30 .
- Monastersky, Richard (8 September 2006), "Climate Science on Trial", The Chronicle of Higher Education, retrieved 2011-03-06 .
- Pearce, Fred (4 November 2006), Climate change special: State of denial - environment, New Scientist, retrieved 30 October 2012 .
2007
- von Storch, Hans; Zorita, Eduardo (3 May 2007), Climate Feedback: The decay of the hockey stick, Nature Climate Change [blog], retrieved 2011-03-07 .
- McIntyre, Steve (3 May 2007), von Storch and Zorita blog on the Hockey Stick, Climate Audit, retrieved 2010-08-01 .
- Heffernan, Olive (3 May 2007a), Hans von Storch and Eduardo Zorita on the Hockey stick effect, Blogs.nature.com, retrieved 2010-08-01 .,
- Heffernan, Olive (3 May 2007b), Hans von Storch, Blogs.nature.com, retrieved 2010-08-01 .
- Ammann, C. M.; Wahl, E. R. (24 August 2007), "The importance of the geophysical context in statistical evaluations of climate reconstruction procedures" (PDF), Climatic Change, 85: 71–88, doi:10.1007/s10584-007-9276-x .
- Wahl, Eugene R.; Ammann, Caspar M. (31 August 2007), "Robustness of the Mann, Bradley, Hughes reconstruction of Northern Hemisphere surface temperatures: Examination of criticisms based on the nature and processing of proxy climate evidence" (PDF), Climatic Change, 85 (1–2): 33–69, doi:10.1007/s10584-006-9105-7, archived from the original (PDF) on 24 January 2013 .
- Said, Yasmin H. (7 September 2007), "Experiences with Congressional Testimony: Statistics and The Hockey Stick", Data and Statistical Sciences Colloquium Series (PDF), George Mason University, archived from the original (PDF) on 16 February 2010 .
- Juckes, M. N.; Allen, M. R.; Briffa, K. R.; Esper, J.; Hegerl, G. C.; Moberg, Anders; Osborn, T. J.; Weber, S. L. (5 October 2007), "Millennial temperature reconstruction intercomparison and evaluation" (PDF), Climate of the Past, 3 (4): 591–609, doi:10.5194/cp-3-591-2007 .
- Waxman, Henry (12 December 2007), "Committee Report: White House Engaged in Systematic Effort to Manipulate Climate Change Science", Committee on Oversight and Government Reform, United States House of Representatives, retrieved 2011-12-09 Report pp. 21–25.
- Jansen; et al. (2007), "Chapter 6: Palaeoclimate", Climate Change 2007: The Physical Science Basis, Contribution of Working Group I to the Fourth Assessment Report of the Intergovernmental Panel on Climate Change
- IPCC AR4 WG1 (2007), Solomon, S.; Qin, D.; Manning, M.; Chen, Z.; Marquis, M.; Avery, K.B.; Tignor, M.; Miller, H.L., eds., Climate Change 2007: The Physical Science Basis, Contribution of Working Group I to the Fourth Assessment Report of the Intergovernmental Panel on Climate Change, Cambridge University Press, ISBN 978-0-521-88009-1 (pb: 978-0-521-70596-7).
2008
- Said, Yasmin H.; Wegman, Edward J.; Sharabati, Walid K.; Rigsby, John T. (January 2008), "Social networks of author–coauthor relationships", Computational Statistics & Data Analysis, 51 (4): 2177–2184, doi:10.1016/j.csda.2007.07.021 . Retracted.
- d'Arrigo, R.; Wilson, R.; Liepert, B.; Cherubini, P. (February 2008), "On the 'Divergence Problem' in Northern Forests: A review of the tree-ring evidence and possible causes" (PDF), Global and Planetary Change, 60 (3–4): 289–305, Bibcode:2008GPC....60..289D, doi:10.1016/j.gloplacha.2007.03.004 .
- Huang, S.; Pollack, H. N.; Shen, P. Y. (4 July 2008), "A late Quaternary climate reconstruction based on borehole heat flux data, borehole temperature data, and the instrumental record" (PDF), Geophysical Research Letters, 35 (L13703): L13703, Bibcode:2008GeoRL..3513703H, doi:10.1029/2008GL034187, archived from the original (PDF) on 27 February 2012 .
- Lee, Terry C. K.; Zwiers, Francis W.; Tsao, Min (1 August 2008), "Evaluation of proxy-based millennial reconstruction methods" (PDF), Climate Dynamics, 31 (2–3): 263–281, Bibcode:2008ClDy...31..263L, doi:10.1007/s00382-007-0351-9 .
- Black, Richard (1 September 2008). "Climate 'hockey stick' is revived". BBC News. Retrieved 2011-05-18.
- Mann, Michael E.; Zhang, Zhihua; Hughes, Malcolm K.; Bradley, Raymond S.; Miller, Sonya K.; Rutherford, Scott; Ni, Fenbiao (9 September 2008), "Proxy-based reconstructions of hemispheric and global surface temperature variations over the past two millennia", Proceedings of the National Academy of Sciences of the United States of America, 105 (36): 13252–13257, Bibcode:2008PNAS..10513252M, doi:10.1073/pnas.0805721105, PMC 2527990, PMID 18765811 .
- Muller, Richard (2008), Physics for future presidents: the science behind the headlines, New York, NY: W.W. Norton & Co., ISBN 978-0-393-06627-2 .
- Weart, Spencer R. (2008), The Discovery of Global Warming (revised ed.), Harvard University Press, ISBN 0-674-03189-X . Provides an overview of The Discovery of Global Warming website.
2009
- Jones, Phil D.; Briffa, Keith R.; Osborn, T. J.; Lough, J. M.; van Ommen, T. D.; Vinther, B. M.; Luterbacher, J.; Wahl, Eugene R.; et al. (February 2009), "High-resolution palaeoclimatology of the last millennium: a review of current status and future prospects" (PDF), The Holocene, 19 (1): 3–49, doi:10.1177/0959683608098952 .
- McIntyre, Stephen; McKitrick, Ross (February 2009), "Proxy inconsistency and other problems in millennial paleoclimate reconstructions", Proc. Natl. Acad. Sci. U.S.A., 106 (6): E10, author reply E11, Bibcode:2009PNAS..106...10M, doi:10.1073/pnas.0812509106, PMC 2647809, PMID 19188613 .
- Mann, Michael E.; Bradley, Raymond S.; Hughes, Malcolm K. (10 February 2009), "Reply to McIntyre and McKitrick: Proxy-based temperature reconstructions are robust", Proc. Natl. Acad. Sci. U.S.A., 106 (6): E11, Bibcode:2009PNAS..106...11M, doi:10.1073/pnas.0812936106, PMC 2644169 .
- Arctic Warming Overtakes 2,000 Years of Natural Cooling, University Corporation for Atmospheric Research, 3 September 2009, archived from the original on 27 April 2011, retrieved 19 May 2011 .
- Bello, David (4 September 2009), "Global Warming Reverses Long-Term Arctic Cooling", Scientific American [webpage], retrieved 19 May 2011 .
- Kaufman, Darrel; Schneider, David P.; McKay, Nicholas P.; Ammann, Caspar M.; Bradley, Raymond S.; Briffa, Keith R.; Miller, Gifford H.; Otto-Bliesner, Bette L.; Overpeck, Jonathan T.; Vinther, Bo M.; Arctic Lakes 2k Project Members (4 September 2009), "Recent warming reverses long-term arctic cooling" (PDF), Science, 325 (5945): 1236–1239, Bibcode:2009Sci...325.1236K, doi:10.1126/science.1173983, PMID 19729653 .
- Appell, David (28 October 2009), "Novel Analysis Confirms Climate "Hockey Stick" Graph", Scientific American [webpage], retrieved 27 May 2011 .
- Hickman, Leo (20 November 2009), "Climate sceptics claim leaked emails are evidence of collusion among scientists", The Guardian, London .
- Communications Office (23 November 2009), Climatic Research Unit update - 17.45 November 23, University of East Anglia, archived from the original on 5 December 2009, retrieved 2012-03-08 .
- Communications Office (24 November 2009), CRU update 2, University of East Anglia, archived from the original on 5 December 2009, retrieved 2011-03-07 .
- Johnson, Keith; Naik, Gautam (24 November 2009), "Lawmakers Probe Climate Emails", Wall Street Journal, archived from the original on 9 January 2010 .
- Mann, Michael E.; Zhang, Zhihua; Rutherford, Scott; Bradley, Raymond S.; Hughes, Malcolm K.; Shindell, Ddrew; Ammann, Caspar M.; Faluvegi, Greg; et al. (27 November 2009), "Global Signatures and Dynamical Origins of the Little Ice Age and Medieval Climate Anomaly" (PDF), Science, 326 (5957): 1256–1260, Bibcode:2009Sci...326.1256M, doi:10.1126/science.1177303, PMID 19965474 .
- Nature editorial (3 December 2009), "Climatologists under pressure", Nature, 462 (7273): 545, Bibcode:2009Natur.462..545., doi:10.1038/462545a, PMID 19956212 .
- Borenstein, Seth (3 December 2009), Business & Technology : Obama science advisers grilled over hacked e-mails, Seattle Times Newspaper, retrieved 11 December 2012 .
- Michaels, Pat (18 December 2009), "How to Manufacture a Climate Consensus", Wall Street Journal .
- von Storch, Hans (22 December 2009), "Good Science, Bad Politics", Wall Street Journal .
- Mann, Michael E. (31 December 2009), "Science Must Be Unpolluted by Politics", Wall Street Journal .
- Weart, Spencer R. (December 2009), "Climate over Millennia (Hockey Stick graph)", The Discovery of Global Warming, retrieved 2011-03-06 .
2010
- Pearce, Fred (9 February 2010), "Part two: How the 'climategate' scandal is bogus and based on climate sceptics' lies", Environment, The Guardian, London, retrieved 2012-03-08 .
- Pearce, Fred (9 February 2010), "Part three: Hockey stick graph took pride of place in IPCC report, despite doubts", Environment, The Guardian, London, retrieved 2012-03-08 .
- Pearce, Fred (9 February 2010), "Part four: Climate change debate overheated after sceptics grasped 'hockey stick'", Environment, The Guardian, London, retrieved 2010-03-08 .
- Tingley, Martin P.; Huybers, Peter (May 2010a), "A Bayesian Algorithm for Reconstructing Climate Anomalies in Space and Time. Part I: Development and Applications to Paleoclimate Reconstruction Problems", Journal of Climate, 23 (10): 2759–2781, Bibcode:2010JCli...23.2759T, doi:10.1175/2009JCLI3015.1 .
- Tingley, Martin P.; Huybers, Peter (May 2010b), "A Bayesian Algorithm for Reconstructing Climate Anomalies in Space and Time. Part II: Comparison with the Regularized Expectation–Maximization Algorithm", Journal of Climate, 23 (10): 2782–2800, Bibcode:2010JCli...23.2782T, doi:10.1175/2009JCLI3016.1 .
- Frank, David; Esper, Jan; Zorita, Eduardo; Wilson, Rob (14 May 2010), "A noodle, hockey stick, and spaghetti plate: A perspective on high-resolution paleoclimatology", Wiley Interdisciplinary Reviews: Climate Change, 1 (4): 507–516, doi:10.1002/wcc.53 .
- Russell, Sir Muir; Boulton, Geoffrey; Clark, Peter; Eyton, David; Norton, James (7 July 2010), The Independent Climate Change E-mails Review (PDF) "ICCER".
- Chameides, Bill (30 August 2010), "Climategate Redux", Scientific American [webpage], archived from the original on 2012-03-07, retrieved 23 August 2016 .
- Ljungqvist, F. C. (September 2010), "A New Reconstruction of Temperature Variability in the Extra-Tropical Northern Hemisphere During the Last Two Millennia" (PDF), Geografiska Annaler: Series A, Physical Geography, 92 (3): 339–351, doi:10.1111/j.1468-0459.2010.00399.x .
- Vergano, Dan (8 October 2010), "University investigating prominent climate science critic", USA Today .
- Vergano, Dan (22 November 2010), "Experts claim 2006 climate report plagiarized", USA Today .
- Pearce, Fred (2010), The Climate Files: The Battle for the Truth About Global Warming, Random House UK, ISBN 0-85265-229-1 .
2011
- Vergano, Dan (15 May 2011), "Climate study gets pulled after charges of plagiarism", USA Today .
- Vergano, Dan (16 May 2011), "Retracted climate critics' study panned by expert", USA Today .
- Nature editorial (26 May 2011), "Copy and paste", Nature, 473 (7348): 419–420, Bibcode:2011Natur.473R.419., doi:10.1038/473419b, PMID 21614031 .
- Kintisch, Eli (2 June 2011), Journal Retracts Disputed Network Analysis Paper on Climate, ScienceInsider, archived from the original on 7 June 2011 .
- Weart, Spencer R. (2003–2011), The Discovery of Global Warming (website), American Institute of Physics . Chapters are available as pdf files.
- Weart, Spencer R. (February 2011c), "Modern Temperature Trend", The Discovery of Global Warming, retrieved 2011-03-06 . Available as a pdf.
- Weart, Spencer R. (December 2011o), "Government: The View from Washington, DC", The Discovery of Global Warming, retrieved 2011-03-06 . Available as a pdf.
- Christiansen, B.; Ljungqvist, F. C. (December 2011), "Reconstruction of the Extratropical NH Mean Temperature over the Last Millennium with a Method that Preserves Low-Frequency Variability", Journal of Climate, 24 (23): 6013–6034, Bibcode:2011JCli...24.6013C, doi:10.1175/2011JCLI4145.1 . (reply to comments by A. Moberg)
2012
- Ljungqvist, F. C.; Krusic, P. J.; Brattström, G.; Sundqvist, H. S. (3 February 2012), "Northern Hemisphere temperature patterns in the last 12 centuries", Climate of the Past, 8: 227–249, Bibcode:2012CliPa...8..227L, doi:10.5194/cp-8-227-2012 .
- Vergano, Dan (22 February 2012), "University reprimands climate science critic for plagiarism", USA Today .
- Mann, Michael E. (6 March 2012), The Hockey Stick and the Climate Wars: Dispatches from the Front Lines, Columbia University Press, ISBN 978-0-231-15254-9 .
- Christiansen, B.; Ljungqvist, F. C. (18 April 2012), "The extra-tropical Northern Hemisphere temperature in the last two millennia: Reconstructions of low-frequency variability" (PDF), Climate of the Past, 8 (2): 765–786, Bibcode:2012CliPa...8..765C, doi:10.5194/cp-8-765-2012 .
2013
- Connor, Steve (24 January 2013), How the 'Kochtopus' stifled green debate - Climate Change - Environment, The Independent .
- Weart, Spencer R. (February 2013), "Changing Sun, Changing Climate", The Discovery of Global Warming, retrieved 2013-06-04 . Available as a pdf.
- Lemonick, Michael D. (7 March 2013), Climate to Warm Beyond Levels Seen for 11,300 Years, Climate Central, retrieved 10 March 2013 .
- Gillis, Justin (7 March 2013), Global Temperatures Highest in 4,000 Years, Study Says - NYTimes.com, New York Times, retrieved 10 March 2013 .
- Marcott, S. A.; Shakun, J. D.; Clark, P. U.; Mix, A. C. (8 March 2013), "A Reconstruction of Regional and Global Temperature for the Past 11,300 Years", Science, 339 (6124): 1198–1201, Bibcode:2013Sci...339.1198M, doi:10.1126/science.1228026, PMID 23471405 .
- PAGES 2k Consortium (21 April 2013), "Continental-scale temperature variability during the past two millennia", Nature Geoscience, 6 (5): 339–346, Bibcode:2013NatGe...6..339P, doi:10.1038/ngeo1797 (78 researchers, corresponding author Darrell S. Kaufman).