Heideland, Brandenburg
| Heideland | ||
|---|---|---|
| ||
 Heideland Location of Heideland within Elbe-Elster district 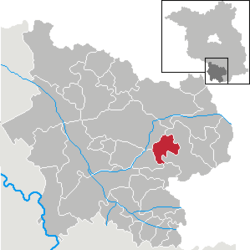 | ||
| Coordinates: 51°36′00″N 13°40′00″E / 51.60000°N 13.66667°ECoordinates: 51°36′00″N 13°40′00″E / 51.60000°N 13.66667°E | ||
| Country | Germany | |
| State | Brandenburg | |
| District | Elbe-Elster | |
| Municipal assoc. | Elsterland | |
| Government | ||
| • Mayor | Bernd Warsönke | |
| Area | ||
| • Total | 31.53 km2 (12.17 sq mi) | |
| Elevation | 105 m (344 ft) | |
| Population (2017-12-31)[1] | ||
| • Total | 524 | |
| • Density | 17/km2 (43/sq mi) | |
| Time zone | CET/CEST (UTC+1/+2) | |
| Postal codes | 03238 | |
| Dialling codes | 03531 | |
| Vehicle registration | EE | |

Heideland is a municipality in the Elbe-Elster district, in Brandenburg, Germany.
Demography
.pdf.jpg)
Development of Population since 1875 within the Current Boundaries (Blue Line: Population; Dotted Line: Comparison to Population Development of Brandenburg state; Grey Background: Time of Nazi rule; Red Background: Time of Communist rule)
| Heideland: Population development within the current boundaries (2017)[2] | ||||||||||||||||||||||||||||||||||||||||||||||||||||||||||||||||||||||||||||||||||||||||||||||||||||||||||||||||||||||||||||||||||||||
|---|---|---|---|---|---|---|---|---|---|---|---|---|---|---|---|---|---|---|---|---|---|---|---|---|---|---|---|---|---|---|---|---|---|---|---|---|---|---|---|---|---|---|---|---|---|---|---|---|---|---|---|---|---|---|---|---|---|---|---|---|---|---|---|---|---|---|---|---|---|---|---|---|---|---|---|---|---|---|---|---|---|---|---|---|---|---|---|---|---|---|---|---|---|---|---|---|---|---|---|---|---|---|---|---|---|---|---|---|---|---|---|---|---|---|---|---|---|---|---|---|---|---|---|---|---|---|---|---|---|---|---|---|---|---|
|
|
| ||||||||||||||||||||||||||||||||||||||||||||||||||||||||||||||||||||||||||||||||||||||||||||||||||||||||||||||||||||||||||||||||||||
References
- ↑ "Bevölkerung im Land Brandenburg nach amtsfreien Gemeinden, Ämtern und Gemeinden 31. Dezember 2017 (Fortgeschriebene amtliche Einwohnerzahlen auf Grundlage des Zensus 2011)". Amt für Statistik Berlin-Brandenburg (in German). 2018.
- ↑ Detailed data sources are to be found in the Wikimedia Commons.Population Projection Brandenburg at Wikimedia Commons
This article is issued from
Wikipedia.
The text is licensed under Creative Commons - Attribution - Sharealike.
Additional terms may apply for the media files.