Electricity sector in Germany
| Data | |
|---|---|
| Continuity of supply | 0.2815 hrs (16.89 min) interruption per subscriber per year |
| Installed capacity | 198.45 GW(2017)[1] |
| Share of fossil energy | 66.6% (2016)[2] |
| Share of renewable energy | 33.3% (2016)[2] |
| GHG emissions from electricity generation (2013) | 363.7 Mt CO2 [631.4 TWh × 576 g/kWh] |
| Average industrial tariff (US$/kW·h, 2013) | medium: 20.60[3] |
- Nuclear: 80 TWh (14.8%)
- Brown coal: 134.9 TWh (24.9%)
- Hard coal: 99.4 TWh (18.3%)
- Natural gas: 46.4 TWh (8.6%)
- Wind: 77.8 TWh (14.4%)
- Solar: 37.5 TWh (6.9%)
- Biomass: 47 TWh (8.7%)
- Hydro: 19.1 TWh (3.5%)
In 2014, the electricity sector in Germany was composed of 53% fossil, 17% nuclear and 30% renewable energy sources. Renewables increased their production by 6 TWh or 4% compared to 2013, and accounted for a total of 156 TWh or about 30% of net-generated electricity, despite the fact that hydroelectricity recorded a decrease in production due to unfavorable weather conditions.[6]
While nuclear power production decreased only slightly from 2013 to 2014, electricity generated from brown coal, hard coal, and gas-fired power plants significantly decreased by 3%, 9.5%, and 13.8%, respectively.[6] Germany will phase-out nuclear power by 2022.
Electricity prices
German prices in 2017 were €29.16 cents per kwh for residential customers, an increase of 35% over 2008.[7]
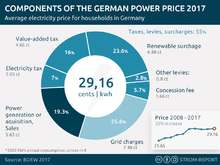
German households and small businesses pay the second highest electricity price in Europe for many years in a row now. More than half of the power price consists of components determined by the state. These include charges for using power grids (24.6%), levies for financing investment in renewable energy (22.1%) and for other kinds of taxes (e.g. GST 16%).[7]
Electricity trade in Germany
Germany, the largest exporter of electricity with 10% of the overall exports, reinforced its position as a net exporter by 20% during the year 2010[8] Germany has grid interconnections with neighboring countries representing 10% of domestic capacity.[9]:5
Electricity per person and by power source
Germany produced power per person in 2008 equal to the EU-15 average (EU-15: 7,409 kWh/person) and 77% of the OECD average (8,991 kWh/person).[10]
On 8 May 2016 renewables supplied 87.6% of Germany's national electricity consumption, albeit under extremely favourable weather conditions.[11]:11
| Use | Production | Export | Exp. % | Fossil | Nuclear | Nuc. % | Other RE* | Bio+waste | Wind | Non RE use* | RE % | |
|---|---|---|---|---|---|---|---|---|---|---|---|---|
| 2004 | 7,445 | 7,476 | 32 | 0.4% | 4,603 | 2,025 | 27.2% | 654 | 194 | 6,597 | 11.4% | |
| 2005 | 7,468 | 7,523 | 55 | 0.7% | 4,674 | 1,977 | 26.5% | 670 | 201 | 6,597 | 11.7% | |
| 2006 | 7,528 | 7,727 | 199 | 2.6% | 4,796 | 1,706 | 22.7% | 856 | 369 | 6,303 | 16.3% | |
| 2008 | 7,450 | 7,693 | 243 | 3.3% | 4,635 | 1,804 | 24.2% | 873 | 381 | 6,196 | 16.8% | |
| 2009 | 7,051 | 7,200 | 149 | 2.1% | 4,314 | 1,644 | 23.3% | 288* | 491 | 461* | 5,811 | 17.6% |
| * This data for Germany is extracted from the international column of a Swedish report * Other RE is waterpower, solar and geothermal electricity and wind power until 2008 * Non RE use = use – production of renewable electricity * RE % = (production of RE / use) * 100% Note: European Union calculates the share of renewable energies in gross electrical consumption. | ||||||||||||
Mode of production
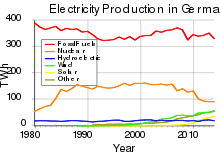
According to the IEA the gross production of electricity was 631 TWh in 2008 which gave the seventh position among the world top producers in 2010. The top seven countries produced 59% of electricity in 2008. The top producers were the United States (21.5%), China (17.1%), Japan (5.3%), Russia (5.1%), India (4.1%), Canada (3.2%) and Germany (3.1%).[13]
In 2015, Germany generated electricity from the following sources:[14]
- 24.0% Lignite
- 18.2% Hard coal
- 14.1% Nuclear
- 12.0% Onshore wind
- 8.8% Natural gas
- 6.8% Biomass
- 5.9% Solar
- 3.0% Hydro
- 1.3% Offshore wind
- 0.9% Waste
- 0.8% Oil
- 4.0% Other
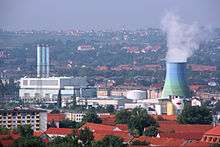
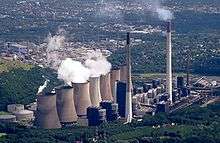
Coal
In 2008, power generation from coal contributed 291 TWh or 46% to the overall production of 631 TWh. Germany remains one of the world's largest power producer from coal besides China (2,733 TWh), USA (2,133 TWh) and India (569 TWh).[13]
Nuclear power
Germany has defined a firm active phase-out policy of nuclear power. Eight nuclear power plants were permanently shut down after the Fukushima accident. All nuclear power plants are to be phased out by the end of 2022. According to BMU this is an opportunity for future generations.[15]
Siemens is the only significant nuclear constructor in Germany and the nuclear share was 3% of their business in 2000.[16] In 2006 the large international bribes of Siemens in the energy and telecommunication business were revealed. The case was investigated, for example, in Nigeria, the United States, Greece and South Korea.[17]
The installed nuclear power capacity in Germany was 20 GW in 2008 and 21 GW in 2004. The production of nuclear power was 148 TWh in 2008 (sixth top by 5.4% of world total) and 167 TWh in 2004 (fourth top by 6.1% of world total).[13][18]
In 2009 compared to 2004 the nuclear power was produced 19% less and its share had declined smoothly over time from 27% units to 23% units. The share of renewable electricity increased, substituting for nuclear power.[10]
Renewable electricity
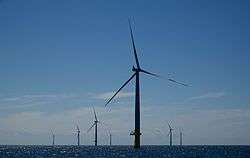
Germany's renewable energy sector is among the most innovative and successful worldwide. Net-generation from renewable energy sources in the German electricity sector has increased from 6.3% in 2000 to about 30% in 2014.[6] For the first time ever, wind, biogas, and solar combined accounted for a larger portion of net electricity production than brown coal in the first half of 2014.[19] While peak-generation from combined wind and solar reached a new all-time high of 74% in April 2014,[20] wind power saw its best day ever on 12 December 2014, generating 562 GWh.[21] Germany has been called "the world's first major renewable energy economy".[22][23]
Transmission network
Grid owners included, in 2008, RWE, EnBW, Vattenfall and E.ON. According to the European Commission the electricity producers should not own the electricity grid to ensure open competition. The European Commission accused E.ON of the misuse of markets in February 2008. Consequently, E.ON sold its share of the network.[24] As of July 2016 the four German TSOs are:
- 50Hertz Transmission GmbH (owned by Elia, formerly owned by Vattenfall)
- Amprion GmbH (RWE)
- Tennet TSO GmbH (owned by TenneT, formerly owned by E.ON)
- TransnetBW (renamed from EnBW Transportnetze AG and a 100% subsidiary of EnBW)
In Germany, there also exists a single-phase AC grid operated at 16.7 Hz to supply power to rail transport, see list of installations for 15kV AC railway electrification in Germany, Austria and Switzerland.
Elbe Crossing 1

Elbe Crossing 1 is a group of masts providing an overhead crossing of a 220 kV three-phase alternating current electric powerline across the River Elbe.[25] Constructed between 1959 and 1962 as part of the line from Stade to Hamburg north, it consists of four masts. Each of the two portal masts is a guyed mast 50 metres in height with a crossbeam at a height of 33 metres. One of these masts stands on the Schleswig-Holstein bank of the Elbe and the other on the Lower Saxony bank. Two identical carrying masts 189 metres in height, each weighing 330 tons, ensure the necessary passage height of 75 metres over the Elbe. One stands on the island of Lühesand, the other in the Buhnenfeld on the Schleswig-Holstein side.
Because of the swampy terrain, each mast's foundation is built on pilings driven into the ground. The Lühesand portal mast rests on 41 pilings and the one on the Buhnenfeld on 57. In contrast to the usual construction of such lattice-steel transmission towers, the direction of the line passes diagonally over the square ground cross section of the pylon, resulting in savings in material. The two crossbeams for the admission of the six conductor cables are at a height of 166 metres and 179 metres. The mast on the Buhnenfeld bears at a height of 30 metres a radar facility belonging to the Water and Navigation Office of the Port of Hamburg. Each portal mast has stairs and gangways for maintenance of flight safety beacons, and has a hoist for heavy loads.
Elbe Crossing 2
Elbe Crossing 2 is a group of transmission towers providing overhead lines for four 380 kV three-phase alternating current (AC) circuits across the German river Elbe.[26][27] It was constructed between 1976 and 1978 to supplement Elbe Crossing 1, and consists of four towers:
- A 76-metre-tall anchor pylon located in Lower Saxony, on the Elbe's southern banks.
- Two carrying pylons, each 227 metres tall. One is located on the island of Lühesand and the other is near Hetlingen in Schleswig-Holstein, on the northern shore.
- These pylons are the tallest pylons in Europe and the sixth tallest of the world. They stand on 95 stakes because of the unfavorable building ground. The base of each pylon measures 45×45 metres and each pylon weighs 980 tons. Crossbeams, which hold up the power cables, are located at heights of 172, 190 and 208 metres. The crossbeams span 56 meters (lowest crossbeam), 72 metres (middle crossbeam) and 57 metres (highest crossbeam). Each pylon has a self-propelled climbing elevator for maintenance of the aircraft warning lights; each elevator runs inside a steel tube in the centre of the mast, around which there is a spiral staircase.
- A 62-metre-tall anchor pylon on the Schleswig-Holstein side.
The enormous height of the two carrying pylons ensures that the passage height requirement of 75 metres over the Elbe demanded by German authorities is met. The height requirement ensures that large ships are able to enter Hamburg's deep-water port.
See also
| Wikimedia Commons has media related to Power plants in Germany. |
References
- ↑ https://www.energy-charts.de/power_inst.htm
- 1 2 https://www.energy-charts.de/energy_pie.htm
- ↑ http://www.bdew.de/internet.nsf/id/17DF3FA36BF264EBC1257B0A003EE8B8/$file/Foliensatz_Energie-Info-EE-und-das-EEG2013_31.01.2013.pdf
- ↑ Electricity production from solar and wind in Germany in 2016 (English version). Germany: Fraunhofer Institute. 3 May 2017. Retrieved 3 May 2015.
- ↑ U.S. Energy Information Administration International Energy Statistics - Electricity Generation, 2011
- 1 2 3 Electricity production from solar and wind in Germany in 2014 (German version) (PDF). Germany: Fraunhofer Institute. 5 January 2015. Retrieved 5 January 2015.
- 1 2 "Electricity Prices in Europe - Who pays the most?". Stromvergleich (in German). Retrieved 2016-08-21.
- ↑ .Germany Power Market, Enerdata Yearbook Publication 2011
- ↑ http://eur-lex.europa.eu/resource.html?uri=cellar:a5bfdc21-bdd7-11e4-bbe1-01aa75ed71a1.0003.01/DOC_1&format=PDF
- 1 2 3 German numbers extracted from Energy in Sweden, Facts and figures, The Swedish Energy Agency, (in Swedish: Energiläget i siffror), Table: Specific electricity production per inhabitant with breakdown by power source (kWh/person), Source: IEA/OECD 2006 T23 Archived 4 July 2011 at the Wayback Machine., 2007 T25 Archived 4 July 2011 at the Wayback Machine., 2008 T26 Archived 4 July 2011 at the Wayback Machine., 2009 T25 Archived 20 January 2011 at the Wayback Machine. and 2010 T49 Archived 16 October 2013 at the Wayback Machine..
- ↑ WWF (September 2016). 15 signals: evidence the energy transition is underway (PDF). Paris, France: WWF France. Retrieved 2016-09-17.
- ↑ Energy in Sweden - facts and figures 2012 - Figures for 2009 Table 53: Electricity production by power source, 2009, in kWh/capita, page 59, 2012
- 1 2 3 IEA Key stats 2010 pages electricity 27 gas 13,25 fossil 25 nuclear 17
- ↑ "Germany is 20 years away from 100 percent renewable power – not!".
- ↑ The path to the energy of the future — safe, affordable and environmentally sound June 2011 BMU Germany
- ↑ Climate Change and Nuclear Power WWF pages 21, 22
- ↑ [Siemensin lahjusskandaali paisuu edelleen] yle 23.11.2006
- ↑ IEA Key energy statistics 2006
- ↑ "Bye-bye brown coal: Germany's new renewables mark - Business Spectator, July 10, 2014". Archived from the original on 13 July 2014.
- ↑ thinkprogress.org, Sets New Record, Generating 74 Percent Of Power Needs From Renewable Energy Archived 23 December 2014 at the Wayback Machine., 13 May 2014
- ↑ RenewEconomy.com.au, Craig Morris, New wind power generation record in Germany, 16 December 2014
- ↑ Germany: The World's First Major Renewable Energy Economy
- ↑ Fraunhofer ISE, Electricity production from solar and wind in Germany – New record in wind power production, p.2, 15 December 2014
- ↑ Lehmänkaupat hämmentävät EU:n energianeuvotteluja, Helsingin Sanomat 1.3.2008 B11
- ↑ "Die 380/220-kV-Elbekreuzung im 220-kV-Netz der Nordwestdeutschen Kraftwerke AG" by Hans Heino Moeller of the NWK, Hamburg
- ↑ "Die Maste der neuen 380-kV-Hochspannungsfreileitung über die Elbe" NWK special edition of "Der Stahlbau", 48th year, issues 11 and 12, pp. 321 to 326, pp. 360 to 366, authors: Friedrich Kießling, Hans Dieter Sperl and Friedrich Wagemann
- ↑ "Die neue 380-kV-Elbekreuzung der Nordwestdeutsche Kraftwerke AG" NWK special edition of "Elektrizitätswirtschaft", 77th year, issue 10 (May 8, 1978) pp. 341 to 352
External links
- Evans, Simon; Pearce, Rosamund (20 September 2016). "Mapped: how Germany generates its electricity". Carbon Brief. London, United Kingdom. Retrieved 2016-10-06.
- Household electricity prices, 2006-2017 (CC image)