Demographic history of Serbia
This article presents the demographic history of Serbia through census results. See Demographics of Serbia for a more detailed overview of the current demographics from 2011 census.
Censuses
Censuses in Serbia ordinarily takes place every 10 years, organized by the Statistical Office of the Republic of Serbia. The last census was in 2011. The censuses were organized in 2011, 2002, 1991, 1981, 1971, 1961, 1953 and 1948, during Communist Yugoslavia. During the Kingdom of Yugoslavia, censuses were conducted in 1931 and 1921; the census in 1941 was never conducted due to the outbreak of WWII.
The independent Principality of Serbia, had conducted the first population census in 1834; the subsequent censuses were conducted in 1841, 1843, 1846, 1850, 1854, 1859, 1863 and 1866 and 1874. During the era Kingdom of Serbia, six censuses were conducted in 1884, 1890, 1895, 1900, 1905 and the last one being in 1910.
19th century
The censuses of 1846, 1850 and 1854 were partially published in Glasnik DSS. The Statistical Office was established in 1862. Since 1863, the Office published Državopis Srbije in twenty volumes, until 1894. Statistical data continued to be published in the new edition of Statistika Kraljevine Srbije, published since 1892. Little is known in historiography about the censuses through 1859.
1834 census
- TOTAL = 678,192[2]
Serbia was divided into 15 counties with 61 districts called kapetanija ("captaincy", after 1834 called srez). Užice was not included due to unrest.
1841 census
- TOTAL = 828,895
1843 census
- TOTAL = 859,545
1846 census
- TOTAL = 915,080
Extracts in Glasnik DSS.[3]
1850 census
- TOTAL = 956,893
Extracts in Glasnik DSS.[4]
1854 census
- TOTAL = 998,919
Extracts in Glasnik DSS.[5]
1859 census
- TOTAL = 1,078,281
Published in 1863.[6]
1863 census
- TOTAL = 1,108,668[7]
1866 census
- TOTAL = 1,216,219[8]
- Serbs = 1,058,189 (87.01%)
- Romanians = 127,545 (10.49%)
- Roma ("Gypsies") = 24,607 (2.02%)
- Germans = 2,589 (0.21%)
- other = 3,256 (0.27%)
This was the first census which recorded literacy, nationality (ethnicity) and citizenship.
1874 census
- Total
1878 census
- TOTAL = 1,669,337[9]
In 1879 there was a census in the four counties ceded to Serbia in 1878.
1884 census
- Total
1890 census
- Total
1895 census
20th century
1905 census
- Total
1910 census
- Total
- 2,922,258
1921 census
- TOTAL = 4,133,478
- Serbs and Croats = 3,339,369 (80.87%)
- Albanians = 420,473 (10.17%)
- Vlachs = 159,549 (3.86%)
- Turks = 149,210 (3.61%)
- Germans = 5,969
- Russians = 4,176
- Slovenes = 3,625
- Czechs and Slovaks = 2,801
- Hungarians = 2,532
- French = 717
- Italians = 503
- Poles = 286
- English = 231
- Ruthenians = 35
- other (mostly Romani) = 44,002
1948 census
- TOTAL = 6,527,966
- Serbs = 4,823,730 (73.89%)
- Albanians = 532,011 (8.15%)
- Hungarians = 433,701 (6.64%)
- Croats = 169,864 (2.60%)
- Montenegrins = 74,860 (1.15%)
- Slovaks = 72,032 (1.1%)
- Bulgarians = 59,395
- Roma = 52,181
- Slovenes = 20,998
- Macedonians = 17,917
- Muslims by nationality = 17,315
 Ethnic structure of Serbia by settlements 1948.
 Ethnic structure of Serbia by municipalities 1948.
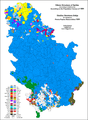
 Share of Serbs in Serbia by municipalities 1948.
1953 census
- TOTAL = 6,979,154
- Serbs = 5,152,939 (73.83%)
- Albanians = 565,513 (8.10%)
- Hungarians = 441,907 (6.33%)
- Croats = 173,246 (2.48%)
- Montenegrins = 86,061 (1.23%)
- Muslims by nationality = 81,081 (1.16%)
- Slovaks = 71,153 (1%)
- Bulgarians = 60,146
- Roma = 58,800
- Macedonians = 27,277
- Slovenes = 20,717
1961 census
- TOTAL = 7,642,227
- Serbs = 5,704,686 (74.65%)
- Albanians = 699,772 (9.16%)
- Hungarians = 449,587 (5.88%)
- Croats = 196,409 (2.57%)
- Montenegrins = 104,753 (1.37%)
- Muslims by nationality = 93,467 (1.22%)
- Slovaks = 73,830
- Bulgarians = 58,243
- Macedonians = 36,288
- Yugoslavs = 20,079
- Slovenes = 19,957
- Roma = 9,826
 Ethnic structure of Serbia by settlements 1961.
 Ethnic structure of Serbia by municipalities 1961.
 Share of Serbs in Serbia by municipalities 1961.
1971 census
- TOTAL = 8,446,591
- Serbs = 6,016,811 (71.23%)
- Albanians = 984,761 (11.66%)
- Hungarians = 430,314 (5.10%)
- Croats = 184,913 (2.19%)
- Muslims by nationality = 154,330 (1.83%)
- Montenegrins = 125,260 (1.48%)
- Yugoslavs = 123,824 (1.47%)
- Slovaks = 76,733
- Romanians = 57,419
- Bulgarians = 53,536
- Roma = 49,894
- Macedonians = 42,675
- Rusyns = 20,608
- Turks = 18,220
- Slovenes = 15,957
- Vlachs = 14,724
 Ethnic structure of Serbia by settlements 1971.
 Ethnic structure of Serbia by municipalities 1971.
 Share of Serbs in Serbia by municipalities 1971.
1981 census
- TOTAL = 9,313,677
- Serbs = 6,182,159 (66.38%)
- Albanians = 1,303,032 (13.99%)
- Yugoslavs = 441,941 (4.75%)
- Hungarians = 390,468 (4.19%)
- Muslims by nationality = 215,166 (2.31%)
- Croats = 149,368 (1.60%)
- Montenegrins = 147,466 (1.58%)
- Roma = 110,956 (1.19%)
- Slovaks = 69,549
- Macedonians = 48,986
- Bulgarians = 33,294
- Slovenes = 12,006
 Ethnic structure of Serbia by municipalities 1981.
 Ethnic structure of Serbia by municipalities 1981.
 Share of Serbs in Serbia by municipalities 1981.
1991 census
- TOTAL (official estimation) = 9,778,991 (registered 8,182,141)
- Serbs = 6,446,595 (65.92%)
- Albanians (official estimation) = 1,674,353 (17.12%), registered 87,372
- Hungarians = 343,800 (3.52%)
- Yugoslavs = 323,643 (3.31%)
- Muslims by nationality (official estimation) = 246,411 (2.52%), registered 237,980
- Roma (official estimation) = 140,237 (1.43%), registered 138,799
- Montenegrins = 139,299 (1.42%)
- Croats = 105,406 (1.08%)
Estimated population:
 Ethnic structure of Serbia by settlements 1991.
 Ethnic structure of Serbia by municipalities 1991.
 Share of Serbs in Serbia by municipalities 1991.
 Religious structure of Serbia by settlements 1991.
 Share of Orthodox in Serbia by municipalities 1991.
Registered population:
 Ethnic structure of Serbia by municipalities 1991.
 Ethnic structure of Serbia by municipalities 1991.
 Share of Serbs in Serbia by municipalities 1991.
1991 census
- TOTAL = 7,822,795
- Serbs = 6,252,405 (79.93%)
- Hungarians = 343,800 (4.39%)
- Yugoslavs = 320,186 (4.09%)
- Muslims by nationality = 180,222 (2.3%)
- Montenegrins = 118,934 (1.52%)
- Croats = 97,344 (1.24%)
- Roma = 94,491 (1.21%)
- Albanians = 78,281 (1%)
- Slovaks = 66,772 (0.85%)
- Macedonians = 45,068 (0.58%)
- Romanians = 42,316 (0.54%)
- Bulgarians = 26,698 (0.34%)
- Bunjevci = 21,434 (0.34%)
- Ukrainians = 5,042 (0.23%)
- Vlachs = 17,804 (0.23%)
- others = 34,698 (0.44%)
- regional affiliation = 4,841 (0.06%)
- unknown = 47,949 (0.61%)
- unspecified = 10,538 (0.13%)
2002 census
- TOTAL = 7,498,001
- Serbs = 6,212,838 (82.86%)
- Hungarians = 293,299 (3.91%)
- Bosniaks = 136,087 (1.82%)
- Roma = 108,193 (1.44%)
- Yugoslavs = 80,721 (1.08%)
- Croats = 70,602 (0.94%)
- Montenegrins = 69,049 (0.92%)
- Albanians = 61,647 (0.82%)
- Slovaks = 59,021 (0.79%)
- Vlachs = 40,054 (0.53%)
- Romanians = 34,576 (0.46%)
- Macedonians = 25,847 (0.35%)
- Bulgarians = 20,497 (0.27%)
- Bunjevci = 20,012 (0.27%)
- Muslims = 19,503 (0.26%)
- Rusyns = 15,905 (0.21%)
- Ukrainians = 5,354 (0.07%)
- Slovenes = 5,104
- Gorani = 4,581
- Germans = 3,901
- Czechs = 2,211
- others = 11,711 (0.19%)
- regional affiliation = 11,485 (0.15%)
- unknown = 75,483 (1.01%)
- unspecified = 107,732 (1.44%)
 Ethnic structure of Serbia by settlements 2002.
 Ethnic structure of Serbia by municipalities 2002.
 Share of Serbs in Serbia by municipalities 2002.
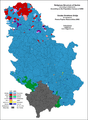 Religious structure of Serbia by settlements 2002.
- Share of Orthodox in Serbia by municipalities 2002.
21st century
2011 census
- TOTAL = 7,186,862
- Serbs = 5,988,150 (83.32%)
- Hungarians = 253,899 (3.53%)
- Roma = 147,604 (2.05%)
- Bosniaks = 145,278 (2.02%)
- Croats = 57,900 (0.81%)
- Slovaks = 52,750 (0.73%)
- Albanians = 5,809 (0.08%) (mostly boycotted the census, estimate c. 50,000 i.e. 0.7%)
- Montenegrins = 38,527 (0.54%)
- Vlachs = 35,330 (0.49%)
- Romanians = 29,332 (0.41%)
- Yugoslavs = 23,303 (0.32%)
- Macedonians = 22,755 (0.32%)
- Muslims = 22,301 (0.31%)
- Bulgarians = 18,543 (0.26%)
- Bunjevci = 16,706 (0.23%)
- Rusyns = 14,246 (0.2%)
- Gorani = 7,767 (0.11%)
- Ukrainians = 4,903 (0.07%)
- Germans = 4,064 (0.06%)
- Slovenes = 4,033 (0.06%)
- others = 17,558 (0.24%)
- regional affiliation = 30,771 (0.43%)
- unknown = 81,740 (1.14%)
- unspecified = 160,346 (2.23%)
 Ethnic structure of Serbia by settlements 2011.
 Linguistic structure of Serbia by settlements 2011.
 Ethnic structure of Serbia by municipalities 2011.
 Linguistic structure of Serbia by municipalities 2011.
 Religious structure of Serbia by municipalities 2011.
 Share of Serbs in Serbia by municipalities 2011.
 Share of Serbian speakers in Serbia by municipalities 2011.
 Share of Orthodox in Serbia by municipalities 2011.
Vital statistics
1880–1887
- Source:[10]
| Average population (x 1,000) | Live births | Deaths | Natural change | Crude birth rate (per 1,000) | Crude death rate (per 1,000) | Natural change (per 1,000) | |
|---|---|---|---|---|---|---|---|
| 1880 | 1,738 | 70,167 | 54,243 | 15,924 | 40.4 | 31.2 | 9.2 |
| 1881 | 1,775 | 80,678 | 43,645 | 37,033 | 45.4 | 24.6 | 20.8 |
| 1882 | 1,814 | 80,274 | 41,648 | 38,626 | 44.3 | 23.0 | 21.3 |
| 1883 | 1,859 | 87,161 | 42,263 | 44,898 | 46.7 | 22.7 | 24.0 |
| 1884 | 1,902 | 90,441 | 47,552 | 42,889 | 47.6 | 25.0 | 22.6 |
| 1885 | 1,940 | 90,627 | 52,318 | 38,309 | 46.7 | 27.0 | 19.7 |
| 1886 | 1,965 | 83,091 | 58,525 | 24,566 | 42.3 | 29.7 | 12.6 |
| 1887 | 2,008 | 93,911 | 50,481 | 43,430 | 46.8 | 25.1 | 21.7 |
1900–1912
- Source:[11]
| Average population (x 1,000) | Live births | Deaths | Natural change | Crude birth rate (per 1,000) | Crude death rate (per 1,000) | Natural change (per 1,000) | |
|---|---|---|---|---|---|---|---|
| 1900 | 2,470 | 105,000 | 58,000 | 47,000 | 42.4 | 23.5 | 18.9 |
| 1901 | 2,520 | 96,000 | 53,000 | 43,000 | 38.0 | 21.0 | 17.0 |
| 1902 | 2,570 | 98,000 | 57,000 | 41,000 | 38.0 | 22.3 | 15.7 |
| 1903 | 2,580 | 106,000 | 60,000 | 46,000 | 40.9 | 23.5 | 17.4 |
| 1904 | 2,650 | 106,000 | 56,000 | 50,000 | 39.8 | 21.1 | 18.7 |
| 1905 | 2,660 | 100,000 | 65,000 | 35,000 | 37.3 | 24.8 | 12.5 |
| 1906 | 2,690 | 113,000 | 66,000 | 47,000 | 42.0 | 24.5 | 17.5 |
| 1907 | 2,770 | 111,000 | 62,000 | 49,000 | 40.0 | 22.4 | 17.6 |
| 1908 | 2,820 | 104,000 | 67,000 | 37,000 | 36.8 | 23.7 | 13.1 |
| 1909 | 2,840 | 110,000 | 83,000 | 27,000 | 38.7 | 29.3 | 9.4 |
| 1910 | 2,870 | 112,000 | 64,000 | 48,000 | 39.0 | 22.4 | 16.6 |
| 1911 | 2,940 | 107,000 | 64,000 | 43,000 | 36.3 | 21.8 | 14.5 |
| 1912 | 2,980 | 114,000 | 63,000 | 51,000 | 38.3 | 21.1 | 17.1 |
1950–2017
Data for Serbia excluding Kosovo.
- Source:[12]
| Average population (x 1000) | Live births | Deaths | Natural change | Crude birth rate (per 1000) | Crude death rate (per 1000) | Natural change (per 1000) | Total fertility rate | |
|---|---|---|---|---|---|---|---|---|
| 1950 | 5 970 | 163 297 | 76 851 | 86 446 | 27.4 | 12.9 | 14.5 | 3,51 |
| 1951 | 6 043 | 145 197 | 80 034 | 65 163 | 24.0 | 13.2 | 10.8 | 3,07 |
| 1952 | 6 112 | 161 306 | 67 870 | 93 436 | 26.4 | 11.1 | 15.3 | 3,33 |
| 1953 | 6 188 | 151 672 | 68 168 | 83 504 | 24.5 | 11.0 | 13.5 | 3,03 |
| 1954 | 6 274 | 152 569 | 62 610 | 89 959 | 24.3 | 10.0 | 14.3 | 3,05 |
| 1955 | 6 358 | 140 396 | 65 179 | 75 217 | 22.1 | 10.3 | 11.8 | 2,81 |
| 1956 | 6 425 | 132 078 | 67 055 | 65 023 | 20.6 | 10.4 | 10.1 | 2,66 |
| 1957 | 6 481 | 118 535 | 64 885 | 53 650 | 18.3 | 10.0 | 8.3 | 2,38 |
| 1958 | 6 535 | 118 425 | 55 564 | 62 861 | 18.1 | 8.5 | 9.6 | 2,45 |
| 1959 | 6 585 | 114 872 | 60 850 | 54 022 | 17.4 | 9.2 | 8.2 | 2,40 |
| 1960 | 6 635 | 119 298 | 61 872 | 57 426 | 18.0 | 9.3 | 8.7 | 2,56 |
| 1961 | 6 693 | 115 222 | 57 990 | 57 232 | 17.2 | 8.7 | 8.6 | 2,51 |
| 1962 | 6 752 | 110 008 | 62 830 | 47 178 | 16.3 | 9.3 | 7.0 | 2,47 |
| 1963 | 6 809 | 108 324 | 57 778 | 50 546 | 15.9 | 8.5 | 7.4 | 2,46 |
| 1964 | 6 863 | 103 847 | 62 100 | 41 747 | 15.1 | 9.0 | 6.1 | 2,51 |
| 1965 | 6 916 | 106 699 | 58 856 | 47 843 | 15.4 | 8.5 | 6.9 | 2,43 |
| 1966 | 6 974 | 103 775 | 55 471 | 48 304 | 14.9 | 8.0 | 6.9 | 2,45 |
| 1967 | 7 027 | 103 491 | 62 915 | 40 576 | 14.7 | 9.0 | 5.8 | 2,40 |
| 1968 | 7 078 | 103 621 | 60 932 | 42 689 | 14.6 | 8.6 | 6.0 | 2,41 |
| 1969 | 7 127 | 105 478 | 68 152 | 37 326 | 14.8 | 9.6 | 5.2 | 2,27 |
| 1970 | 7 171 | 102 453 | 67 211 | 35 242 | 14.3 | 9.4 | 4.9 | 2,40 |
| 1971 | 7 214 | 104 070 | 65 872 | 38 198 | 14.4 | 9.1 | 5.3 | 2,30 |
| 1972 | 7 258 | 106 859 | 70 822 | 36 037 | 14.7 | 9.8 | 5.0 | 2,28 |
| 1973 | 7 303 | 108 361 | 67 152 | 41 209 | 14.8 | 9.2 | 5.6 | 2,31 |
| 1974 | 7 351 | 110 458 | 66 457 | 44 001 | 15.0 | 9.0 | 6.0 | 2,32 |
| 1975 | 7 401 | 112 945 | 69 590 | 43 355 | 15.3 | 9.4 | 5.9 | 2,35 |
| 1976 | 7 452 | 114 035 | 68 565 | 45 470 | 15.3 | 9.2 | 6.1 | 2,28 |
| 1977 | 7 503 | 111 510 | 68 924 | 42 586 | 14.9 | 9.2 | 5.7 | 2,26 |
| 1978 | 7 550 | 110 622 | 71 986 | 38 636 | 14.7 | 9.5 | 5.1 | 2,23 |
| 1979 | 7 611 | 109 953 | 72 306 | 37 647 | 14.4 | 9.5 | 4.9 | 2,14 |
| 1980 | 7 688 | 109 597 | 76 180 | 33 417 | 14.3 | 9.9 | 4.3 | 2,26 |
| 1981 | 7 729 | 103 407 | 78 086 | 25 321 | 13.4 | 10.1 | 3.3 | 2,24 |
| 1982 | 7 738 | 106 575 | 78 473 | 28 102 | 13.8 | 10.1 | 3.6 | 2,31 |
| 1983 | 7 747 | 108 003 | 83 506 | 24 497 | 13.9 | 10.8 | 3.2 | 2,23 |
| 1984 | 7 754 | 107 036 | 82 742 | 24 294 | 13.8 | 10.7 | 3.1 | 2,21 |
| 1985 | 7 759 | 101 938 | 81 836 | 20 102 | 13.1 | 10.5 | 2.6 | 2,22 |
| 1986 | 7 759 | 99 419 | 83 977 | 15 442 | 12.8 | 10.8 | 2.0 | 2,21 |
| 1987 | 7 757 | 98 279 | 83 426 | 14 853 | 12.7 | 10.8 | 1.9 | 2,24 |
| 1988 | 7 755 | 97 471 | 83 616 | 13 855 | 12.6 | 10.8 | 1.8 | 2,22 |
| 1989 | 7 773 | 91 270 | 85 256 | 6 014 | 11.7 | 11.0 | 0.8 | 2,09 |
| 1990 | 7 806 | 90 590 | 85 932 | 4 658 | 11.6 | 11.0 | 0.6 | 2,11 |
| 1991 | 7 836 | 90 378 | 89 072 | 1 306 | 11.5 | 11.4 | 0.2 | 1,80 |
| 1992 | 7 852 | 86 877 | 93 475 | -6 598 | 11.1 | 11.9 | -0.8 | 1,77 |
| 1993 | 7 848 | 87 931 | 95 121 | -7 190 | 11.2 | 12.1 | -0.9 | 1,90 |
| 1994 | 7 843 | 85 292 | 93 011 | -7 719 | 10.9 | 11.9 | -1.0 | 1,87 |
| 1995 | 7 837 | 86 236 | 93 933 | -7 697 | 11.0 | 12.0 | -1.0 | 1,70 |
| 1996 | 7 828 | 82 548 | 98 370 | -15 822 | 10.5 | 12.6 | -2.0 | 1,85 |
| 1997 | 7 831 | 79 716 | 98 068 | -18 352 | 10.2 | 12.5 | -2.3 | 1,76 |
| 1998 | 7 568 | 76 330 | 99 376 | -23 046 | 10.1 | 13.1 | -3.0 | 1,68 |
| 1999 | 7 540 | 72 222 | 101 444 | -29 222 | 9.6 | 13.5 | -3.9 | 1,62 |
| 2000 | 7 516 | 73 764 | 104 042 | -30 278 | 9.8 | 13.8 | -4.0 | 1,48 |
| 2001 | 7 503 | 78 435 | 99 008 | -20 573 | 10.5 | 13.2 | -2.7 | 1,58 |
| 2002 | 7 500 | 78 101 | 102 785 | -24 684 | 10.4 | 13.7 | -3.3 | 1,57 |
| 2003 | 7 481 | 79 025 | 103 946 | -24 921 | 10.6 | 13.9 | -3.3 | 1,59 |
| 2004 | 7 463 | 78 186 | 104 320 | -26 134 | 10.5 | 14.0 | -3.5 | 1,57 |
| 2005 | 7 441 | 72 180 | 106 771 | -34 591 | 9.7 | 14.3 | -4.6 | 1,45 |
| 2006 | 7 412 | 70 997 | 102 884 | -31 887 | 9.6 | 13.9 | -4.3 | 1,43 |
| 2007 | 7 382 | 68 102 | 102 805 | -34 703 | 9.2 | 13.9 | -4.7 | 1,38 |
| 2008 | 7 350 | 69 083 | 102 711 | -33 628 | 9.4 | 14.0 | -4.6 | 1,42 |
| 2009 | 7 321 | 70 299 | 104 000 | -33 701 | 9.6 | 14.2 | -4.6 | 1,45 |
| 2010 | 7 291 | 68 304 | 103 211 | -34 907 | 9.4 | 14.2 | -4.8 | 1,42 |
| 2011 | 7 234 | 65 598 | 102 935 | -37 337 | 9.0 | 14.2 | -5.2 | 1,41 |
| 2012 | 7 195 | 67 257 | 102 400 | -35 143 | 9.3 | 14.1 | -4.8 | 1,45 |
| 2013 | 7 163 | 65 554 | 100 300 | -34 746 | 9.1 | 14.0 | -4.9 | 1,44 |
| 2014 | 7 132 | 66 461 | 101 247 | -34 786 | 9.3 | 14.1 | -4.8 | 1,47 |
| 2015 | 7 095 | 65 657 | 103 678 | -38 021 | 9.3 | 14.6 | -5.3 | 1,47 |
| 2016 | 7 058 | 64 734 | 100 834 | -36 100 | 9.2 | 14.3 | -5.1 | 1,46 |
| 2017 | 7 020 | 64 894 | 103 722 | -38 828 | 9.2 | 14.8 | -5.6 | 1,48 |
See also
References
- ↑ Censuses in 19th century Serbia: inventory of preserved microdata (PDF), Rostock: Max-Planck, 2012
- ↑ Лепосава Цвијетић: Попис становништва и имовине у Србији 1834. године, Београд 1984. године (PDF)
- ↑ Jovan Gavrilović, “Prilog za geografiju i statistiku Srbije. Glavni izvod popisa Srbije u godini 1846”, Glasnik DSS III (1851), pp.186–190.
- ↑ Jovan Gavrilović, “Prilog za geografiju i statistiku Srbije. Glavni izvod popisa Srbije u godini 1850”, Glasnik DSS IV (1852), pp. 227–248
- ↑ Jovan Gavrilović, “Glavni izvod popisa u Srbiji godine 1854/55”, Glasnik DSS IX (1857), pp. 224–226.
- ↑ „Izvestije podnešeno g. Ministru Finansije o čislu žitelja Srbije u godini 1859“, Državopis Srbije I (1863), pp.86–97.
- ↑ Halpern, J., 1972. Town and countryside in Serbia in the nineteenth-century, social and household structure as reflected in the census of 1863.
- ↑ "Serbien". Geographisches_Handbuch_zu_Andrees_Handatlas. 1882.
- 1 2 "Serbien". Geographisches_Handbuch_zu_Andrees_Handatlas. 1902.
- ↑ "Archived copy" (PDF). Archived from the original (PDF) on 2014-09-04. Retrieved 2014-09-04.
- ↑ B.R. Mitchell. European historical statistics. 1750-1975.
- ↑ "Démographie des pays développés - Bases de données en ligne - Les chiffres - Ined - Institut national d'études démographiques". Ined.fr. Retrieved 2016-09-29.
Sources
- Pavlović, Mirjana; Prelić, Mladena (2015). "The state, statistics, minorities and power: Ethnic "others" in the Duchy and Kingdom of Serbia as viewed through the lens of national census". Glasnik Etnografskog instituta SANU. 63 (1): 147–165. doi:10.2298/GEI1501147P.
- Barjaktarović, Mirko (1970). Zečević, Slobodan, ed. "O etničkom opredeljenju". Гласник Етнографског музеја у Београду. Etnografski muzej u Beogradu. 33: 69–92. GGKEY:PXCNL8YTPDP.
- Stojković, Dragana (1990). "UTICAJ MIGRACIJA NA NACIONALNU STRUKTURU STANOVNIŠTVA SRBIJE" (PDF). Etnološke sveske. 11: 33–42.
- Ђорђевић, Тихомир. "Насељавање Србије, за време прве владе кнеза Милоша Обреновића (1815-1839)." Гласник Српског географског друштва 5 (1921): 116-139.
External links
 | ||
| ||