California's 22nd congressional district
| California's 22nd congressional district | |
|---|---|
.tif.png) California's 22nd congressional district - since January 3, 2013. | |
| Current Representative | Devin Nunes (R–Tulare) |
| Ethnicity | |
| Cook PVI | R+8[2] |
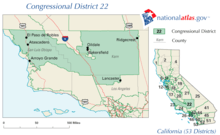
California's 22nd congressional district is a congressional district in the U.S. state of California. The district is currently represented by Republican Devin Nunes.
The 22nd congressional district is centered in the San Joaquin Valley, in Fresno and Tulare counties. The district includes most of eastern Fresno, as well as all of Clovis, Tulare, and Visalia.
From 2002–2013 the 22nd formerly covered parts of San Luis Obispo, Kern, and Los Angeles counties. The district was anchored in Bakersfield and took in most of San Luis Obispo County. Most of that district is now the 23rd district, while the current 22nd covers most of the territory previously in the 21st district.
Recent election results from statewide races
| Year | U.S. President | U.S. Senator (Class 1) | U.S. Senator (Class 3) | Governor of California |
|---|---|---|---|---|
| 1992 | Clinton 41.1–35.4% | Feinstein 48.7–43.3% | Herschensohn 47.6–43.5% | — |
| 1994 | — | Huffington 46.9–43.5% | — | Wilson 58.2–37.7% |
| 1996 | Dole 44.2–44.0% | — | — | — |
| 1998 | — | — | ?? | ?? |
| 2000 | Bush 48.8–44.6%[3] | Feinstein 47.8–42.7%[4] | — | — |
| 2002 | — | — | — | Simon 64.3–28.8%[5] |
| 2003 | — | — | — | Recall: Yes 76.8–23.2%[6] |
| Schwarzenegger 62.9–15.6%[7] | ||||
| 2004 | Bush 67.9–31.0%[8] | — | Jones 59.7–35.5%[9] | — |
| 2006 | — | Mountjoy 57.3–37.4%[10] | — | Schwarzenegger 73.8–22.0%[11] |
| 2008 | McCain 59.7–38.3%[12] | — | — | — |
| 2010 | — | — | Fiorina 63.9–28.8% | Whitman 58.5–34.4% |
| 2012 | Romney 56.6–41.6% | ?? | — | — |
| 2014 | — | — | — | ?? |
| 2016 | Trump 52.1–42.6% | — | Harris 52.7–47.3% | — |
| 2018 | — | TBD | — | TBD |
List of representatives
| Representative | Party | Dates | Electoral history | Counties |
|---|---|---|---|---|
| District created | January 3, 1943 | [Data unknown/missing.] | ||
 John J. Phillips |
Republican | January 3, 1943 – January 3, 1953 |
Redistricted to the 29th district. | Imperial, Orange, Riverside |
.jpg) Joseph F. Holt |
Republican | January 3, 1953 – January 3, 1961 |
Retired. | Los Angeles |
.jpg) James C. Corman |
Democratic | January 3, 1961 – January 3, 1975 |
Redistricted to the 21st district. | |
 Carlos J. Moorhead |
Republican | January 3, 1975 – January 3, 1983 |
Redistricted from the 20th district. Redistricted to the 27th district. | |
| January 3, 1983 – January 3, 1993 |
Los Angeles (northern L.A. suburbs) | |||
 Michael Huffington |
Republican | January 3, 1993 – January 3, 1995 |
Retired to run for U.S. Senator. | San Luis Obispo, Santa Barbara |
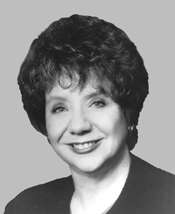 Andrea Seastrand |
Republican | January 3, 1995 – January 3, 1997 |
Lost re-election. | |
 Walter Capps |
Democratic | January 3, 1997 – October 28, 1997 |
Died. | |
| Vacant | October 28, 1997 – March 17, 1998 | |||
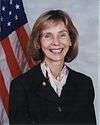 Lois Capps |
Democratic | March 17, 1998 – January 3, 2003 |
Redistricted to the 23rd district. | |
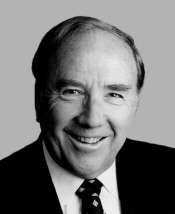
 Bill Thomas |
Republican | January 3, 2003 – January 3, 2007 |
Redistricted from the 21st district. Retired. |
Kern, Los Angeles (Lancaster), inland San Luis Obispo |
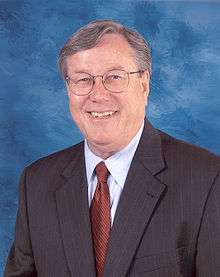
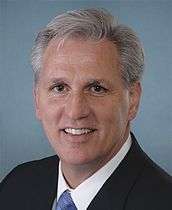 Kevin McCarthy |
Republican | January 3, 2007 – January 3, 2013 |
Redistricted to the 23rd district. | |
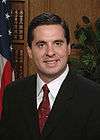 Devin Nunes |
Republican | January 3, 2013 – Present |
Redistricted from the 21st district. | Portions of Fresno and Tulare Counties, including the cities of Fresno, Clovis, Tulare, and Visalia. |
Election results
|
1942 • 1944 • 1946 • 1948 • 1950 • 1952 • 1954 • 1956 • 1958 • 1960 • 1962 • 1964 • 1966 • 1968 • 1970 • 1972 • 1974 • 1976 • 1978 • 1980 • 1982 • 1984 • 1986 • 1988 • 1990 • 1992 • 1994 • 1996 • 1998 (Special) • 1998 • 2000 • 2002 • 2004 • 2006 • 2008 • 2010 • 2012 • 2014 • 2016 |
1942
| Party | Candidate | Votes | % | ||
|---|---|---|---|---|---|
| Republican | John J. Phillips | 42,765 | 57.6 | ||
| Democratic | N. E. West | 31,440 | 42.4 | ||
| Total votes | 74,205 | 100.0 | |||
| Turnout | |||||
| Republican win (new seat) | |||||
1944
| Party | Candidate | Votes | % | |
|---|---|---|---|---|
| Republican | John J. Phillips (incumbent) | 88,537 | 100.0 | |
| Turnout | ||||
| Republican hold | ||||
1946
| Party | Candidate | Votes | % | |
|---|---|---|---|---|
| Republican | John J. Phillips (incumbent) | 59,935 | 62.1 | |
| Democratic | Ray Adkinson | 36,649 | 37.9 | |
| Total votes | 96,584 | 100.0 | ||
| Turnout | ||||
| Republican hold | ||||
1948
| Party | Candidate | Votes | % | |
|---|---|---|---|---|
| Republican | John J. Phillips (incumbent) | 115,697 | 100.0 | |
| Turnout | ||||
| Republican hold | ||||
1950
| Party | Candidate | Votes | % | |
|---|---|---|---|---|
| Republican | John J. Phillips (incumbent) | 114,497 | 100.0 | |
| Turnout | ||||
| Republican hold | ||||
1952
| Party | Candidate | Votes | % | ||
|---|---|---|---|---|---|
| Republican | Joseph F. Holt | 85,039 | 60.5 | ||
| Democratic | Dean E. McHenry | 55,534 | 39.5 | ||
| Total votes | 140,573 | 100.0 | |||
| Turnout | |||||
| Republican win (new seat) | |||||
1954
| Party | Candidate | Votes | % | |
|---|---|---|---|---|
| Republican | Joseph F. Holt (incumbent) | 65,165 | 58.2 | |
| Democratic | William M. "Bill" Costley | 46,875 | 41.8 | |
| Total votes | 112,040 | 100.0 | ||
| Turnout | ||||
| Republican hold | ||||
1956
| Party | Candidate | Votes | % | |
|---|---|---|---|---|
| Republican | Joseph F. Holt (incumbent) | 97,317 | 59.8 | |
| Democratic | Irving Glasband | 65,314 | 40.2 | |
| Total votes | 162,631 | 100.0 | ||
| Turnout | ||||
| Republican hold | ||||
1958
| Party | Candidate | Votes | % | |
|---|---|---|---|---|
| Republican | Joseph F. Holt (incumbent) | 87,785 | 55.4 | |
| Democratic | Irving Glasband | 70,777 | 44.6 | |
| Total votes | 158,562 | 100.0 | ||
| Turnout | ||||
| Republican hold | ||||
1960
| Party | Candidate | Votes | % | |||
|---|---|---|---|---|---|---|
| Democratic | James C. Corman | 104,919 | 51.1 | |||
| Republican | Lemoine Blanchard | 100,321 | 48.9 | |||
| Total votes | 205,240 | 100.0 | ||||
| Turnout | ||||||
| Democratic gain from Republican | ||||||
1962
| Party | Candidate | Votes | % | |
|---|---|---|---|---|
| Democratic | James C. Corman (incumbent) | 75,294 | 53.6 | |
| Republican | Charles S. Foote | 65,087 | 46.4 | |
| Total votes | 140,381 | 100.0 | ||
| Turnout | ||||
| Democratic hold | ||||
1964
| Party | Candidate | Votes | % | |
|---|---|---|---|---|
| Democratic | James C. Corman (incumbent) | 94,141 | 50.5 | |
| Republican | Robert C. Cline | 92,133 | 49.5 | |
| Total votes | 186,274 | 100.0 | ||
| Turnout | ||||
| Democratic hold | ||||
1966
| Party | Candidate | Votes | % | |
|---|---|---|---|---|
| Democratic | James C. Corman (incumbent) | 94,420 | 53.5 | |
| Republican | Robert C. Cline | 82,207 | 46.5 | |
| Total votes | 176,627 | 100.0 | ||
| Turnout | ||||
| Democratic hold | ||||
1968
| Party | Candidate | Votes | % | |
|---|---|---|---|---|
| Democratic | James C. Corman (incumbent) | 102,332 | 56.9 | |
| Republican | Joe Holt | 74,433 | 41.4 | |
| Peace and Freedom | Hugh Manes | 3,024 | 1.7 | |
| Total votes | 179,789 | 100.0 | ||
| Turnout | ||||
| Democratic hold | ||||
1970
| Party | Candidate | Votes | % | |
|---|---|---|---|---|
| Democratic | James C. Corman (incumbent) | 95,256 | 59.4 | |
| Republican | Tom Hayden | 63,297 | 39.5 | |
| American Independent | Callis R. Johnson | 1,880 | 1.1 | |
| Total votes | 160,433 | 100.0 | ||
| Turnout | ||||
| Democratic hold | ||||
1972
| Party | Candidate | Votes | % | |
|---|---|---|---|---|
| Democratic | James C. Corman (incumbent) | 121,352 | 67.6 | |
| Republican | Bruce P. Wolfe | 52,664 | 29.3 | |
| Peace and Freedom | Ralph L. Shroyer | 5,583 | 3.1 | |
| Total votes | 179,599 | 100.0 | ||
| Turnout | ||||
| Democratic hold | ||||
1974
| Party | Candidate | Votes | % | |
|---|---|---|---|---|
| Republican | Carlos Moorhead (inc.) | 78,983 | 55.8 | |
| Democratic | Richard Hallin | 62,770 | 44.2 | |
| Total votes | 141,753 | 100.0 | ||
| Turnout | ||||
| Republican hold | ||||
1976
| Party | Candidate | Votes | % | |
|---|---|---|---|---|
| Republican | Carlos Moorhead (inc.) | 114,769 | 62.6 | |
| Democratic | Robert S. Henry | 68,543 | 37.4 | |
| Total votes | 183,312 | 100.0 | ||
| Turnout | ||||
| Republican hold | ||||
1978
| Party | Candidate | Votes | % | |
|---|---|---|---|---|
| Republican | Carlos Moorhead (inc.) | 99,502 | 64.6 | |
| Democratic | Robert S. Henry | 54,442 | 35.4 | |
| Total votes | 153,944 | 100.0 | ||
| Turnout | ||||
| Republican hold | ||||
1980
| Party | Candidate | Votes | % | |
|---|---|---|---|---|
| Republican | Carlos Moorhead (inc.) | 115,241 | 63.9 | |
| Democratic | Pierce O'Donnell | 57,477 | 31.9 | |
| Libertarian | William V. Susel | 7,705 | 4.3 | |
| Total votes | 180,423 | 100.0 | ||
| Turnout | ||||
| Republican hold | ||||
1982
| Party | Candidate | Votes | % | |
|---|---|---|---|---|
| Republican | Carlos Moorhead (inc.) | 145,831 | 73.6 | |
| Democratic | Harvey L. Goldhammer | 46,521 | 23.5 | |
| Libertarian | Robert T. Gerringer | 5,870 | 3.0 | |
| Total votes | 198,222 | 100.0 | ||
| Turnout | ||||
| Republican hold | ||||
1984
| Party | Candidate | Votes | % | |
|---|---|---|---|---|
| Republican | Carlos Moorhead (inc.) | 184,981 | 85.2 | |
| Libertarian | Michael B. Yauch | 32,036 | 14.8 | |
| Total votes | 217,017 | 100.0 | ||
| Turnout | ||||
| Republican hold | ||||
1986
| Party | Candidate | Votes | % | |
|---|---|---|---|---|
| Republican | Carlos Moorhead (inc.) | 141,096 | 73.8 | |
| Democratic | John G. Simmons | 44,036 | 23.0 | |
| Libertarian | Jona Joy Bergland | 3,114 | 1.6 | |
| Peace and Freedom | Joel Lorimer | 2,930 | 1.5 | |
| Total votes | 191,176 | 100.0 | ||
| Turnout | ||||
| Republican hold | ||||
1988
| Party | Candidate | Votes | % | |
|---|---|---|---|---|
| Republican | Carlos Moorhead (inc.) | 164,699 | 69.5 | |
| Democratic | John G. Simmons | 61,555 | 26.0 | |
| Peace and Freedom | Shirley Rachel Isaacson | 6,298 | 2.7 | |
| Libertarian | Ted Brown | 4,259 | 1.8 | |
| Total votes | 235,811 | 100.0 | ||
| Turnout | ||||
| Republican hold | ||||
1990
| Party | Candidate | Votes | % | |
|---|---|---|---|---|
| Republican | Carlos Moorhead (inc.) | 108,634 | 60.0 | |
| Democratic | David Bayer | 61,630 | 34.1 | |
| Libertarian | William H. Wilson | 6,702 | 3.7 | |
| Peace and Freedom | Jan B. Tucker | 3,963 | 2.2 | |
| Total votes | 180,929 | 100.0 | ||
| Turnout | ||||
| Republican hold | ||||
1992
| Party | Candidate | Votes | % | |
|---|---|---|---|---|
| Republican | Michael Huffington | 131,242 | 52.5 | |
| Democratic | Gloria Ochoa | 87,328 | 34.9 | |
| Green | Mindy Lorenz | 23,699 | 9.5 | |
| Libertarian | William Howard Dilbeck | 7,553 | 3.0 | |
| No party | Bialosky (write-in) | 104 | 0.1% | |
| Total votes | 249,926 | 100.0 | ||
| Turnout | ||||
| Republican hold | ||||
1994
| Party | Candidate | Votes | % | |
|---|---|---|---|---|
| Republican | Andrea Seastrand | 102,987 | 49.27 | |
| Democratic | Walter Capps | 101,424 | 48.53 | |
| Libertarian | David L. Bersohn | 4,597 | 2.20 | |
| Total votes | 209,008 | 100.0 | ||
| Turnout | ||||
| Republican hold | ||||
1996
| Party | Candidate | Votes | % | |||
|---|---|---|---|---|---|---|
| Democratic | Walter Capps | 118,299 | 48.5 | |||
| Republican | Andrea Seastrand (incumbent) | 107,987 | 44.3 | |||
| Independent | Steven Wheeler | 9,845 | 4.0 | |||
| Reform | Richard Porter | 3,975 | 1.6 | |||
| Libertarian | David Bersohn | 2,233 | 0.9 | |||
| Natural Law | Dawn Tomastik | 1,847 | 0.7 | |||
| Total votes | 244,186 | 100.0 | ||||
| Turnout | ||||||
| Democratic gain from Republican | ||||||
1998 (Special)
| Party | Candidate | Votes | % | |
|---|---|---|---|---|
| Democratic | Lois Capps | 93,392 | 53.46 | |
| Republican | Tom Bordonaro | 78,224 | 44.78 | |
| Libertarian | Robert Bakhaus | 3,079 | 1.76 | |
| Total votes | 174,695 | 100.00 | ||
| Turnout | ||||
| Democratic hold | ||||
1998
| Party | Candidate | Votes | % | |
|---|---|---|---|---|
| Democratic | Lois Capps (incumbent) | 111,388 | 55.09 | |
| Republican | Tom J. Bordonaro Jr. | 86,921 | 42.99 | |
| Libertarian | Robert Bakhaus | 2,618 | 1.29 | |
| Reform | Richard D. "Dick" Porter | 1,263 | 0.62 | |
| Total votes | 202,190 | 100.0 | ||
| Turnout | ||||
| Democratic hold | ||||
2000
| Party | Candidate | Votes | % | |
|---|---|---|---|---|
| Democratic | Lois Capps (incumbent) | 135,538 | 53.2 | |
| Republican | Mike Stoker | 113,094 | 44.4 | |
| Reform | Richard D. "Dick" Porter | 2,490 | 0.9 | |
| Libertarian | Joe Furcinite | 2,060 | 0.8 | |
| Natural Law | J. Carlos Aguirre | 1,888 | 0.7 | |
| Total votes | 255,070 | 100.0 | ||
| Turnout | ||||
| Democratic hold | ||||
2002
| Party | Candidate | Votes | % | |||
|---|---|---|---|---|---|---|
| Republican | Bill Thomas | 120,473 | 73.4 | |||
| Democratic | Jaime A. Corvera | 38,988 | 23.7 | |||
| Libertarian | Frank Coates | 4,824 | 2.9 | |||
| Total votes | 164,285 | 100.0 | ||||
| Turnout | ||||||
| Republican gain from Democratic | ||||||
2004
| Party | Candidate | Votes | % | |
|---|---|---|---|---|
| Republican | Bill Thomas (incumbent) | 209,384 | 100.0 | |
| Turnout | ||||
| Republican hold | ||||
2006
| Party | Candidate | Votes | % | |
|---|---|---|---|---|
| Republican | Kevin McCarthy | 133,278 | 70.8 | |
| Democratic | Sharon M. Beery | 55,226 | 29.2 | |
| Total votes | 188,504 | 100.0 | ||
| Turnout | ||||
| Republican hold | ||||
2008
| Party | Candidate | Votes | % | |
|---|---|---|---|---|
| Republican | Kevin McCarthy (incumbent) | 224,549 | 100.0 | |
| Total votes | 224,549 | 100.0 | ||
| Turnout | ||||
| Republican hold | ||||
2010
| Party | Candidate | Votes | % | |
|---|---|---|---|---|
| Republican | Kevin McCarthy (incumbent) | 173,490 | 98.8 | |
| Independent | John Uebersax (write-in) | 2,173 | 1.2 | |
| Total votes | 175,663 | 100.0 | ||
| Turnout | ||||
| Republican hold | ||||
2012
| Party | Candidate | Votes | % | |
|---|---|---|---|---|
| Republican | Devin Nunes (incumbent) | 132,386 | 61.9 | |
| Democratic | Otto Lee | 81,555 | 38.1 | |
| Total votes | 213,941 | 100.0 | ||
| Republican hold | ||||
2014
| Party | Candidate | Votes | % | |
|---|---|---|---|---|
| Republican | Devin Nunes (incumbent) | 96,053 | 72.0 | |
| Democratic | Suzanna "Sam" Aguilera-Marrero | 37,289 | 28.0 | |
| Total votes | 133,342 | 100.0 | ||
| Republican hold | ||||
2016
| Party | Candidate | Votes | % | |
|---|---|---|---|---|
| Republican | Devin Nunes (incumbent) | 158,755 | 67.6 | |
| Democratic | Louie J. Campos | 76,211 | 32.4 | |
| Total votes | 234,966 | 100.0 | ||
| Republican hold | ||||
Living former Members
As of April 2015, there are five former members of the U.S. House of Representatives from California's 22nd congressional district that are currently living. The most recent representative to die was Carlos Moorhead (1975–1993) on November 23, 2011. The most recently serving representative to die was Walter Capps (1997), who died in office on October 28, 1997.
| Representative | Term in office | Date of birth (and age) |
|---|---|---|
| Michael Huffington | 1993–1995 | September 3, 1947 |
| Andrea Seastrand | 1995–1997 | August 5, 1941 |
| Lois Capps | 1998–2003 | January 10, 1938 |
| Bill Thomas | 2003–2007 | December 6, 1941 |
| Kevin McCarthy | 2007–2013 | January 26, 1965 |
Historical district boundaries
See also
References
- ↑ http://www.latimes.com/la-redistricting-map-july-2011,0,5339409.htmlstory#39.71057374407184,-118.14590136718749,5,usCongress,,,current
- ↑ "Partisan Voting Index – Districts of the 115th Congress" (PDF). The Cook Political Report. April 7, 2017. Retrieved April 7, 2017.
- ↑ Statement of Vote (2000 U.S. President)
- ↑ Statement of Vote (2000 U.S. Senator)
- ↑ Statement of Vote (2002 Governor) Archived November 11, 2010, at the Wayback Machine.
- ↑ Statement of Vote (2003 Recall Question)
- ↑ Statement of Vote (2003 Governor)
- ↑ Statement of Vote (2004 U.S. President)
- ↑ Statement of Vote (2004 U.S. Senator) Archived August 10, 2011, at the Wayback Machine.
- ↑ Statement of Vote (2006 U.S. Senator) Archived August 10, 2011, at the Wayback Machine.
- ↑ Statement of Vote (2006 Governor) Archived August 10, 2011, at the Wayback Machine.
- ↑ (2008 U.S. President)
- ↑ 1942 election results
- ↑ 1944 election results
- ↑ 1946 election results
- ↑ 1948 election results
- ↑ 1950 election results
- ↑ 1952 election results
- ↑ 1954 election results
- ↑ 1956 election results
- ↑ 1958 election results
- ↑ 1960 election results
- ↑ 1962 election results
- ↑ 1964 election results
- ↑ 1966 election results
- ↑ 1968 election results
- ↑ 1970 election results
- ↑ 1972 election results
- ↑ 1974 election results
- ↑ 1976 election results
- ↑ 1978 election results
- ↑ 1980 election results
- ↑ 1982 election results
- ↑ 1984 election results
- ↑ 1986 election results
- ↑ 1988 election results
- ↑ 1990 election results
- ↑ 1992 election results
- ↑ 1994 election results
- ↑ 1996 election results
- ↑ 1998 special election results
- ↑ 1998 election results
- ↑ 2000 election results
- ↑ 2002 general election results Archived February 3, 2009, at the Wayback Machine.
- ↑ 2004 general election results Archived 2008-08-21 at the Wayback Machine.
- ↑ 2006 general election results Archived November 27, 2008, at the Wayback Machine.
- ↑ 2008 general election results Archived December 21, 2008, at the Wayback Machine.
- ↑ 2010 general election results
- ↑ 2012 general election results Archived October 19, 2013, at the Wayback Machine.
- ↑ U.S. House of Representatives District 22 - Districtwide Results