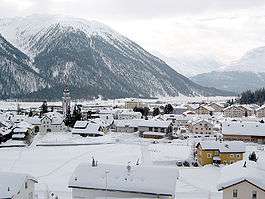
Bever, Switzerland
| Bever | ||
|---|---|---|
 | ||
| ||
 Bever | ||
|
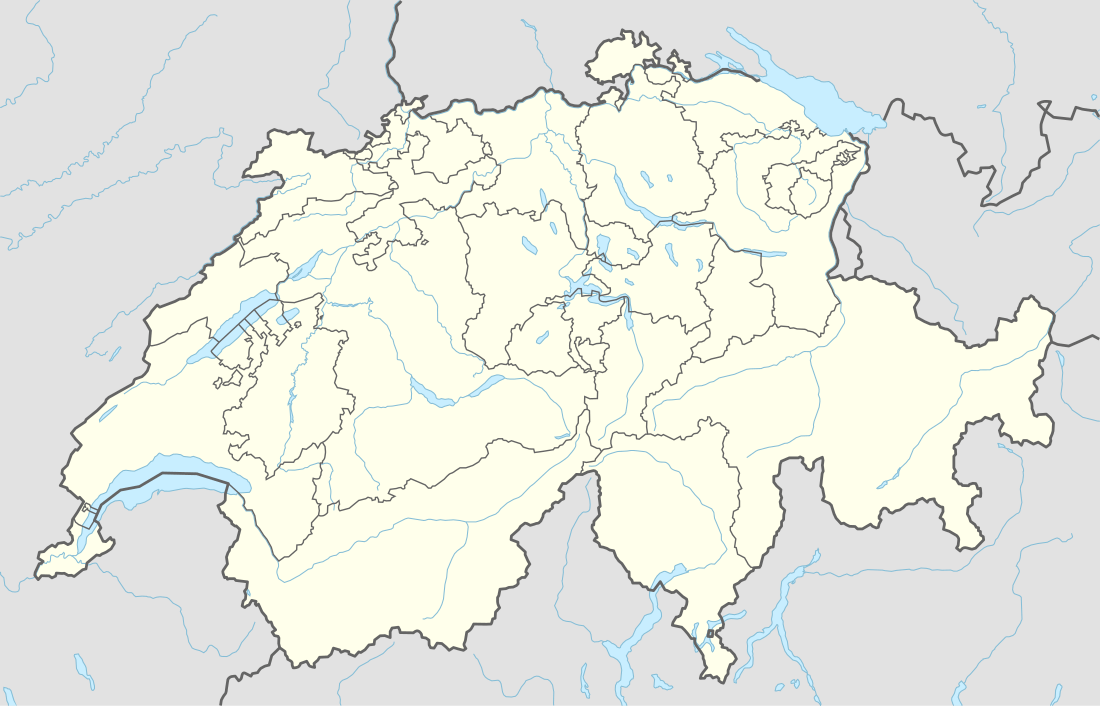
Location of Bever 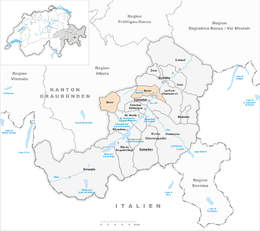 Bever Bever (Canton of Graubünden) | ||
| Coordinates: 46°33′N 9°53′E / 46.550°N 9.883°ECoordinates: 46°33′N 9°53′E / 46.550°N 9.883°E | ||
| Country | Switzerland | |
| Canton | Graubünden | |
| District | Maloja | |
| Area[1] | ||
| • Total | 45.75 km2 (17.66 sq mi) | |
| Elevation | 1,708 m (5,604 ft) | |
| Population (Dec 2016[2]) | ||
| • Total | 616 | |
| • Density | 13/km2 (35/sq mi) | |
| Postal code | 7502 | |
| SFOS number | 3781 | |
| Surrounded by | Bergün/Bravuogn, Bivio, La Punt-Chamues-ch, Marmorera, Samedan, Sankt-Moritz, Silvaplana, Sur, Tinizong-Rona | |
| Website |
www SFSO statistics | |
Bever (Romansh: ![]()
History
Bever is first mentioned in 1139 as ad Bevero.[3]
Geography


Bever has an area, (as of the 2004/09 survey) of 45.75 km2 (17.66 sq mi).[1] Of this area, about 15.3% is used for agricultural purposes, while 15.1% is forested. Of the rest of the land, 1.2% is settled (buildings or roads) and 68.4% is unproductive land. Over the past two decades (1979/85-2004/09) the amount of land that is settled has increased by 9 ha (22 acres) and the agricultural land has decreased by 41 ha (100 acres).[4]
Until 2017 the municipality was located in the Oberengadin sub-district of the Maloja district, after 2017 it was part of the Maloja Region. It is located on the Inn River. It consists of the village of Bever and the hamlet of Spinas at the entrance to the Albula Tunnel. Until 1943 Bever was known as Bevers.[5]
Demographics
Bever has a population (as of December 2016) of 616.[2] As of 2013, 17.4% of the population are resident foreign nationals. Over the last 3 years (2010-2013) the population has changed at a rate of -4.09%. The birth rate in the municipality, in 2013, was 3.2 while the death rate was 7.9 per thousand residents.[4]
As of 2000, the gender distribution of the population was 51.5% male and 48.5% female.[6]
As of 2013, children and teenagers (0–19 years old) make up 14.8% of the population, while adults (20–64 years old) are 68.6% and seniors (over 64 years old) make up 16.6%.[4]
In 2013 there were 289 private households in Bever with an average household size of 2.17 persons. Of the 183 inhabited buildings in the municipality, in 2000, about 39.9% were single family homes and 37.2% were multiple family buildings. Additionally, about 32.8% of the buildings were built before 1919, while 19.1% were built between 1991 and 2000.[7] In 2012 there was no new housing construction in the municipality. The vacancy rate for the municipality, in 2014, was 0.32%.[4]
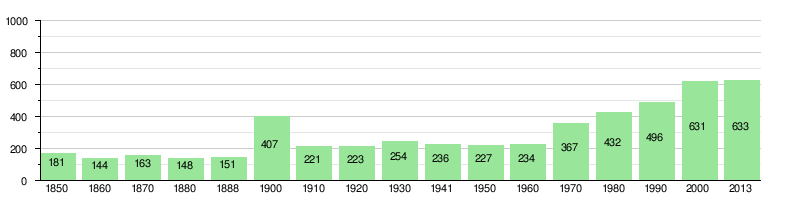
Historic population
The historical population is given in the following chart:[8]
Politics
In the 2015 federal election the most popular party was the SVP with 28.4% of the vote. The next three most popular parties were the SP (26.0%), the FDP (15.5%) and the BDP (14.4%). In the federal election, a total of 242 votes were cast, and the voter turnout was 51.9%. The 2015 election saw a large change in the voting when compared to 2011. The percentage of the vote received by the SVP increased sharply from 22.5% in 2011 to 28.4% in 2015[9]
In the 2007 federal election the most popular party was the SP which received 34.8% of the vote. The next three most popular parties were the SVP (30.9%), the FDP (20%) and the local, small right-wing parties (7.5%).[10]
Education
In Bever about 80.5% of the population (between age 25-64) have completed either non-mandatory upper secondary education or additional higher education (either university or a Fachhochschule).[10]
Economy
As of 2012, there were a total of 335 people employed in the municipality. Of these, a total of 22 people worked in 7 businesses in the primary economic sector. The secondary sector employed 144 workers in 8 separate businesses. Finally, the tertiary sector provided 169 jobs in 50 businesses. In 2013 0.0% of the population received social assistance.[4]
Languages
Most of the population (as of 2000) speaks German (66.6%), with Romansh being second most common (18.9%) and Italian being third (11.7%).[10] Until the mid 19th Century, the entire population spoke the Upper-Engadin Romansh dialect of Puter. Due to increasing trade with the outside world, Romansh usage began to decline. In 1880 about 81% spoke Romansh as a first language, while in 1910 it was only 59%. The last time that Romansh was the majority language in Bever was in 1941. Following World War II German became the clear majority language. However, in the 1990s many German speakers moved away from the village causing the percentage of Romansh speakers to increase. In 1990 there were 47% who understood Romansh in Bever and in 2000 it was 45%.
| Languages of Bever[11] | ||||||||
| Languages | Census 1970 | Census 1980 | Census 1990 | Census 2000 | ||||
| Number | Percent | Number | Percent | Number | Percent | Number | Percent | |
| German | 135 | 36.8% | 175 | 40.5% | 292 | 58.9% | 420 | 66.6% |
| Romansh | 123 | 33.5% | 156 | 36.1% | 120 | 24.2% | 119 | 18.9% |
| Italian | 104 | 28.3% | 87 | 20.1% | 73 | 14.7% | 74 | 11.7% |
| TOTAL | 367 | 100% | 432 | 100% | 496 | 100% | 631 | 100% |
References
- 1 2 Arealstatistik Standard - Gemeindedaten nach 4 Hauptbereichen
- 1 2 Swiss Federal Statistical Office - STAT-TAB, online database – Ständige und nichtständige Wohnbevölkerung nach institutionellen Gliederungen, Geburtsort und Staatsangehörigkeit (in German) accessed 30 August 2017
- ↑ Bever in German, French and Italian in the online Historical Dictionary of Switzerland.
- 1 2 3 4 5 Swiss Federal Statistical Office - Regional portraits Archived January 5, 2016, at the Wayback Machine. accessed 2 May 2016
- ↑ Amtliches Gemeindeverzeichnis der Schweiz published by the Swiss Federal Statistical Office (in German) accessed 23 September 2009
- ↑ Graubunden in Numbers Archived September 24, 2009, at the Wayback Machine. (in German) accessed 21 September 2009
- ↑ Swiss Federal Statistical Office STAT-TAB - Thema 09 - Bau- und Wohnungswesen (in German) accessed 5 May 2016
- ↑ Swiss Federal Statistical Office STAT-TAB Bevölkerungsentwicklung nach institutionellen Gliederungen, 1850-2000 (in German) accessed 27 April 2016
- ↑ Swiss Federal Statistical Office - Nationalratswahlen 2015: Stärke der Parteien und Wahlbeteiligung nach Gemeinden Archived 2016-08-02 at the Wayback Machine. (in German) accessed 18 July 2016
- 1 2 3 Swiss Federal Statistical Office Archived January 5, 2016, at the Wayback Machine. accessed 20 October 2009
- ↑ Swiss Federal Statistical Office, Wohnbevölkerung am wirtschaftlichen Wohnsitz nach institutionellen Gliederungen, Hauptsprache und Nationalität, 1970-2000 (in German) accessed 6 September 2016
| Wikimedia Commons has media related to Bever, Switzerland. |
External links
- Bever official website
- Ottavio Clavuot: Bever in Romansh, German, French and Italian in the online Historical Dictionary of Switzerland.