Elections in Austria
| This article is part of a series on the |
| Politics of Austria |
|---|
 |
|
Legislature |
| Foreign relations |
This article provides information on elections and election results in Austria.
On a federal level, there are two main elections: for head of state (Federal President) every six years, and for the 183 seats of the National Council (Nationalrat) every five years by proportional representation.
Austria has a multi-party system. From 1945 to 1986 Austria had two main parties, with a third party also winning seats in the National Council. Since 1986 there have been generally four parties, for a few years even five. At least 4% of the popular vote, or a parliamentary seat in one of the regional constituencies, is needed for representation in the National Council.[1]
In some cases, a referendum can be called on by the Austrian Parliament.
In 2007, the voting age was lowered from 18 to 16 in all federal elections, following some states which had lowered it for state and local elections before that.
Eligibility
Austrian citizens who are 16 years or older may stand at elections. Additionally citizens of European Union member states with a permanent residence in Austria may vote at European Union and municipal elections.[2] Citizens who are sentenced to more than one year of imprisonment lose their voting rights.[3] An exception to the rule is the presidential election, where the minimum age to stand as candidate is 35. Until 2011, members of current or former ruling houses (i.e. members of the Habsburg family) were ineligible for the office.[4]
Latest elections
2017 legislative election
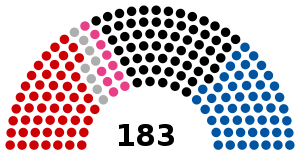 | |||||
| Party | Votes | % | Seats | +/– | |
|---|---|---|---|---|---|
| Austrian People's Party (ÖVP) | 1,586,106 | 31.5 | 62 | +15 | |
| Social Democratic Party of Austria (SPÖ) | 1,351,918 | 26.9 | 52 | 0 | |
| Freedom Party of Austria (FPÖ) | 1,310,614 | 26.0 | 51 | +11 | |
| NEOS – The New Austria (NEOS) | 264,317 | 5.3 | 10 | +1 | |
| Peter Pilz List (PILZ) | 220,088 | 4.4 | 8 | New | |
| The Greens – The Green Alternative (GRÜNE) | 189,467 | 3.8 | 0 | –24 | |
| My Vote Counts! (G!LT) | 47,808 | 1.0 | 0 | New | |
| Communist Party of Austria Plus (KPÖ+) | 39,074 | 0.8 | 0 | 0 | |
| The Whites (WEIßE) | 9,081 | 0.2 | 0 | New | |
| Free List Austria (FLÖ) | 8,845 | 0.2 | 0 | New | |
| New Movement for the Future (NBZ) | 2,723 | 0.1 | 0 | New | |
| Homeless in Politics (ODP) | 757 | 0.0 | 0 | New | |
| Socialist Left Party (SLP) | 705 | 0.0 | 0 | 0 | |
| EU Exit Party (EUAUS) | 681 | 0.0 | 0 | 0 | |
| Christian Party of Austria (CPÖ) | 424 | 0.0 | 0 | 0 | |
| Men's Party (M) | 220 | 0.0 | 0 | 0 | |
| Invalid/blank votes | 50,520 | – | – | – | |
| Total | 5,083,348 | 100 | 183 | 0 | |
| Registered voters/turnout | 6,400,998 | 79.4 | – | – | |
| Source: Austrian Interior Ministry (partial count of postal ballots) | |||||
2016 Presidential election
| Candidates (party membership) | First round | Second round (annulled) | Second round (re-run) | ||||
|---|---|---|---|---|---|---|---|
| Votes | % | Votes | % | Votes | % | ||
| Norbert Hofer (Freedom Party of Austria) | 1,499,971 | 35.1 | 2,220,654 | 49.7 | 2,124,661 | 46.2 | |
| Alexander Van der Bellen (The Greens) | 913,218 | 21.3 | 2,251,517 | 50.3 | 2,472,892 | 53.8 | |
| Irmgard Griss (independent) | 810,641 | 18.9 | |||||
| Rudolf Hundstorfer (Social Democratic Party of Austria) | 482,790 | 11.3 | |||||
| Andreas Khol (Austrian People's Party) | 475,767 | 11.1 | |||||
| Richard Lugner (independent) | 96,783 | 2.3 | |||||
| Valid votes | 4,279,170 | 97.9 | 4,472,171 | 96.4 | 4,597,553 | 96.8 | |
| Invalid votes | 92,655 | 2.1 | 164,875 | 3.6 | 151,851 | 3.2 | |
| Total votes | 4,371,825 | 68.5 | 4,637,046 | 72.7 | 4,749,404 | 74.2 | |
| Eligible voters | 6,382,507 | 6,382,507 | 6,399,572 | ||||
| Source: Bundesministerium für Inneres | |||||||
Past elections
| |||||||||||
| |||||||||||
| State elections | |||||||||||||||||||||||||
|---|---|---|---|---|---|---|---|---|---|---|---|---|---|---|---|---|---|---|---|---|---|---|---|---|---|
| Municipal and mayoral elections |
| ||||||||||||||||||||||||
Election results 1945-2017
| Election year | SPÖ | KPÖ | ÖVP | VdU | FPÖ | Gre | LiF | BZÖ | TS | NEOS | PILZ | Oth | Turnout |
|---|---|---|---|---|---|---|---|---|---|---|---|---|---|
| 1945 | 44.6 | 5.4 | 49.8 | - | - | - | - | - | - | - | - | 0.2 | 94.0 |
| 1949 | 38.7 | 5.1 | 44.0 | 11.7 | - | - | - | - | - | - | - | 0.6 | 96.8 |
| 1953 | 42.1 | 5.3 | 41.3 | 11.0 | - | - | - | - | - | - | - | 0.4 | 95.8 |
| 1956 | 43.0 | 4.4 | 46.0 | - | 6.5 | - | - | - | - | - | - | 0.0 | 95.3 |
| 1959 | 44.8 | 3.3 | 44.2 | - | 7.7 | - | - | - | - | - | - | 0.1 | 94.2 |
| 1962 | 44.0 | 3.0 | 45.4 | - | 7.0 | - | - | - | - | - | - | 0.5 | 93.8 |
| 1966 | 42.6 | 0.4 | 48.3 | - | 5.4 | - | - | - | - | - | - | 3.3 | 93.8 |
| 1970 | 48.4 | 1.0 | 44.7 | - | 5.5 | - | - | - | - | - | - | 0.4 | 91.8 |
| 1971 | 50.0 | 1.4 | 43.1 | - | 5.5 | - | - | - | - | - | - | 0.0 | 92.4 |
| 1975 | 50.4 | 1.2 | 42.9 | - | 5.4 | - | - | - | - | - | - | 0.0 | 92.9 |
| 1979 | 51.0 | 1.0 | 41.9 | - | 6.1 | - | - | - | - | - | - | 0.1 | 92.2 |
| 1983 | 47.6 | 0.7 | 43.2 | - | 5.0 | - | - | - | - | - | - | 3.4 | 92.6 |
| 1986 | 43.1 | 0.7 | 41.3 | - | 9.7 | 4.8 | - | - | - | - | - | 0.3 | 90.5 |
| 1990 | 42.8 | 0.5 | 32.1 | - | 16.6 | 4.8 | - | - | - | - | - | 3.8 | 86.1 |
| 1994 | 34.9 | 0.3 | 27.7 | - | 22.5 | 7.3 | 6.0 | - | - | - | - | 1.4 | 81.9 |
| 1995 | 38.1 | 0.3 | 28.3 | - | 21.9 | 4.8 | 5.5 | - | - | - | - | 1.1 | 86.0 |
| 1999 | 33.2 | 0.5 | 26.9 | - | 26.9 | 7.4 | 3.6 | - | - | - | - | 1.5 | 80.4 |
| 2002 | 36.5 | 0.6 | 42.3 | - | 10.0 | 9.5 | 1.0 | - | - | - | - | 0.3 | 84.3 |
| 2006 | 35.3 | 1.0 | 34.3 | - | 11.0 | 11.1 | - | 4.1 | - | - | - | 3.1 | 78.5 |
| 2008 | 29.3 | 0.8 | 26.0 | - | 17.5 | 10.4 | 2.1 | 10.7 | - | - | - | 4.0 | 78.8 |
| 2013 | 26.8 | 1.0 | 24.0 | - | 20.5 | 12.4 | - | 3.5 | 5.7 | 5.0 | - | 1.0 | 74.9 |
| 2017 | 26.9 | 0.8 | 31.5 | - | 26.0 | 3.9 | - | - | - | 5.3 | 4.4 | 2.3 | 80.0 |
Referendums
Austrian constitution defines two types of referendums on the federal level: binding referendum and non-binding referendum.
Binding referendum
Binding referendum is mandatory:
- if the President should be removed from office before the end of his term (Article 60, Section 6 of the Federal Constitution), and
- in case of comprehensive change of the Federal Constitution (Article 44, Section 3 of the Federal Constitution).
Binding referendum is facultative (not mandatory) in case of non-comprehensive changes in the Federal Constitution. Such facultative referendum is to be conducted if at least one third of the members of the National Council or the Federal Council requests it.
There were only two binding referendums in post-1945 Austria: The nuclear power referendum in 1978 and the European Union membership referendum which was called because accession to European Union was deemed to be a comprehensive change to Constitution.
Non-binding referendum
The National Council has the power to call on a non-binding referendum on matters of great importance. Such referendum is called by majority of members of the National Council. Results of such a referendum are advisory. There was one such referendum in post-1945 Austria:
- the conscription referendum in 2013
The "no" option won, and the National Council accepted the result of the referendum and acted accordingly.
See also
References
- ↑ countriestudies.us - Austrian Electoral System, retrieved 18 May 2010
- ↑ Austrian Ministry of Interior - Elections Overview, retrieved 18 May 2010
- ↑ Austrian Ministry of Interior - Federal System, retrieved 18 May 2010
- ↑ President of Austria: Electoral procedure, retrieved 22 October 2014
External links
- Adam Carr's Election Archive
- Parties and elections
- Austrian Federal Ministry of the Interior: Elections
- NSD: European Election Database - Austria publishes regional level election data; allows for comparisons of election results, 1990-2008