Austrian legislative election, 2002

|
|
|
All 183 seats in the National Council
92 seats needed for a majority |
|---|
| Turnout |
4,982,261 (84.27%)[1] |
|---|
| |
First party |
Second party |
| |
 |
.jpg) |
| Leader |
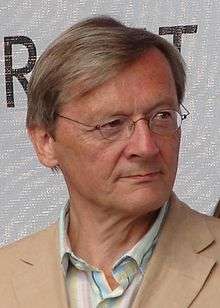
Wolfgang Schüssel |
Alfred Gusenbauer |
| Party |
ÖVP |
SPÖ |
| Leader since |
1995 |
2000 |
| Leader's seat |
9E Vienna South-West |
3 Lower Austria |
| Last election |
52 seats, 26.91% |
65 seats, 33.15% |
| Seats won |
79 |
69 |
| Seat change |
 27 27 |
4 |
| Popular vote |
2,076,833 |
1,792,499 |
| Percentage |
42.30% |
36.51% |
| Swing |
15.39% |
3.36% |
|
| |
Third party |
Fourth party |
| |
 |
 |
| Leader |
Herbert Haupt |
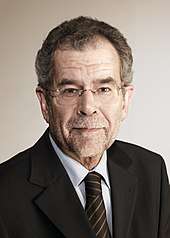
Alexander Van der Bellen |
| Party |
FPÖ |
Greens |
| Leader since |
2002 |
1997 |
| Leader's seat |
2C Carinthia West |
9F Vienna North-West |
| Last election |
52 seats, 26.91% |
14 seats, 7.40% |
| Seats won |
18 |
17 |
| Seat change |
 34 34 |
3 |
| Popular vote |
491,328 |
464,980 |
| Percentage |
10.01% |
9.47% |
| Swing |
16.90% |
2.53% |
|
|
|
Early parliamentary elections were held in Austria on 24 November 2002,[2] after internal divisions in the Freedom Party of Austria (FPÖ) culminating in the Knittelfeld Putsch led to the resignation of several leading FPÖ members. The result was a victory for the ÖVP, which won 79 of the 183 seats, the first time it had been the largest party in the National Council since 1966.[3] It continued its coalition government with the FPÖ, which had lost almost two-thirds of its seats.[4] Voter turnout was 84.3%.[5]
Results
| Party |
Votes |
% |
Seats |
+/– |
|---|
| Austrian People's Party | 2,076,833 | 42.3 | 79 | +27 |
| Social Democratic Party | 1,792,499 | 36.5 | 69 | +4 |
| Freedom Party of Austria | 491,328 | 10.0 | 18 | –34 |
| Green Alternative | 464,980 | 9.5 | 17 | +3 |
| Liberal Forum | 48,083 | 1.0 | 0 | 0 |
| Communist Party of Austria | 27,568 | 0.6 | 0 | 0 |
| Socialist Left Party | 3,906 | 0.1 | 0 | New |
| The Democrats | 2,439 | 0.1 | 0 | New |
| Christian Electoral Community | 2,009 | 0.1 | 0 | 0 |
| Invalid/blank votes | 72,616 | – | – | – |
| Total | 4,982,499 | 100 | 183 | 0 |
| Source: Nohlen & Stöver |
| Popular vote |
|---|
|
|
|
|
|
| ÖVP |
|
42.30% |
| SPÖ |
|
36.51% |
| FPÖ |
|
10.01% |
| GRÜNE |
|
9.47% |
| LIF |
|
0.96% |
| KPÖ |
|
0.56% |
| Other |
|
0.17% |
|
| Parliamentary seats |
|---|
|
|
|
|
|
| ÖVP |
|
43.17% |
| SPÖ |
|
37.70% |
| FPÖ |
|
9.84% |
| GRÜNE |
|
9.29% |
|