Aluminum industry in the United States
The aluminum industry in the United States in 2014 produced 1.72 million metric tons of primary aluminum, worth 3.97 billion dollars, at nine aluminum smelters. In addition, the US produced 1.70 million tons of secondary aluminum from old (post-consumer) scrap, and 1.93 million tons of aluminum from new (manufacturing) scrap. The US was the world's 6th largest producer of primary aluminum in 2014.The industry employed 29,000 people. [1]
Primary production
In 2014, primary aluminum, which is produced from bauxite, was produced by three companies at nine smelters. Primary aluminum is preferred for high-quality uses such as aircraft. The leader in US production was Alcoa. Also operating multiple primary plants was Century Aluminum.
Primary Aluminum Smelters in the US
| Name | Location | Owner | Status and Date |
|---|---|---|---|
| Warrick Plant | Evansville, Indiana | Alcoa | Closed |
| Intalco Plant | Ferndale, Washington | Alcoa | Operating, April 2018[2] |
| St. Laurence Plant | Massena, New York | Alcoa | Closed |
| Massena Plant | Massena, New York | Alcoa | Operating, April 2014[3] |
| Mt Holly Plant | Mount Holly, South Carolina | Century Aluminum | Operating, December 2014[4] |
| Rockdale Plant | Rockdale, Texas | Alcoa | Closed |
| Wenatchee Plant | Wenatchee, Washington | Alcoa | Closed |
| Hawesville Plant | Hawesville, Kentucky | Century Aluminum | Reopened, August 2018[5] |
| Ravenswood Plant | Ravenswood, West Virginia | Century Aluminum | Closed, July 2015[6] |
| Sebree Plant | Sebree, Kentucky | Century Aluminum | Operating, May 2015[7] |
| Columbia Falls Plant | Columbia Falls, Montana | Glencore | Closed in March 2015[8] |
| Noranda Plant | New Madrid, Missouri | Noranda | Idled, March 2016[9] |
| Ormet Plant | Hannibal, Ohio | Ormet | Closed, August 2014[10] |
Secondary production
Secondary production is the recycling of metallic aluminum derived from scrap. Secondary production can be from either new scrap (from aluminum manufacturing), or from old scrap (post-consumer scrap such as recycled aluminum cans).
Raw materials
The principal raw materials for aluminum production are bauxite (for primary production) and scrap (for secondary production).
Primary aluminum production consumes a great deal of electricity, which makes up about a third of the cost. Making a ton of primary aluminum consumes at least 12,500 kW-hr, and most plants consume 14,500 to 15,000 kW-hr per ton of primary aluminum.[11]
Secondary production of a given unit of aluminum requires about 10% of the electricity of primary production.
The United States mined production of bauxite for primary aluminum production is insignificant. In 2013, the US mined only 1.3 percent of the bauxite it used, US mined production being less than 0.1 percent of world production.
International trade
The US imported nearly all the bauxite (the only commercial aluminum ore) used in producing primary aluminum. For years, the US has produced less than 1% of the bauxite used to make aluminum.
The US also imported 33 percent of the aluminum metal that was used in 2014. Of the imported aluminum, 63% came from Canada.[12]
|
| ||||||||||||||||||||||||||||||||||||||||||||||||||||||||||||||||||||||||||||||||||||||||||||||||||||||||||||||||||||||||||||||||||||||||||||||||||||||||||||||||||||||||||||||||||||||||||||||||||||||||||||||||||||||||||||||||||||||||||||||||||||||||||||||||||||||||||||||||||||||||||||||||||||||||||||||||||||
History of US aluminum production
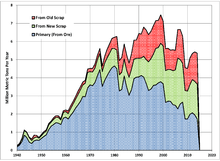
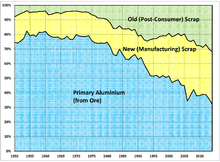
The US used to be a much more important factor in the world primary aluminum market. As recently as 1981, the US produced 30% of the world's primary aluminum, and for many years up through 2000, the US was the world's largest producer of primary aluminum. In 2014, by contrast, the US ranked sixth in primary aluminum production, and provided only 3.5% of world production.
US production of primary aluminum peaked in 1980 at 4.64 million metric tons. Since then, US primary aluminum production has fallen by more than half, but secondary production has increased, making up much of the difference. In the 1950s and 1960s, primary production made up about 80% of the aluminum output. In 2014, primary production made up 32%, while secondary from new scrap made up 36% and secondary from old scrap made up 32% of US aluminum production.[14]
References
- ↑ E. Lee Bray, Aluminum, US Geological Survey, Mineral Commodity Summary 2015, Jan.2015.
- ↑ [https://www.lyndentribune.com/news/alcoa-reacts-to-tariffs-on-foreign-aluminum/article_608323ae-3d8c-11e8-81f2-9fbdc51a3b5b.html
- ↑
- ↑ David Wren, "Century Aluminum completes acquisition of Mt. Holly facility," Post and Courier, 1 Dec. 2015
- ↑
- ↑ Greg Matics, "Century Aluminum announces permanent closure of Ravenswood smelting plant," Jackson Newspapers, 30 July 2015.
- ↑ Associated Press, "Union workers locked out at aluminum smelter," Archived July 11, 2015, at the Wayback Machine. WBKO, 12 May 2015.
- ↑ "Columbia Falls Aluminum Co permanently closed," Daily Interlake, 3 March 2015.
- ↑ Noranda Aluminum,
- ↑ [John Milam, "Shutdown of Ohio aluminum giant Ormet appears final," People's World, 5 August 2014
- ↑ Stuart Burns, "Power costs in the production of primary aluminum," Archived 2014-06-09 at the Wayback Machine. Metal mIner, 26 Feb. 2009.
- ↑ E. Lee Bray, Aluminum, US Geological Survey, Mineral Commodity Summary 2015, Jan.2015.
- 1 2 "2015 Minerals Yearbook - ALUMINUM [ADVANCE RELEASE]" (PDF). U.S. Geological Survey. Aluminum Statistics and Information
- ↑ E. Lee Bray, Aluminum, US Geological Survey, Mineral Commodity Summary 2015, Jan.2015.