Alabama's 6th congressional district
Coordinates: 33°18′35.54″N 86°44′23.31″W / 33.3098722°N 86.7398083°W
| Alabama's 6th congressional district | |
|---|---|
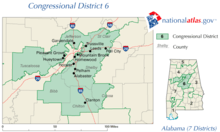
.tif.png) Alabama's 6th congressional district - since January 3, 2013. | |
| Current Representative | Gary Palmer (R–Vestavia Hills) |
| Area | 4,649 sq mi (12,040 km2) |
| Distribution |
|
| Population (2016) | 706,308[2] |
| Median income | $61,413 |
| Ethnicity |
|
| Occupation |
|
| Cook PVI | R+26[3] |
Alabama's 6th congressional district is a United States congressional district in Alabama that elects a representative to the United States House of Representatives. It is composed of the wealthier portions of Birmingham, nearly all of Jefferson County outside Birmingham, and the entirety of Bibb, Blount, Chilton, Coosa, and Shelby counties.
It is currently represented by Republican Gary Palmer.
Character
Once encompassing all of Birmingham and Jefferson County, Alabama's 6th Congressional District is now the suburban Birmingham-area district, with nearly all of the urban precincts having been removed since 1992. Due to a continual process of redistricting by Republican state governments since the late 1990s, the 6th District has taken on an increasingly unusual shape (typical of gerrymandered districts) and become one of the most Republican districts in the country. In 2004 it voted 78% for Republican George W. Bush in the presidential election (in keeping with the current proportion of white majority of its population). John McCain swept the district in 2008, taking 75.91% of the vote while Barack Obama received 23.28%.
The demography of the district consists mostly of middle and upper middle-class white-collar white families whose adults work in Birmingham. Increasingly, the population of the Birmingham districts has become racially and politically polarized. Since the 1990s, most wealthier whites moved from the city to the suburbs, settling in newer housing in nearby Shelby County (which increased in population by 44% in the 1990s and is now more than 90% white). The African American population of the region has remained largely in more urban areas, even as the upper-class live in income-related neighborhoods.
Birmingham was once the vanguard district for steel production and metalworking in the South, but restructuring of heavy industries hollowed out the economy of the city, taking many jobs with it. The economy of the 6th district since the late 20th century has centered on the banking industry (Birmingham is the second-largest banking area in the South) and health care/medical research. Voters are socially conservative; however, fiscal conservatism is the most salient feature of this district.
History
Alabama's 6th Congressional District was originally created in 1843. It encompassed the northeastern portion of Alabama, approximately the modern counties of DeKalb, Jackson, Madison, Marshall, Etowah, St. Clair, Blount and Cullman.
The district had a population of 66,111 as of the 1840 U.S. Census, which made it the second least populous district in Alabama.[4] Neither Cullman County nor Etowah County existed at the time, so only the eastern portion of what today is Cullman County was in the district. In the case of St. Clair County, it appears that only about half of St. Clair County in 1843 was in the district.
The district was redrawn in 1855. This was done in time for the election of representatives to the 34th Congress which was held August 6, 1855. The new boundaries put Cherokee County in the 6th District and removed St. Clair County. These boundaries remained in place until the Civil War.
When Alabama again elected representatives to the U.S. Congress in 1868 for the halfway completed 40th Congress, the 6th District consisted of northwestern Alabama. The only county remaining in the district from before was Blount County. It also encompassed Jefferson, Marion, Walker, Morgan, Limestone, Franklin, Lauderdale and Winston counties. Colbert County did not exist at the time, but was part of Franklin County. This was one of the areas of Alabama where the Democrats soonest regained control after the Civil War.
In 1876, the 6th District was redrawn again. The sixth-most northern counties (including Colbert County which now existed) were transferred to the new Alabama 8th Congressional District, while the six counties southwestward from Jefferson County were transferred to the 6th District.
This set of boundaries only existed for one election. By the time of the 1878 election, Cullman County had been formed. It was in the 6th District, but Blount County was moved to the 8th District. The boundaries did not exactly correspond to county lines at that time, and with another change in county boundaries by 1880 even more area in the general vicinity of Blount County was moved to the 7th District. This process was continued in 1884 with the removal of Cullman County from the district.
The year of 1892 saw more changes in the boundaries of the 6th District. Winston County was moved to the 7th District. At the same time Jefferson County was placed in the new 9th District. By this time the 6th District consisted of west central Alabama. In the 1892 election there were about 22,000 votes cast in the 6th District as opposed to 30,000 cast in the 9th District.[5]
In 1902, Perry County and some other areas in the southern portion of Alabama's 9th Congressional District were transferred to the 6th District. The state legislature did not redistrict for several decades, resulting in urban and industrial areas being under-represented in congressional and state districts. It was forced to redistrict after a 1972 Supreme Court case based on the principle of one man-one vote.
Voting
| Election results from statewide races | ||
|---|---|---|
| Year | Office | Results |
| 2016 | President | Trump 71 - 26% |
| 2012 | President | Romney 74 - 25% |
| 2008 | President | McCain 76 - 23% |
| 2004 | President | Bush 78 - 22% |
| 2000 | President | Bush 74 - 25% |
List of representatives
| Congress | Representative | Party | Years | Notes | |||
|---|---|---|---|---|---|---|---|
| District created March 4, 1843 | |||||||
| 28th-29th |  |
Democratic | March 4, 1843 – March 3, 1847 | Redistricted from the At-large district | |||
| 30th-36th |  |
March 4, 1847 – January 30, 1861 | |||||
| 37th-39th | (1861–1868) | Civil War and Reconstruction | |||||
| 40th |  |
Republican | July 21, 1868 – March 3, 1869 | ||||
| 41st |  |
Democratic | March 4, 1869 – March 3, 1871 | ||||
| 42nd-43rd | |
March 4, 1871 – March 3, 1875 | |||||
| 44th-45th |  |
March 4, 1875 – March 3, 1879 | |||||
| 46th | |
March 4, 1879 – October 1, 1880 | Resigned after accepting position as President of the University of Alabama | ||||
| 46th | |
December 8, 1880 – March 3, 1881 | |||||
| 47th-48th | |
March 4, 1881 – March 3, 1885 | |||||
| 49th | |
March 4, 1885 – March 3, 1887 | |||||
| 50th-59th |  |
March 4, 1887 – March 3, 1907 | |||||
| 60th-63rd |  |
March 4, 1907 – March 3, 1915 | |||||
| 64th-74th |  |
March 4, 1915 – January 3, 1937 | |||||
| 75th-80th |  |
January 3, 1937 – January 3, 1949 | |||||
| 81st-82nd |  |
January 3, 1949 – January 3, 1953 | |||||
| 83rd-87th |  |
January 3, 1953 – January 3, 1963 | Redistricted to the At-large district | ||||
| 88th | January 3, 1963 – January 3, 1965 | District inactive, all representatives elected At-large on a general ticket | |||||
| 89th-96th |  |
Republican | January 3, 1965 – January 3, 1981 | ||||
| 97th |  |
January 3, 1981 – January 3, 1983 | |||||
| 98th-102nd |  |
Democratic | January 3, 1983 – January 3, 1993 | ||||
| 103rd-113th | 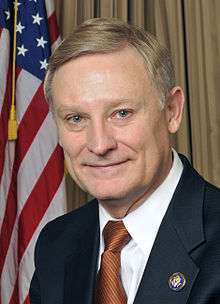 |
Republican | January 3, 1993 – January 3, 2015 | ||||
| 114th- current |  |
January 3, 2015 – present | |||||
Previous election results
2002
| Party | Candidate | Votes | % | ± | |
|---|---|---|---|---|---|
| Republican | Spencer T. Bachus III* | 178,171 | 90% | ||
| Libertarian | J. Holden McAllister | 19,639 | 10% | ||
| Write-in | Write-ins | 536 | 0.27% | ||
| Majority | 158,532 | 80% | |||
| Total votes | 198,346 | 100% | |||
| Republican hold | |||||
2004
| Party | Candidate | Votes | % | ± | |
|---|---|---|---|---|---|
| Republican | Spencer T. Bachus III* | 264,819 | 99% | ||
| Write-in | Write-ins | 3,224 | 1% | ||
| Majority | 261,595 | 98% | |||
| Total votes | 268,043 | 100% | |||
| Republican hold | |||||
2006
| Party | Candidate | Votes | % | ± | |
|---|---|---|---|---|---|
| Republican | Spencer T. Bachus III* | 163,514 | 98% | ||
| Write-in | Write-ins | 2,786 | 2% | ||
| Majority | 160,728 | 96% | |||
| Total votes | 166,300 | 100% | |||
| Republican hold | |||||
2008
| Party | Candidate | Votes | % | ± | |
|---|---|---|---|---|---|
| Republican | Spencer T. Bachus III* | 280,902 | 98% | ||
| Write-in | Write-ins | 6,335 | 2% | ||
| Majority | 274,567 | 96% | |||
| Total votes | 287,237 | 100% | |||
| Republican hold | |||||
2010
| Party | Candidate | Votes | % | ± | |
|---|---|---|---|---|---|
| Republican | Spencer T. Bachus III* | 205,288 | 100% | ||
| Majority | 205,288 | 100% | |||
| Total votes | 205,288 | 100% | |||
| Republican hold | |||||
2012
| Party | Candidate | Votes | % | ± | |
|---|---|---|---|---|---|
| Republican | Spencer T. Bachus III* | 219,016 | 71% | ||
| Democratic | Penny Bailey | 88,102 | 29% | ||
| Majority | 130,914 | 42% | |||
| Total votes | 307,118 | 100% | |||
| Republican hold | |||||
2014
| Party | Candidate | Votes | % | ± | |
|---|---|---|---|---|---|
| Republican | Gary Palmer | 135,935 | 76% | ||
| Democratic | Mark Lester | 42,291 | 24% | ||
| Majority | 93,754 | 52% | |||
| Total votes | 178,449 | 100% | |||
| Republican hold | |||||
2016
| Party | Candidate | Votes | % | |
|---|---|---|---|---|
| Republican | Gary Palmer* | 245,313 | 74.96% | |
| Democratic | David Putnam | 83,709 | 24.95% | |
| No party | Write-ins | 284 | 0.09% | |
| Total votes | 329,306 | 100.00% | ||
| Turnout | ||||
| Republican hold | ||||
Living former Members
As of April 2015, there are three former members of the U.S. House of Representatives from Alabama's 6th congressional district that are currently living. The most recent representative to die was John H. Buchanan, Jr., March 5, 2018 (1965-1981)
| Representative | Term in office | Date of birth (and age) |
|---|---|---|
| Ben Erdreich | 1983 - 1993 | December 9, 1938 |
| Spencer Bachus | 1993 - 2015 | December 28, 1947 |
Historical district boundaries
See also
References
- ↑ Geography, US Census Bureau. "Congressional Districts Relationship Files (state-based)". www.census.gov.
- ↑ Bureau, Center for New Media & Promotion (CNMP), US Census. "My Congressional District". www.census.gov.
- ↑ "Partisan Voting Index – Districts of the 115th Congress" (PDF). The Cook Political Report. April 7, 2017. Retrieved April 7, 2017.
- ↑ Parson, Stanley B., William W. Beach and Michael J. Durbin. United States Congressional Districts and Data, 1843-1883 (Westport: Greenwood Press, 1986) p. 1
- ↑ United States Congressional Elections. Michael J. Dubin. p. 295
- Martis, Kenneth C. (1989). The Historical Atlas of Political Parties in the United States Congress. New York: Macmillan Publishing Company.
- Martis, Kenneth C. (1982). The Historical Atlas of United States Congressional Districts. New York: Macmillan Publishing Company.
- Congressional Biographical Directory of the United States 1774–present