List of Category 5 Atlantic hurricanes
A total of 36 recorded tropical cyclones have reached Category 5 strength on the Saffir–Simpson hurricane wind scale in the Atlantic Ocean north of the equator, the Caribbean Sea, and the Gulf of Mexico. Hurricanes of such intensity occur once every three years in this region on average.
Only in seven seasons—1932, 1933, 1961, 2005, 2007, 2017, and 2019—has more than one Category 5 hurricane formed. Only in 2005 have more than two Category 5 hurricanes formed, and only in 2007 and 2017 did more than one make landfall at Category 5 strength.[1] The years 2016 through 2019 are the longest sequence of consecutive years which all featured at least one Category 5 hurricane each.
Background
| Saffir–Simpson scale | ||||||
| TD | TS | C1 | C2 | C3 | C4 | C5 |
A Category 5 Atlantic hurricane is one that is considered by the United States National Hurricane Center (NHC), to have had sustained wind speeds greater than 136 knots (157 mph; 252 km/h; 70 m/s) on the Saffir–Simpson scale. The NHC considers sustained wind speeds to be those that occur over a one-minute period at 10 metres (32.8 ft) above ground. These wind speeds are estimated by using a blend of data from a variety of sources, which include observations from nearby ships, reconnaissance aircraft, or automatic weather stations and pictures from various satellites.
Officially, from 1924 to 2019, 36 Category 5 hurricanes have been recorded. No Category 5 hurricanes were observed officially before 1924. It can be presumed that earlier storms reached Category 5 strength over open waters, but the strongest winds were not measured. The anemometer, a device used for measuring wind speed, was invented in 1846. However, during major hurricane strikes, the instruments as a whole were often blown away, leaving the hurricane's peak intensity unrecorded. For example, as the Great Beaufort Hurricane of 1879 struck North Carolina, the anemometer cups were blown away when indicating 138 mph (222 km/h).[2]
As of May 2018, a reanalysis of weather data was ongoing by researchers who may upgrade or downgrade other Atlantic hurricanes currently listed at Categories 4 and 5.[3] For example, the 1825 Santa Ana hurricane is suspected to have reached Category 5 strength.[4] Furthermore, paleotempestological research aims to identify past major hurricanes by comparing sedimentary evidence of recent and past hurricane strikes. For example, a "giant hurricane" significantly more powerful than Hurricane Hattie (Category 5) has been identified in Belizean sediment, having struck the region sometime before 1500.[5]
Officially, the decade with the most Category 5 hurricanes is 2000–2009, with eight Category 5 hurricanes having occurred: Isabel (2003), Ivan (2004), Emily (2005), Katrina (2005), Rita (2005), Wilma (2005), Dean (2007), and Felix (2007). The previous decades with the most Category 5 hurricanes were the 1930s and 1960s, with six occurring between 1930 and 1939 (before naming began).[1]
The most consecutive years to feature at least one Category 5 hurricane each is four, from 2016 to 2019. Six storms have reached that category in these years - Matthew, Irma, Maria, Michael, Dorian, and Lorenzo. Of these, Dorian had the highest winds, at 160 kn (185 mph; 295 km/h), while Maria had the lowest central pressure, at 908 mbar (26.81 inHg).[6]
Nine Atlantic hurricanes—Camille, Allen, Andrew, Isabel, Ivan, Dean, Felix, Irma and Maria—reached Category 5 intensity on more than one occasion; that is, by reaching Category 5 intensity, weakening to a Category 4 status or lower, and then becoming a Category 5 hurricane again. Such hurricanes have their dates shown together. Camille, Andrew, Dean, Felix, Irma, and Maria each attained Category 5 status twice during their lifespans. Allen, Isabel, and Ivan reached Category 5 intensity on three separate occasions. However, no Atlantic hurricane has reached Category 5 intensity more than three times during its lifespan. The 1932 Cuba hurricane holds the record for the most time spent as a Category 5 hurricane (although it took place before satellite or aircraft reconnaissance, so this record may be somewhat suspect). Irma holds the record for the longest continuous span as a Category 5 storm in the satellite era.[1][7]
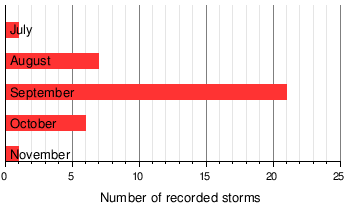
Thirty-six Category 5 hurricanes have been recorded in the Atlantic basin since 1851, when records began. Only one Category 5 has been recorded in July, eight in August, twenty-one in September, six in October, and one in November. There have been no officially recorded June or off-season Category 5 hurricanes.[1]
The July and August Category 5 hurricanes reached their high intensities in both the Gulf of Mexico and the Caribbean Sea. These are the areas most favorable for tropical cyclone development in those months.[1][8]
September sees the most Category 5 hurricanes, with over half of the total. This coincides with the climatological peak of the Atlantic hurricane season, which occurs in early September.[9] September Category 5s reached their strengths in any of the Gulf of Mexico, Caribbean Sea, and open Atlantic. These places are where September tropical cyclones are likely to form.[8] Many of these hurricanes are either Cape Verde-type storms, which develop their strength by having a great deal of open water; or so-called Bahama busters, which intensify over the warm Loop Current in the Gulf of Mexico.[10]
Six of the seven Category 5 hurricanes in October and November (the exception being Michael) reached their intensities in the western Caribbean, a region that Atlantic hurricanes strongly gravitate toward late in the season.[8] This is due to the climatology of the area, which sometimes has a high-altitude anticyclone that promotes rapid intensification late in the season, as well as warm waters.
Systems
| Name | Dates as a Category 5 |
Duration (hours) |
Sustained wind speeds |
Pressure | Areas affected | Deaths | Damage (USD) |
Refs | |
|---|---|---|---|---|---|---|---|---|---|
| "Cuba" | October 19, 1924 | 12 | 165 mph (270 km/h) | 910 hPa (26.87 inHg) | Central America, Mexico, Cuba Florida, The Bahamas | 90 | [11] | ||
| "San Felipe II Okeechobee" | September 13–14, 1928 | 12 | 160 mph (260 km/h) | 929 hPa (27.43 inHg) | Lesser Antilles, The Bahamas United States East Coast, Atlantic Canada | 4,000 | $100 million | ||
| "Bahamas" | September 5–6, 1932 | 24 | 160 mph (260 km/h) | 921 hPa (27.20 inHg) | The Bahamas, Northeastern United States | 16 | |||
| "Camaguey" | November 5–8, 1932 | 78 | 175 mph (280 km/h) | 915 hPa (27.02 inHg) | Lesser Antilles, Jamaica, Cayman Islands Cuba, The Bahamas, Bermuda | 3,103 | $40 million | ||
| "Cuba–Brownsville" | August 30, 1933 | 12 | 160 mph (260 km/h) | 930 hPa (27.46 inHg) | The Bahamas, Cuba, Florida Texas, Tamaulipas | 179 | $27.9 million | ||
| "Tampico" | September 21, 1933 | 12 | 160 mph (260 km/h) | 929 hPa (27.43 inHg) | Jamaica, Yucatán Peninsula | 184 | $5 million | ||
| "Labor Day" | September 3, 1935 | 18 | 185 mph (295 km/h) | 892 hPa (26.34 inHg) | The Bahamas, Florida, Georgia, The Carolinas, Virginia | 408 | |||
| "New England" | September 19–20, 1938 | 18 | 160 mph (260 km/h) | 940 hPa (27.76 inHg) | Southeastern United States, Northeastern United States, Southwestern Quebec | 682 | $306 million | ||
| Carol** | September 3, 1953 | 12 | 160 mph (260 km/h) | 929 hPa (27.43 inHg) | Bermuda, New England, Atlantic Canada | 5 | $2 million | ||
| Janet | September 27–28, 1955 | 18 | 175 mph (280 km/h) | 914 hPa (26.99 inHg) | Lesser Antilles, Central America | 1,023 | $65.8 million | [12] | |
| Esther** | September 17, 1961 | 18 | 160 mph (260 km/h) | 919 hPa (27.14 inHg) | East Coast of the United States | 7 | $6 million | ||
| Hattie | October 31, 1961 | 6 | 165 mph (270 km/h) | 914 hPa (26.99 inHg) | Central America | 319 | $60.3 million | [13][14] | |
| Beulah | September 20, 1967 | 18 | 160 mph (260 km/h) | 923 hPa (27.26 inHg) | The Caribbean, Mexico, Texas | 59 | $208 million | [15] | |
| Camille | August 16–18, 1969 † | 30 | 175 mph (280 km/h) | 900 hPa (26.58 inHg) | Cuba, United States Gulf Coast | 259 | $1.42 billion | [16] | |
| Edith** | September 9, 1971 | 6 | 160 mph (260 km/h) | 943 hPa (27.85 inHg) | The Caribbean, Central America, Mexico, United States Gulf Coast | 37 | $25.4 million | ||
| Anita | September 2, 1977 | 12 | 175 mph (280 km/h) | 926 hPa (27.34 inHg) | Mexico | 11 | Extensive | [17] | |
| David | August 30–31, 1979 | 42 | 175 mph (280 km/h) | 924 hPa (27.29 inHg) | The Caribbean, United States East coast | 2,068 | $1.54 billion | [18][19] | |
| Allen | August 5–9, 1980 † | 72 | 190 mph (305 km/h) | 899 hPa (26.55 inHg) | The Caribbean, Yucatán Peninsula, Mexico, South Texas | 269 | $1.24 billion | [18][20][21] | |
| Gilbert | September 13–14, 1988 | 24 | 185 mph (295 km/h) | 888 hPa (26.22 inHg) | Jamaica, Venezuela, Central America, Hispaniola, Mexico | 318 | $7.1 billion | [22][23] | |
| Hugo | September 15, 1989 | 6 | 160 mph (260 km/h) | 918 hPa (27.11 inHg) | The Caribbean, United States East Coast | 107 | $10 billion | [16][24][25] | |
| Andrew | August 23–24, 1992 † | 16 | 175 mph (280 km/h) | 922 hPa (27.23 inHg) | The Bahamas, Florida, United States Gulf Coast | 65 | $26.5 billion | [16][26] | |
| Mitch | October 26–28, 1998 | 42 | 180 mph (285 km/h) | 905 hPa (26.72 inHg) | Central America, Yucatán Peninsula, South Florida | 19,325 | $6.2 billion | [27][28][29][30] | |
| Isabel | September 11–14, 2003 † | 42 | 165 mph (270 km/h) | 915 hPa (27.02 inHg) | Greater Antilles, Bahamas, Eastern United States, Ontario | 51 | $5.37 billion | [16][31] | |
| Ivan | September 9–14, 2004 † | 60 | 165 mph (270 km/h) | 910 hPa (26.87 inHg) | The Caribbean, Venezuela, United States Gulf Coast | 124 | $23.3 billion | [16][32] | |
| Emily** | July 16, 2005 | 6 | 160 mph (260 km/h) | 929 hPa (27.43 inHg) | Windward Islands, Jamaica, Mexico, Texas | 17 | $1.01 billion | [33] | |
| Katrina | August 28–29, 2005 | 18 | 175 mph (280 km/h) | 902 hPa (26.64 inHg) | Bahamas, United States Gulf Coast | 1,836 | $125 billion | [34] | |
| Rita | September 21–22, 2005 | 24 | 180 mph (285 km/h) | 895 hPa (26.43 inHg) | Cuba, United States Gulf Coast | 125 | $12 billion | [35] | |
| Wilma | October 19, 2005 | 18 | 185 mph (295 km/h) | 882 hPa (26.05 inHg) | Greater Antilles, Central America, Florida | 87 | $29.4 billion | [36][37][38][39] | |
| Dean | August 18–21, 2007 † | 24 | 175 mph (280 km/h) | 905 hPa (26.72 inHg) | The Caribbean, Central America | 45 | $1.76 billion | [18][40][41] | |
| Felix | September 3–4, 2007 † | 24 | 175 mph (280 km/h) | 929 hPa (27.43 inHg) | Nicaragua, Honduras | 133 | $720 million | [42][43][44][45] | |
| Matthew | October 1, 2016 | 12 | 165 mph (270 km/h) | 934 hPa (27.58 inHg) | Antilles, Venezuela, Colombia United States East Coast, Atlantic Canada | 603 | $15.1 billion | [46] | |
| Irma | September 5–9, 2017 † | 72 | 180 mph (285 km/h) | 914 hPa (26.99 inHg) | Cape Verde, The Caribbean, British Virgin Islands U.S. Virgin Islands, Cuba, Florida | 138 | $64.8 billion | [47] | |
| Maria | September 18–20, 2017 † | 28¼ | 175 mph (280 km/h) | 908 hPa (26.81 inHg) | Lesser Antilles, Virgin Islands, Puerto Rico, Dominican Republic, Turks and Caicos Islands | 3,057 | $91.6 billion | [48] | |
| Michael | October 10, 2018 | ½ | 160 mph (260 km/h) | 919 hPa (27.14 inHg) | Central America, United States Gulf Coast (especially Florida Panhandle) | 74 | $25.1 billion | ||
| Dorian | September 1–2, 2019 | 27 | 185 mph (295 km/h) | 910 hPa (26.87 inHg) | Barbados, Windward Islands, Leeward Islands, Virgin Islands, Puerto Rico, The Bahamas, East Coast of the United States, Atlantic Canada, Greenland | 84 | $4.68 billion | [49] | |
| Lorenzo | September 29, 2019 | 3 | 160 mph (260 km/h) | 925 hPa (27.32 inHg) | Cabo Verde, Azores, Western Europe | 19 | $362 million | ||
| Overall reference for Name, dates, duration, winds and pressure:[1] †Discontinuous duration (weakened below Category 5 then restrengthened to that classification at least once) ** indicates storm name was not retired after its usage | |||||||||
Listed by month
|
|
Landfalls
With the exception of Hurricane Lorenzo, which did not make landfall but still brought hurricane-force winds to the Azores, all Atlantic Category 5 hurricanes have made landfall at some location, and all but four (Carol, Esther, Mitch and Isabel) made landfall at some location at major hurricane strength. Most Category 5 hurricanes in the Atlantic make landfall because of their proximity to land in the Caribbean and Gulf of Mexico, where the usual synoptic weather patterns carry them towards land, as opposed to the westward, oceanic mean track of Eastern Pacific hurricanes.[50] Seventeen of the storms made landfall at least once while at Category 5 intensity;[1] 2007 and 2017 are the only years in which two storms made landfall at this intensity.[1]
Many of these systems made landfall shortly after weakening from a Category 5 hurricane. This weakening can be caused by dry air near land, shallower waters due to shelving, interaction with land, replacement of its eyewalls, or cooler waters near shore.[34] In southern Florida, the return period for a Category 5 hurricane is roughly once every 50 years.[51]
The following table lists these hurricanes by landfall intensity. As Lorenzo did not make landfall, it is omitted.
See also
- List of Atlantic hurricanes
- List of Atlantic hurricane seasons
- List of Category 4 Atlantic hurricanes
- List of Category 3 Atlantic hurricanes
- List of Category 5 Pacific hurricanes
- List of Category 4 Pacific hurricanes
References
- "Atlantic hurricane best track (HURDAT version 2)" (Database). United States National Hurricane Center. December 12, 2019.
- Hudgins, James E. (2000). "Tropical cyclones affecting North Carolina since 1586" (PDF). National Weather Service Office Blacksburg, Virginia. National Oceanic and Atmospheric Administration. Archived from the original (PDF) on June 10, 2011. Retrieved November 25, 2010.
- Atlantic Oceanographic & Meteorological Laboratory (June 8, 2010). "Current Hurricane Data Sets". Hurricane Research Division. National Oceanic and Atmospheric Administration. Retrieved November 1, 2018.
The Atlantic Hurricane Database Re-analysis Project is an effort to extend and revise the National Hurricane Center's North Atlantic hurricane database (or HURDAT). Going back to 1851 and revisiting storms in more recent years, information on tropical cyclones is revised using an enhanced collection of historical meteorological data in the context of today's scientific understanding of hurricanes and analysis techniques.
- Donnelly, J. P. (2005). "Evidence of Past Intense Tropical Cyclones from Backbarrier Salt Pond Sediments: A Case Study from Isla de Culebrita, Puerto Rico, USA" (PDF). Journal of Coastal Research. SI42: 201–210. ISSN 0749-0208. Retrieved November 26, 2010.
- Mccloskey, T. A.; Keller, G. (2009). "5000 year sedimentary record of hurricane strikes on the central coast of Belize". Quaternary International. 195 (1–2): 53–68. Bibcode:2009QuInt.195...53M. doi:10.1016/j.quaint.2008.03.003. ISSN 1040-6182.
- "Hurricane Dorian Becomes the 5th Atlantic Category 5 in 4 Years". The Weather Channel. Retrieved September 1, 2019.
- Rappaport, Edward N. "Addendum Hurricane Andrew". National Hurricane Center. National Oceanic and Atmospheric Administration.
- Staff writer (2010). "Tropical Cyclone Climatology". National Hurricane Center. National Oceanic and Atmospheric Administration. Retrieved November 30, 2010.
- Dorst, Neal (June 10, 2010). "Tropical Cyclone FAQ G1) When is hurricane season ?". National Hurricane Center. National Oceanic and Atmospheric Administration. Archived from the original on July 18, 2006. Retrieved November 30, 2010.
- Landsea, Christopher W. (June 8, 2010). "Tropical Cyclone FAQ A2) What is a "Cape Verde" hurricane?". Hurricane Research Division — Atlantic Oceanographic and Meteorological Laboratory. National Oceanic and Atmospheric Administration. Retrieved November 30, 2010.
- Feuer, Steve; Suarez, Ramon Perez; Prieto, Ricardo; Sanchez-Sesma, Jorge (March 2009). "Documentation of Atlantic Tropical Cyclones Changes in HURDAT: Hurricane #10 in 1924". Hurricane Research Division. Retrieved November 1, 2018.
- Dunn, Gordon E.; Davies, Walter R.; Moore, Paul L (1955). "Hurricanes of 1955". Monthly Weather Review. 83 (12): 315–326. Bibcode:1955MWRv...83..315D. doi:10.1175/1520-0493(1955)083<0315:HO>2.0.CO;2. ISSN 1520-0493 – via American Meteorological Society.
- Dunn, Gordon E (1962). "The Hurricane Season of 1961". Monthly Weather Review. 89 (3): 107–108. Bibcode:1962MWRv...90..107D. doi:10.1175/1520-0493(1962)090<0107:THSO>2.0.CO;2. ISSN 0027-0644.
- National Meteorological Services of Belize (November 2, 2006). "Belize Marked 45th Anniversary of Deadly Hurricane Hattie". Belize National Emergency Management Organization. Archived from the original on December 3, 2012. Retrieved December 3, 2012.
- Sugg, Arnold L; Peliser, Joseph M (1967). "The Hurricane Season of 1967". Monthly Weather Review. 96 (4): 242–243. Bibcode:1968MWRv...96..242S. doi:10.1175/1520-0493(1968)096<0242:THSO>2.0.CO;2. ISSN 0027-0644.
- National Hurricane Center (April 1, 2014). "Re-analysis of 1969's Hurricane Camille Completed — Catastrophic hurricane now ranks as second strongest on record" (PDF) (Press release). United States National Oceanic and Atmospheric Administration. Archived (PDF) from the original on March 29, 2014. Retrieved April 1, 2014.
- Lawrence, Miles B (1978). "Atlantic Hurricane Season of 1977". Monthly Weather Review. 106 (4): 536–540. Bibcode:1978MWRv..106..534L. doi:10.1175/1520-0493(1978)106<0534:AHSO>2.0.CO;2. ISSN 1520-0493.
- Centre for Research on the Epidemiology of Disasters. "EM-DAT: The Emergency Events Database". Université catholique de Louvain.
- Hebert, Paul J (1980). "Atlantic Hurricane Season of 1979". Monthly Weather Review. 108 (7): 973–990. Bibcode:1980MWRv..108..973H. doi:10.1175/1520-0493(1980)108<0973:AHSO>2.0.CO;2. ISSN 1520-0493.
- Lawrence, Miles B; Pelissier, Joseph M (1981). "Atlantic Hurricane Season of 1980". Monthly Weather Review. 109 (7): 1567–1582. Bibcode:1981MWRv..109.1567L. doi:10.1175/1520-0493(1981)109<1567:AHSO>2.0.CO;2. ISSN 1520-0493.
- National Hurricane Center. Hurricane Allen July 31 – August 11 (Preliminary Report). United States National Oceanic and Atmospheric Administration's National Weather Service. pp. 1–6. Retrieved December 6, 2012.
- Clark, Gilbert B (October 26, 1988). Preliminary Report: Hurricane Gilbert (PDF) (Report). United States National Hurricane Center. p. 9. Retrieved May 6, 2017.
- Blake, Eric S; Landsea, Christopher W; Gibney, Ethan J; National Hurricane Center (August 2011). The Deadliest, Costliest, and Most Intense United States Tropical Cyclones from 1851 to 2010 (And Other Frequently Requested Hurricane Facts) (PDF) (NOAA Technical Memorandum NWS NHC-6). United States National Oceanic and Atmospheric Administration's National Weather Service. p. 47. Archived (PDF) from the original on November 27, 2012. Retrieved August 16, 2014.
- Lawrence, Miles B (November 15, 1989). Preliminary Report: Hurricane Hugo (PDF) (Report). United States National Hurricane Center. pp. 1–2, 7. Retrieved April 25, 2017.
- Case, Bob; Mayfield, Max (1990). "Atlantic Hurricane Season of 1989". Monthly Weather Review. 118 (5): 1165–1177. Bibcode:1990MWRv..118.1165C. doi:10.1175/1520-0493(1990)118<1165:AHSO>2.0.CO;2. ISSN 1520-0493.
- Rappaport, Edward N (December 10, 1993). Hurricane Andrew: August 16 – 28 (Preliminary Report). United States National Hurricane Center. Retrieved January 1, 2013.
- Guiney, John L; Lawrence, Miles B (April 7, 2017). Hurricane Mitch: October 22 – November 5, 1998 (PDF) (Tropical Cyclone Report). United States National Hurricane Center. Retrieved April 24, 2017.
- "Mitch: The Deadliest Atlantic Hurricane Since 1780". United States National Climatic Data Center. 2004. Archived from the original on July 17, 2012. Retrieved January 13, 2013.
- Inter-American Development Bank. "Central America After Hurricane Mitch- Costa Rica". Archived from the original on December 19, 2005. Retrieved January 13, 2013.
- Inter-American Development Bank. "Central America After Hurricane Mitch- El Salvador". Archived from the original on October 26, 2005. Retrieved January 13, 2013.
- Beven, John L; Cobb, Hugh (April 7, 2017). Hurricane Isabel: September 6–19, 2003 (PDF) (Tropical Cyclone Report). United States National Hurricane Center. Retrieved April 24, 2017.
- Stewart, Stacy R (December 16, 2004). Hurricane Ivan September 2 – 24, 2004 (Tropical Cyclone Report). United States National Hurricane Center. Archived from the original (PDF) on November 28, 2012. Retrieved December 10, 2012.
- Franklin, James L; Brown, Daniel P (March 10, 2006). Hurricane Emily July 11 – 21, 2005 (PDF) (Tropical Cyclone Report). United States National Hurricane Center. Archived from the original (PDF) on April 24, 2017. Retrieved December 10, 2012.
- Knabb, Richard D; Rhome, Jamie R; Brown, Daniel P (December 20, 2005). Hurricane Katrina: August 23 – 30, 2005 (PDF) (Tropical Cyclone Report). United States National Hurricane Center. Retrieved April 24, 2017.
- Knabb, Richard D; Brown, Daniel P; Rhome, Jamie R (March 17, 2006). Hurricane Rita: September 18 - 26, 2005 (PDF) (Tropical Cyclone Report). United States National Hurricane Center. Retrieved December 10, 2012.
- Pasch, Richard J; Blake, Eric S; Cobb III, Hugh D; Roberts, David P (January 12, 2006). Tropical Cyclone Report: Hurricane Wilma: October 15 – 26, 2005 (PDF) (Report). United States National Hurricane Center. Retrieved September 13, 2014.
- Comisión Nacional del Agua (2006). "Resumen del Huracán "Wilma"" (PDF). Archived from the original (PDF) on November 27, 2012. Retrieved December 10, 2012.
- Royster, Amy (December 4, 2005). "Wilma's Waves Devastate Grand Bahama Communities". Palm Beach Post.(subscription required)
- "Hurricane Wilma exacts losses of 704 million dollars: Cuban government". Relief Web. Agence France-Presse. December 4, 2005. Archived from the original on November 27, 2012. Retrieved December 10, 2012.
- Franklin, James L (January 31, 2008). Hurricane Dean: August 13 – 23, 2007 (PDF) (Tropical Cyclone Report). United States National Hurricane Center. Retrieved April 24, 2017.
- Organización de las Naciones Unidas para la Agricultura y la Alimentación (FAO), Nicaragua (2007). "Evaluación de Daños Causados por el Huracán Félix en el Caribe de Nicaragua" (PDF) (in Spanish). Retrieved December 10, 2012.
- Beven, John L (January 16, 2008). Hurricane Felix: August 31 – September 5, 2007 (PDF) (Tropical Cyclone Report). United States National Hurricane Center. Retrieved April 24, 2017.
- Organización de las Naciones Unidas para la Agricultura y la Alimentación (FAO), Nicaragua (2007). "Evaluación de Daños Causados por el Huracán Félix en el Caribe de Nicaragua" (PDF) (in Spanish). Retrieved December 10, 2012.
- Silva, José A (January 29, 2008). "Huracán los terminó de hundir en la pobreza" (in Spanish). El Nuevo Diario. Archived from the original on January 22, 2009. Retrieved December 10, 2012.
- Comisión Permanente de Contingencias, Government of Honduras (September 7, 2007). "Honduras: Informe preliminar de daños por Huracán Félix y últimas lluvias — Copeco — Boletín #53 – 07 de Septiembre 2007" (in Spanish). Reliefweb. Archived from the original on February 17, 2008. Retrieved December 10, 2012.
- Stewart, Stacy R (April 7, 2017). Hurricane Matthew: September 28 – October 9, 2016 (PDF) (Tropical Cyclone Report). United States National Hurricane Center. Retrieved April 24, 2017.
- Cangialosi, Jong P, Layton, Andrew S and Berg, Robbie (March 9, 2018). Hurricane Irma: August 30 – September 12, 2017 (PDF) (Tropical Cyclone Report). United States National Hurricane Center. Retrieved March 13, 2018.CS1 maint: multiple names: authors list (link)
- Richard J. Pasch; Andrew B. Penny; Robbie J. Berg (April 5, 2018). Hurricane Maria (AL152017) (PDF) (Report). Tropical Cyclone Report. National Hurricane Center. Retrieved April 9, 2018.
- "Hurricane Dorian Update Statement". www.nhc.noaa.gov. Retrieved September 1, 2019.
- Landsea, Christopher W (June 8, 2010). "Tropical Cyclone FAQ G8) Why do hurricanes hit the East coast of the U.S., but never the West coast?". Atlantic Oceanographic and Meteorological Laboratory. National Oceanic and Atmospheric Administration. Retrieved November 30, 2010.
- Landsea, Christopher W.; Franklin, James L.; McAdie, Colin J.; Beven, John L.; Gross, James M.; Jarvinen, Brian R.; Pasch, Richard J.; Rappaport, Edward N.; Dunion, Jason P.; Dodge, Peter P. (2004). "A Reanalysis of Hurricane Andrew's Intensity" (PDF). Bulletin of the American Meteorological Society. 85 (11): 1699. Bibcode:2004BAMS...85.1699L. doi:10.1175/BAMS-85-11-1699. ISSN 0003-0007. Retrieved November 30, 2010.
- Mitchell, Charles L (October 1924). "Notes on the West Indian Hurricane of October 14–23, 1924" (PDF). U.S. Weather Bureau. Archived (PDF) from the original on March 19, 2009. Retrieved March 21, 2009.
- Brown, Daniel. "Hurricane Maria Tropical Cyclone Update". National Hurricane Center. Retrieved September 19, 2017.
External links
| 1920s |
|
|---|---|
| 1930s |
|
| 1950s |
|
| 1960s | |
| 1970s | |
| 1980s | |
| 1990s | |
| 2000s | |
| 2010s | |
| |