List of Category 5 Pacific hurricanes
Category 5 hurricanes are tropical cyclones that reach Category 5 intensity on the Saffir–Simpson Hurricane Scale. They are by definition the strongest hurricanes that can form on planet Earth. They are rare in the northeastern Pacific Ocean and generally form only once every several years. In general, Category 5s form in clusters in single years. Landfalls by such storms are rare due to the generally westerly path of tropical cyclones in the northern hemisphere.The term "hurricane" is used for tropical cyclones in the Pacific Ocean, north of the equator and east of the international date line. A Category 5 Pacific hurricane is therefore a tropical cyclone in the north Pacific Ocean that reached Category 5 intensity east of the international dateline. Identical phenomena in the north Pacific Ocean west of the dateline are called "typhoons" or "super typhoons". Category 5 super typhoons generally happen several times per season, so cyclones of that intensity are not exceptional for that region. This difference in terminology therefore excludes storms such as Super Typhoon Paka and Super Typhoon Oliwa of 1997, and Super Typhoon Genevieve of 2014, which formed east of the dateline but did not reach Category 5 intensity until after crossing the dateline.
Statistics
| Saffir–Simpson scale | ||||||
| TD | TS | C1 | C2 | C3 | C4 | C5 |
A Category 5 hurricane is defined as having sustained windspeeds of at least 137 knots (157 mph; 252 km/h; 70 m/s) over a one-minute period 10 metres (32 ft 10 in) above the ground.[1][2] As a tropical cyclone is moving, its wind field is asymmetric. In the northern hemisphere, the strongest winds are on the right side of the storm (relative to the direction of motion). The highest winds given in advisories are those from the right side.[3]
Since the 1959 season, only 18 hurricanes are known to have reached Category 5 intensity. There are no known Category 5 storms occurring before 1959. It is possible that some earlier storms reached Category 5 over open waters, but they were never recognized because they never affected land and remained at sea.[4]
Category 5 Pacific hurricanes
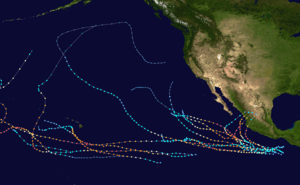
This lists all of the Category 5 hurricanes in the order in which they formed. Only 1994's Hurricane Emilia and 2006's Hurricane Ioke have reached Category 5 intensity more than once; that is, by weakening into a Category 4 or weaker storm and later re-strengthening to a Category 5 storm.
Before the advent of reliable geostationary satellite coverage in 1966, the number of eastern Pacific tropical cyclones was significantly underestimated.[5] It is therefore very possible that there are additional Category 5 hurricanes other than those listed, but they were not reported and therefore not recognized. However, the lack of Pacific Category 5 hurricanes during the late 1970s, 1980s, and early 1990s, is certain.[4]
The minimum central pressure of these storms is, for the most part, estimated from satellite imagery using the Dvorak technique. In the case of Kenna,[6] Ava,[7] Patricia, and Lane, the central pressure was measured by hurricane hunter aircraft flying into the storm.[4] Because of the estimation of central pressures, it is possible that other storms more intense than these have formed.[8]
The reason for estimating the pressure (in lieu of direct measurements) is the fact that most of these storms did not threaten land.[9] As Kenna, Patricia and Lane were threatening land, their pressures were measured by Hurricane Hunters using dropsondes.[6] While Hurricane Ava never threatened land,[4] it too was flown into by Hurricane Hunters to test equipment and conduct research.[7]
Older storms have incomplete pressure readings, since there were no satellite-based estimates; the only observations were taken by ships, land-based observations, or reconnaissance aircraft when available. Ava's minimum known pressure was measured when it was a Category 4 hurricane, for example.[4] John and Gilma have incomplete pressures because the Central Pacific Hurricane Center, in general, did not publish pressure on systems in the central Pacific (140°W to the dateline) at the time.[10] This list is not identical to the list of most intense Pacific hurricanes. The most intense known Category 4 storm in the eastern Pacific was 2014's Odile. The lowest pressure of this storm was 918 millibars, lower than that of some Category 5's, such as Guillermo.[4]
Hurricanes have reached Category 5 intensity during every month from June to October. The earliest Category 5 to form in a season is 1973's Hurricane Ava, which formed on June 7. The latest Category 5 to form in a season is Hurricane Kenna, which reached peak intensity on October 24. Hurricanes Ava, Gilma, Ioke, Linda, and Patricia are the most intense storms to form in their respective months. There have been no May, November, or off-season Category 5 hurricanes.[4]
Two Pacific hurricanes are known to have reached Category 5 intensity multiple times: Emilia and Ioke. Both did it twice, and Ioke reached Category 5 status a third time as a typhoon while in the western Pacific.[4] Hurricane Ioke was tied for the longest-lasting Category 5 hurricane recorded, spending 42 hours at that strength,[11] while hurricanes John and Linda had the longest time spent consecutively at that intensity.[4]

| Storm name |
Season | Dates as a Category 5 |
Time as a Category 5 (hours) |
Peak one-minute sustained winds |
Pressure | ||||
|---|---|---|---|---|---|---|---|---|---|
| mph | km/h | hPa | inHg | ||||||
| Patsy | 1959 | September 6 | 6 | 175 | 280 | 930 | 27.46 | ||
| Ava | 1973 | June 7 | 24 | 160 | 260 | 915 | 27.02 | ||
| Emilia | 1994 | July 19–21 | 18 | 160 | 260 | 926 | 27.34 | ||
| Gilma | 1994 | July 24–25 | 18 | 160 | 260 | 920 | 27.17 | ||
| John | 1994 | August 22–24 | 42 | 175 | 280 | 929 | 27.43 | ||
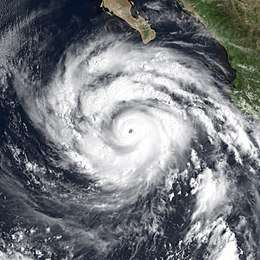
| Guillermo | 1997 | August 4–5 | 24 | 160 | 260 | 919 | 27.14 | ||
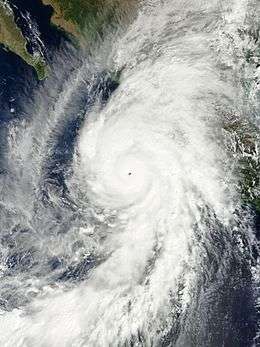
| Linda | 1997 | September 12–14 | 42 | 185 | 295 | 902 | 26.64 | ||
| Elida | 2002 | July 25 | 6 | 160 | 260 | 921 | 27.20 | ||
| Hernan | 2002 | September 1 | 12 | 160 | 260 | 921 | 27.20 | ||
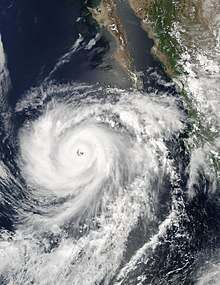
| Kenna | 2002 | October 24 | 18 | 165 | 270 | 913 | 26.96 | ||
| Ioke | 2006 | August 24–26 | 42 | 160 | 260 | 915 | 27.02 | ||
| Rick | 2009 | October 18 | 24 | 180 | 285 | 906 | 26.75 | ||
| Celia | 2010 | June 25 | 12 | 160 | 260 | 921 | 27.20 | ||
| Marie | 2014 | August 24 | 6 | 160 | 260 | 918 | 27.11 | ||
| Patricia | 2015 | October 22–23 | 23 | 215 | 345 | 872 | 25.75 | ||
| Lane | 2018 | August 22 | 12 | 160 | 260 | 926 | 27.34 | ||
| Walaka | 2018 | October 1–2 | 15 | 160 | 260 | 920 | 27.17 | ||
| Willa | 2018 | October 22 | 6 | 160 | 260 | 925 | 27.32 | ||
| |||||||||
Climatology

In the eastern Pacific, Category 5 hurricanes usually occur only in El Niño years. During El Niño years, conditions are more favorable for tropical cyclones because of warmer sea surface temperatures and reduced wind shear. This is why Category 5 hurricanes cluster in single seasons, with half of the known Category 5 hurricanes (nine) having occurred in the 1994, 2002, and 2018 seasons–the three seasons with the most Category 5 hurricanes, at three each. The effects of El Niño are most significant in the central Pacific (140°W to the dateline).[13]
The general lack of Category 5s in non warm-ENSO years is because of there being limited space for development. The prevailing ocean currents of the area carry warm water to the west. As there is no large piece of land to block the water and cause it to "pile up" like in the Atlantic, the area suitable for all tropical cyclones is small. Farther out to sea, while waters are still warm, wind shear limits the development of tropical cyclones in the waters south of Hawaii. This makes an otherwise ideal region unfavorable for tropical cyclones.
This does not mean that a Category 5 hurricane cannot form outside of an El Niño event. The entire year of 1959 was neither an El Niño or a La Niña, but it had one Category 5 hurricane (Patsy). Most of 1973 was during a La Niña, which reduces tropical cyclone activity in the eastern Pacific, yet Hurricane Ava, a Category 5 hurricane, formed in June of that year.[14] The 2009, 2010, 2014, and 2015 seasons are the only pairs of seasons in which a Category 5 hurricane formed in consecutive years (Rick and Celia, and Marie and Patricia, respectively).[15]
Landfalls
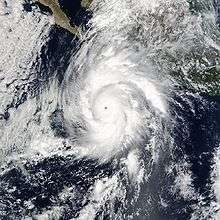
Of all of the Category 5 Pacific hurricanes, the only ones to make landfall at any intensity were Hurricane Kenna, Hurricane Rick, Hurricane Patricia, and Hurricane Willa. None made landfall as Category 5 hurricanes; Patricia and Kenna had weakened to Category 4 status at the time of their landfalls, Willa had weakened to Category 3, and Rick was a tropical storm at its landfall. Patricia was the strongest at landfall among Pacific hurricanes; 1976's Hurricane Madeline and 1992's Hurricane Iniki are tied as the second-strongest storms at landfall, both of which did not reach Category 5 strength, but made landfall as stronger Category 4 storms than Kenna.[6] Originally, a hurricane in 1959 was thought to have struck Manzanillo at Category 5 intensity, but a reanalysis in 2016 indicated the storm had peaked as a Category 4 hurricane, and made landfall with the same sustained wind speed as Kenna.[16] Patricia was also originally thought to have made landfall as a Category 5 hurricane near Manzanillo before post-season analysis in 2016.
In addition to these four systems, hurricanes John, Linda, Ioke, Lane, and Walaka all threatened land at some point during their existence. John, Ioke and Walaka had minimal impacts on Johnston Atoll, John caused heavy surf in Hawaii, and Walaka passed close to East Island in the French Frigate Shoals.[12] Linda was briefly forecast to approach southern California, and it passed close to Socorro Island near peak intensity.[11][17][18] Out of the five aforementioned hurricanes, Lane had the most significant impact on land, threatening Hawaii as a major hurricane, and dropping more than 40 inches (1,000 mm) of rain across many areas.[19]
The reason for the lack of landfalls is that tropical cyclones in the northern hemisphere usually travel to the west.[20] In the Atlantic, this sends hurricanes towards North America. In the eastern Pacific, this sends tropical cyclones out into the open ocean to dissipate over waters too cool to support them or in environments with high wind shear. Hawaii, the only heavily populated island chain in the eastern Pacific, is protected from most hurricanes by a subtropical ridge and because its land area is small relative to the total ocean area where hurricanes form and travel.
See also
- List of tropical cyclones
- List of the most intense tropical cyclones
- List of Pacific hurricane seasons
- List of Category 5 Atlantic hurricanes
- List of Eastern Pacific tropical storms
- List of Category 1 Pacific hurricanes
- List of Category 2 Pacific hurricanes
- List of Category 3 Pacific hurricanes
- List of Category 4 Pacific hurricanes
- List of F5 and EF5 tornadoes
References
- Schott, Timothy; Landsea, Christopher; Hafele, Gene; Lorens, Jeffrey; Taylor, Arthur; Thrum, Harvey; Ward, Bill; Willis, Mark; Zaleski, Walt (January 2, 2019). The Saffir-Simpson Hurricane Wind Scale (PDF) (Report). United States National Hurricane Center. Retrieved June 4, 2019.
- Chris Landsea. "Subject: D4) What does "maximum sustained wind" mean ? How does it relate to gusts in tropical cyclones?". FAQ: Hurricane, Typhoons, and Tropical Cyclones. Atlantic Oceanographic and Meteorological Laboratory Hurricane Research Division. Retrieved 2006-01-04.
- Chris Landsea. "Subject: D4) What does "maximum sustained wind" mean ? How does it relate to gusts in tropical cyclones?". FAQ: Hurricane, Typhoons, and Tropical Cyclones. Atlantic Oceanographic and Meteorological Laboratory Hurricane Research Division. Retrieved 2006-01-04.
- "Eastern North Pacific Tracks File 1949-2007". National Hurricane Center. 2008-03-21. Archived from the original (plaintext) on 2008-08-22. Retrieved 2008-09-14.
- Chris Landsea (2002-06-11). "Subject: E10) What are the average, most, and least tropical cyclones occurring in each basin?". FAQ: Hurricane, Typhoons, and Tropical Cyclones. Atlantic Oceanographic and Meteorological Laboratory Hurricane Research Division. Retrieved 2006-01-04.
- James Franklin (2002-12-26). "Tropical Cyclone Report Hurricane Kenna". National Hurricane Center. Archived from the original on 2014-07-16. Retrieved 2008-09-14.
- F.J. Hoelzl (1973-06-06). "wea01151, NOAA's National Weather Service (NWS) Collection". NOAA Photo Library. National Oceanic and Atmospheric Administration. Retrieved 2008-09-14.
- Max Mayfield (1997-10-02). "Preliminary Report Hurricane Guillermo". National Hurricane Center. Retrieved 2008-09-16.
- Neal Dorst. "Subject: H2) Who are the "Hurricane Hunters" and what are they looking for?". FAQ: Hurricane, Typhoons, and Tropical Cyclones. Atlantic Oceanographic and Meteorological Laboratory Hurricane Research Division. Retrieved 2006-01-04.
- Jim Gross (1989-08-30). "Preliminary Report Hurricane Dalilia" (GIF). National Hurricane Center. p. 3. Retrieved 2006-01-04.
- Andy Nash; Tim Craig; Sam Houston; Roy Matsuda; Jeff Powell; Ray Tanabe & Jim Weyman. "2006 Tropical Cyclones Central North Pacific". Central Pacific Hurricane Center. Retrieved 2008-09-14.
- "The 1994 Central Pacific Tropical Cyclone Season". Central Pacific Hurricane Center. Retrieved 2008-09-14.
- Chris Landsea. "Subject: G2) How does El Niño-Southern Oscillation affect tropical cyclone activity around the globe?". FAQ: Hurricane, Typhoons, and Tropical Cyclones. Atlantic Oceanographic and Meteorological Laboratory Hurricane Research Division. Retrieved 2006-01-04.
- "Cold and Warm Episodes by Season". Climate Prediction Center. Retrieved 2006-01-04.
- National Hurricane Center; Hurricane Research Division; Central Pacific Hurricane Center. "The Northeast and North Central Pacific hurricane database 1949–2019". United States National Oceanic and Atmospheric Administration's National Weather Service. A guide on how to read the database is available here.
- Re-analysis of the 1959 Manzanillo Mexico Hurricane (PDF) (Report). National Hurricane Center. 2016-02-04. Retrieved 2016-02-04.
- Max Mayfield (1997-10-25). "Preliminary Report Hurricane Linda". National Hurricane Center. Retrieved 2006-01-04.
- Chris D’Angelo (October 23, 2018). "Remote Hawaiian Island Wiped Off The Map". Huffington Post. Retrieved October 23, 2018.
- Newsweek. Hurricane Lane Hawaii rainfall totals update: ‘Extreme flooding impacts’ continue from tropical storm (Report). Newsweek. Retrieved August 25, 2018.
- Chris Landsea. "Subject: G8) Why do hurricanes hit the East coast of the U.S., but never the West coast?". FAQ: Hurricane, Typhoons, and Tropical Cyclones. Atlantic Oceanographic and Meteorological Laboratory Hurricane Research Division. Retrieved 2008-09-14.
| 1950s |
|
|---|---|
| 1970s |
|
| 1990s |
|
| 2000s |
|
| 2010s |
|
| |