Atmosphere of Earth
The atmosphere of Earth is the layer of gases, commonly known as air, that surrounds the planet Earth and is retained by Earth's gravity. The atmosphere of Earth protects life on Earth by creating pressure allowing for liquid water to exist on the Earth's surface, absorbing ultraviolet solar radiation, warming the surface through heat retention (greenhouse effect), and reducing temperature extremes between day and night (the diurnal temperature variation).
2 and methane from 2019, and do not represent any single source.[4]
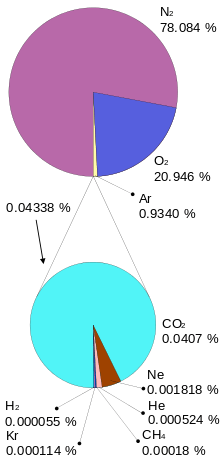
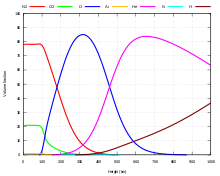
By volume, dry air contains 78.09% nitrogen, 20.95% oxygen, 0.93% argon, 0.04% carbon dioxide, and small amounts of other gases.[8] Air also contains a variable amount of water vapor, on average around 1% at sea level, and 0.4% over the entire atmosphere. Air composition, temperature, and atmospheric pressure vary with altitude, and air suitable for use in photosynthesis by terrestrial plants and breathing of terrestrial animals is found only in Earth's troposphere and in artificial atmospheres.
The atmosphere has a mass of about 5.15×10¹⁸ kg,[9] three quarters of which is within about 11 km (6.8 mi; 36,000 ft) of the surface. The atmosphere becomes thinner and thinner with increasing altitude, with no definite boundary between the atmosphere and outer space. The Kármán line, at 100 km (62 mi), or 1.57% of Earth's radius, is often used as the border between the atmosphere and outer space. Atmospheric effects become noticeable during atmospheric reentry of spacecraft at an altitude of around 120 km (75 mi). Several layers can be distinguished in the atmosphere, based on characteristics such as temperature and composition.
The study of Earth's atmosphere and its processes is called atmospheric science (aerology). Early pioneers in the field include Léon Teisserenc de Bort and Richard Assmann.[10]
Composition
The three major constituents of Earth's atmosphere are nitrogen, oxygen, and argon. Water vapor accounts for roughly 0.25% of the atmosphere by mass. The concentration of water vapor (a greenhouse gas) varies significantly from around 10 ppm by volume in the coldest portions of the atmosphere to as much as 5% by volume in hot, humid air masses, and concentrations of other atmospheric gases are typically quoted in terms of dry air (without water vapor).[11] The remaining gases are often referred to as trace gases,[12] among which are the greenhouse gases, principally carbon dioxide, methane, nitrous oxide, and ozone. Besides argon, already mentioned, other noble gases, neon, helium, krypton, and xenon are also present. Filtered air includes trace amounts of many other chemical compounds. Many substances of natural origin may be present in locally and seasonally variable small amounts as aerosols in an unfiltered air sample, including dust of mineral and organic composition, pollen and spores, sea spray, and volcanic ash. Various industrial pollutants also may be present as gases or aerosols, such as chlorine (elemental or in compounds), fluorine compounds and elemental mercury vapor. Sulfur compounds such as hydrogen sulfide and sulfur dioxide (SO2) may be derived from natural sources or from industrial air pollution.
| Gas | Volume(A) | ||
|---|---|---|---|
| Name | Formula | in ppmv(B) | in % |
| Nitrogen | N2 | 780,840 | 78.084 |
| Oxygen | O2 | 209,460 | 20.946 |
| Argon | Ar | 9,340 | 0.9340 |
| Carbon dioxide (April, 2019) | CO 2 |
413.32 | 0.041332 |
| Neon | Ne | 18.18 | 0.001818 |
| Helium | He | 5.24 | 0.000524 |
| Methane | CH4 | 1.87 | 0.000187 |
| Krypton | Kr | 1.14 | 0.000114 |
| Not included in above dry atmosphere: | |||
| Water vapor(C) | H2O | 0–30,000(D) | 0–3%(D) |
| notes: (A) volume fraction is equal to mole fraction for ideal gas only, | |||
The average molecular weight of dry air, which can be used to calculate densities or to convert between mole fraction and mass fraction, is about 28.946[13] or 28.96[14] g/mol. This is decreased when the air is humid.
The relative concentration of gases remains constant until about 10,000 m (33,000 ft).[15]
Stratification
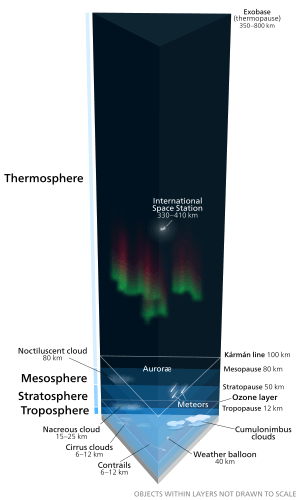
In general, air pressure and density decrease with altitude in the atmosphere. However, temperature has a more complicated profile with altitude, and may remain relatively constant or even increase with altitude in some regions (see the temperature section, below). Because the general pattern of the temperature/altitude profile, or lapse rate, is constant and measurable by means of instrumented balloon soundings, the temperature behavior provides a useful metric to distinguish atmospheric layers. In this way, Earth's atmosphere can be divided (called atmospheric stratification) into five main layers. Excluding the exosphere, the atmosphere has four primary layers, which are the troposphere, stratosphere, mesosphere, and thermosphere.[16] From highest to lowest, the five main layers are:
- Exosphere: 700 to 10,000 km (440 to 6,200 miles)
- Thermosphere: 80 to 700 km (50 to 440 miles)[17]
- Mesosphere: 50 to 80 km (31 to 50 miles)
- Stratosphere: 12 to 50 km (7 to 31 miles)
- Troposphere: 0 to 12 km (0 to 7 miles)[18]
Exosphere
The exosphere is the outermost layer of Earth's atmosphere (i.e. the upper limit of the atmosphere). It extends from the exobase, which is located at the top of the thermosphere at an altitude of about 700 km above sea level, to about 10,000 km (6,200 mi; 33,000,000 ft) where it merges into the solar wind.
This layer is mainly composed of extremely low densities of hydrogen, helium and several heavier molecules including nitrogen, oxygen and carbon dioxide closer to the exobase. The atoms and molecules are so far apart that they can travel hundreds of kilometers without colliding with one another. Thus, the exosphere no longer behaves like a gas, and the particles constantly escape into space. These free-moving particles follow ballistic trajectories and may migrate in and out of the magnetosphere or the solar wind.
The exosphere is located too far above Earth for any meteorological phenomena to be possible. However, the aurora borealis and aurora australis sometimes occur in the lower part of the exosphere, where they overlap into the thermosphere. The exosphere contains most of the satellites orbiting Earth.
Thermosphere
The thermosphere is the second-highest layer of Earth's atmosphere. It extends from the mesopause (which separates it from the mesosphere) at an altitude of about 80 km (50 mi; 260,000 ft) up to the thermopause at an altitude range of 500–1000 km (310–620 mi; 1,600,000–3,300,000 ft). The height of the thermopause varies considerably due to changes in solar activity.[17] Because the thermopause lies at the lower boundary of the exosphere, it is also referred to as the exobase. The lower part of the thermosphere, from 80 to 550 kilometres (50 to 342 mi) above Earth's surface, contains the ionosphere.
The temperature of the thermosphere gradually increases with height. Unlike the stratosphere beneath it, wherein a temperature inversion is due to the absorption of radiation by ozone, the inversion in the thermosphere occurs due to the extremely low density of its molecules. The temperature of this layer can rise as high as 1500 °C (2700 °F), though the gas molecules are so far apart that its temperature in the usual sense is not very meaningful. The air is so rarefied that an individual molecule (of oxygen, for example) travels an average of 1 kilometre (0.62 mi; 3300 ft) between collisions with other molecules.[19] Although the thermosphere has a high proportion of molecules with high energy, it would not feel hot to a human in direct contact, because its density is too low to conduct a significant amount of energy to or from the skin.
This layer is completely cloudless and free of water vapor. However, non-hydrometeorological phenomena such as the aurora borealis and aurora australis are occasionally seen in the thermosphere. The International Space Station orbits in this layer, between 350 and 420 km (220 and 260 mi).
Mesosphere
The mesosphere is the third highest layer of Earth's atmosphere, occupying the region above the stratosphere and below the thermosphere. It extends from the stratopause at an altitude of about 50 km (31 mi; 160,000 ft) to the mesopause at 80–85 km (50–53 mi; 260,000–280,000 ft) above sea level.
Temperatures drop with increasing altitude to the mesopause that marks the top of this middle layer of the atmosphere. It is the coldest place on Earth and has an average temperature around −85 °C (−120 °F; 190 K).[20][21]
Just below the mesopause, the air is so cold that even the very scarce water vapor at this altitude can be sublimated into polar-mesospheric noctilucent clouds. These are the highest clouds in the atmosphere and may be visible to the naked eye if sunlight reflects off them about an hour or two after sunset or a similar length of time before sunrise. They are most readily visible when the Sun is around 4 to 16 degrees below the horizon. Lightning-induced discharges known as transient luminous events (TLEs) occasionally form in the mesosphere above tropospheric thunderclouds. The mesosphere is also the layer where most meteors burn up upon atmospheric entrance. It is too high above Earth to be accessible to jet-powered aircraft and balloons, and too low to permit orbital spacecraft. The mesosphere is mainly accessed by sounding rockets and rocket-powered aircraft.
Stratosphere
The stratosphere is the second-lowest layer of Earth's atmosphere. It lies above the troposphere and is separated from it by the tropopause. This layer extends from the top of the troposphere at roughly 12 km (7.5 mi; 39,000 ft) above Earth's surface to the stratopause at an altitude of about 50 to 55 km (31 to 34 mi; 164,000 to 180,000 ft).
The atmospheric pressure at the top of the stratosphere is roughly 1/1000 the pressure at sea level. It contains the ozone layer, which is the part of Earth's atmosphere that contains relatively high concentrations of that gas. The stratosphere defines a layer in which temperatures rise with increasing altitude. This rise in temperature is caused by the absorption of ultraviolet radiation (UV) radiation from the Sun by the ozone layer, which restricts turbulence and mixing. Although the temperature may be −60 °C (−76 °F; 210 K) at the tropopause, the top of the stratosphere is much warmer, and may be near 0 °C.[22]
The stratospheric temperature profile creates very stable atmospheric conditions, so the stratosphere lacks the weather-producing air turbulence that is so prevalent in the troposphere. Consequently, the stratosphere is almost completely free of clouds and other forms of weather. However, polar stratospheric or nacreous clouds are occasionally seen in the lower part of this layer of the atmosphere where the air is coldest. The stratosphere is the highest layer that can be accessed by jet-powered aircraft.
Troposphere
The troposphere is the lowest layer of Earth's atmosphere. It extends from Earth's surface to an average height of about 12 km (7.5 mi; 39,000 ft), although this altitude varies from about 9 km (5.6 mi; 30,000 ft) at the geographic poles to 17 km (11 mi; 56,000 ft) at the Equator,[18] with some variation due to weather. The troposphere is bounded above by the tropopause, a boundary marked in most places by a temperature inversion (i.e. a layer of relatively warm air above a colder one), and in others by a zone which is isothermal with height.[23][24]
Although variations do occur, the temperature usually declines with increasing altitude in the troposphere because the troposphere is mostly heated through energy transfer from the surface. Thus, the lowest part of the troposphere (i.e. Earth's surface) is typically the warmest section of the troposphere. This promotes vertical mixing (hence, the origin of its name in the Greek word τρόπος, tropos, meaning "turn"). The troposphere contains roughly 80% of the mass of Earth's atmosphere.[25] The troposphere is denser than all its overlying atmospheric layers because a larger atmospheric weight sits on top of the troposphere and causes it to be most severely compressed. Fifty percent of the total mass of the atmosphere is located in the lower 5.6 km (3.5 mi; 18,000 ft) of the troposphere.
Nearly all atmospheric water vapor or moisture is found in the troposphere, so it is the layer where most of Earth's weather takes place. It has basically all the weather-associated cloud genus types generated by active wind circulation, although very tall cumulonimbus thunder clouds can penetrate the tropopause from below and rise into the lower part of the stratosphere. Most conventional aviation activity takes place in the troposphere, and it is the only layer that can be accessed by propeller-driven aircraft.
Other layers
Within the five principal layers above, that are largely determined by temperature, several secondary layers may be distinguished by other properties:
- The ozone layer is contained within the stratosphere. In this layer ozone concentrations are about 2 to 8 parts per million, which is much higher than in the lower atmosphere but still very small compared to the main components of the atmosphere. It is mainly located in the lower portion of the stratosphere from about 15–35 km (9.3–21.7 mi; 49,000–115,000 ft), though the thickness varies seasonally and geographically. About 90% of the ozone in Earth's atmosphere is contained in the stratosphere.
- The ionosphere is a region of the atmosphere that is ionized by solar radiation. It is responsible for auroras. During daytime hours, it stretches from 50 to 1,000 km (31 to 621 mi; 160,000 to 3,280,000 ft) and includes the mesosphere, thermosphere, and parts of the exosphere. However, ionization in the mesosphere largely ceases during the night, so auroras are normally seen only in the thermosphere and lower exosphere. The ionosphere forms the inner edge of the magnetosphere. It has practical importance because it influences, for example, radio propagation on Earth.
- The homosphere and heterosphere are defined by whether the atmospheric gases are well mixed. The surface-based homosphere includes the troposphere, stratosphere, mesosphere, and the lowest part of the thermosphere, where the chemical composition of the atmosphere does not depend on molecular weight because the gases are mixed by turbulence.[27] This relatively homogeneous layer ends at the turbopause found at about 100 km (62 mi; 330,000 ft), the very edge of space itself as accepted by the FAI, which places it about 20 km (12 mi; 66,000 ft) above the mesopause.
- Above this altitude lies the heterosphere, which includes the exosphere and most of the thermosphere. Here, the chemical composition varies with altitude. This is because the distance that particles can move without colliding with one another is large compared with the size of motions that cause mixing. This allows the gases to stratify by molecular weight, with the heavier ones, such as oxygen and nitrogen, present only near the bottom of the heterosphere. The upper part of the heterosphere is composed almost completely of hydrogen, the lightest element.
- The planetary boundary layer is the part of the troposphere that is closest to Earth's surface and is directly affected by it, mainly through turbulent diffusion. During the day the planetary boundary layer usually is well-mixed, whereas at night it becomes stably stratified with weak or intermittent mixing. The depth of the planetary boundary layer ranges from as little as about 100 metres (330 ft) on clear, calm nights to 3,000 m (9,800 ft) or more during the afternoon in dry regions.
The average temperature of the atmosphere at Earth's surface is 14 °C (57 °F; 287 K)[28] or 15 °C (59 °F; 288 K),[29] depending on the reference.[30][31][32]
Physical properties
Pressure and thickness
The average atmospheric pressure at sea level is defined by the International Standard Atmosphere as 101325 pascals (760.00 Torr; 14.6959 psi; 760.00 mmHg). This is sometimes referred to as a unit of standard atmospheres (atm). Total atmospheric mass is 5.1480×10¹⁸ kg (1.135×10¹⁹ lb),[34] about 2.5% less than would be inferred from the average sea level pressure and Earth's area of 51007.2 megahectares, this portion being displaced by Earth's mountainous terrain. Atmospheric pressure is the total weight of the air above unit area at the point where the pressure is measured. Thus air pressure varies with location and weather.
If the entire mass of the atmosphere had a uniform density equal to sea level density (about 1.2 kg per m3) from sea level upwards, it would terminate abruptly at an altitude of 8.50 km (27,900 ft). It actually decreases exponentially with altitude, dropping by half every 5.6 km (18,000 ft) or by a factor of 1/e every 7.64 km (25,100 ft), the average scale height of the atmosphere below 70 km (43 mi; 230,000 ft). However, the atmosphere is more accurately modeled with a customized equation for each layer that takes gradients of temperature, molecular composition, solar radiation and gravity into account.
In summary, the mass of Earth's atmosphere is distributed approximately as follows:[35]
- 50% is below 5.6 km (18,000 ft).
- 90% is below 16 km (52,000 ft).
- 99.99997% is below 100 km (62 mi; 330,000 ft), the Kármán line. By international convention, this marks the beginning of space where human travelers are considered astronauts.
By comparison, the summit of Mt. Everest is at 8,848 m (29,029 ft); commercial airliners typically cruise between 10 and 13 km (33,000 and 43,000 ft) where the thinner air improves fuel economy; weather balloons reach 30.4 km (100,000 ft) and above; and the highest X-15 flight in 1963 reached 108.0 km (354,300 ft).
Even above the Kármán line, significant atmospheric effects such as auroras still occur. Meteors begin to glow in this region, though the larger ones may not burn up until they penetrate more deeply. The various layers of Earth's ionosphere, important to HF radio propagation, begin below 100 km and extend beyond 500 km. By comparison, the International Space Station and Space Shuttle typically orbit at 350–400 km, within the F-layer of the ionosphere where they encounter enough atmospheric drag to require reboosts every few months. Depending on solar activity, satellites can experience noticeable atmospheric drag at altitudes as high as 700–800 km.
Temperature and speed of sound
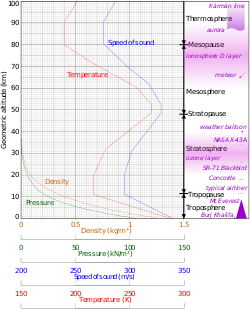
The division of the atmosphere into layers mostly by reference to temperature is discussed above. Temperature decreases with altitude starting at sea level, but variations in this trend begin above 11 km, where the temperature stabilizes through a large vertical distance through the rest of the troposphere. In the stratosphere, starting above about 20 km, the temperature increases with height, due to heating within the ozone layer caused by capture of significant ultraviolet radiation from the Sun by the dioxygen and ozone gas in this region. Still another region of increasing temperature with altitude occurs at very high altitudes, in the aptly-named thermosphere above 90 km.
Because in an ideal gas of constant composition the speed of sound depends only on temperature and not on the gas pressure or density, the speed of sound in the atmosphere with altitude takes on the form of the complicated temperature profile (see illustration to the right), and does not mirror altitudinal changes in density or pressure.
Density and mass
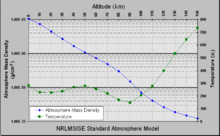
The density of air at sea level is about 1.2 kg/m3 (1.2 g/L, 0.0012 g/cm3). Density is not measured directly but is calculated from measurements of temperature, pressure and humidity using the equation of state for air (a form of the ideal gas law). Atmospheric density decreases as the altitude increases. This variation can be approximately modeled using the barometric formula. More sophisticated models are used to predict orbital decay of satellites.
The average mass of the atmosphere is about 5 quadrillion (5×10¹⁵) tonnes or 1/1,200,000 the mass of Earth. According to the American National Center for Atmospheric Research, "The total mean mass of the atmosphere is 5.1480×10¹⁸ kg with an annual range due to water vapor of 1.2 or 1.5×10¹⁵ kg, depending on whether surface pressure or water vapor data are used; somewhat smaller than the previous estimate. The mean mass of water vapor is estimated as 1.27×10¹⁶ kg and the dry air mass as 5.1352 ±0.0003×10¹⁸ kg."
Optical properties
Solar radiation (or sunlight) is the energy Earth receives from the Sun. Earth also emits radiation back into space, but at longer wavelengths that we cannot see. Part of the incoming and emitted radiation is absorbed or reflected by the atmosphere. In May 2017, glints of light, seen as twinkling from an orbiting satellite a million miles away, were found to be reflected light from ice crystals in the atmosphere.[37][38]
Scattering
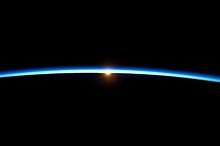
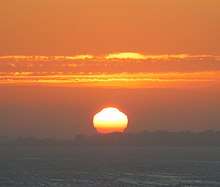
When light passes through Earth's atmosphere, photons interact with it through scattering. If the light does not interact with the atmosphere, it is called direct radiation and is what you see if you were to look directly at the Sun. Indirect radiation is light that has been scattered in the atmosphere. For example, on an overcast day when you cannot see your shadow there is no direct radiation reaching you, it has all been scattered. As another example, due to a phenomenon called Rayleigh scattering, shorter (blue) wavelengths scatter more easily than longer (red) wavelengths. This is why the sky looks blue; you are seeing scattered blue light. This is also why sunsets are red. Because the Sun is close to the horizon, the Sun's rays pass through more atmosphere than normal to reach your eye. Much of the blue light has been scattered out, leaving the red light in a sunset.
Absorption
Different molecules absorb different wavelengths of radiation. For example, O2 and O3 absorb almost all wavelengths shorter than 300 nanometers. Water (H2O) absorbs many wavelengths above 700 nm. When a molecule absorbs a photon, it increases the energy of the molecule. This heats the atmosphere, but the atmosphere also cools by emitting radiation, as discussed below.
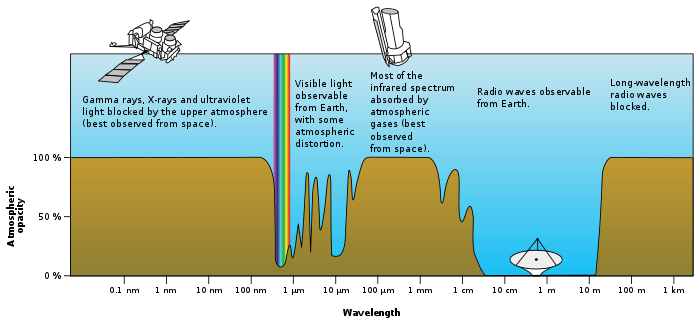
The combined absorption spectra of the gases in the atmosphere leave "windows" of low opacity, allowing the transmission of only certain bands of light. The optical window runs from around 300 nm (ultraviolet-C) up into the range humans can see, the visible spectrum (commonly called light), at roughly 400–700 nm and continues to the infrared to around 1100 nm. There are also infrared and radio windows that transmit some infrared and radio waves at longer wavelengths. For example, the radio window runs from about one centimeter to about eleven-meter waves.
Emission
Emission is the opposite of absorption, it is when an object emits radiation. Objects tend to emit amounts and wavelengths of radiation depending on their "black body" emission curves, therefore hotter objects tend to emit more radiation, with shorter wavelengths. Colder objects emit less radiation, with longer wavelengths. For example, the Sun is approximately 6,000 K (5,730 °C; 10,340 °F), its radiation peaks near 500 nm, and is visible to the human eye. Earth is approximately 290 K (17 °C; 62 °F), so its radiation peaks near 10,000 nm, and is much too long to be visible to humans.
Because of its temperature, the atmosphere emits infrared radiation. For example, on clear nights Earth's surface cools down faster than on cloudy nights. This is because clouds (H2O) are strong absorbers and emitters of infrared radiation. This is also why it becomes colder at night at higher elevations.
The greenhouse effect is directly related to this absorption and emission effect. Some gases in the atmosphere absorb and emit infrared radiation, but do not interact with sunlight in the visible spectrum. Common examples of these are CO
2 and H2O.
Refractive index
The refractive index of air is close to, but just greater than 1. Systematic variations in refractive index can lead to the bending of light rays over long optical paths. One example is that, under some circumstances, observers onboard ships can see other vessels just over the horizon because light is refracted in the same direction as the curvature of Earth's surface.
The refractive index of air depends on temperature,[39] giving rise to refraction effects when the temperature gradient is large. An example of such effects is the mirage.
Circulation
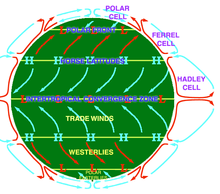
Atmospheric circulation is the large-scale movement of air through the troposphere, and the means (with ocean circulation) by which heat is distributed around Earth. The large-scale structure of the atmospheric circulation varies from year to year, but the basic structure remains fairly constant because it is determined by Earth's rotation rate and the difference in solar radiation between the equator and poles.
Evolution of Earth's atmosphere
Earliest atmosphere
The first atmosphere consisted of gases in the solar nebula, primarily hydrogen. There were probably simple hydrides such as those now found in the gas giants (Jupiter and Saturn), notably water vapor, methane and ammonia.[40]
Second atmosphere
Outgassing from volcanism, supplemented by gases produced during the late heavy bombardment of Earth by huge asteroids, produced the next atmosphere, consisting largely of nitrogen plus carbon dioxide and inert gases.[40] A major part of carbon-dioxide emissions dissolved in water and reacted with metals such as calcium and magnesium during weathering of crustal rocks to form carbonates that were deposited as sediments. Water-related sediments have been found that date from as early as 3.8 billion years ago.[41]
About 3.4 billion years ago, nitrogen formed the major part of the then stable "second atmosphere". The influence of life has to be taken into account rather soon in the history of the atmosphere, because hints of early life-forms appear as early as 3.5 billion years ago.[42] How Earth at that time maintained a climate warm enough for liquid water and life, if the early Sun put out 30% lower solar radiance than today, is a puzzle known as the "faint young Sun paradox".
The geological record however shows a continuous relatively warm surface during the complete early temperature record of Earth – with the exception of one cold glacial phase about 2.4 billion years ago. In the late Archean Eon an oxygen-containing atmosphere began to develop, apparently produced by photosynthesizing cyanobacteria (see Great Oxygenation Event), which have been found as stromatolite fossils from 2.7 billion years ago. The early basic carbon isotopy (isotope ratio proportions) strongly suggests conditions similar to the current, and that the fundamental features of the carbon cycle became established as early as 4 billion years ago.
Ancient sediments in the Gabon dating from between about 2.15 and 2.08 billion years ago provide a record of Earth's dynamic oxygenation evolution. These fluctuations in oxygenation were likely driven by the Lomagundi carbon isotope excursion.[43]
Third atmosphere
The constant re-arrangement of continents by plate tectonics influences the long-term evolution of the atmosphere by transferring carbon dioxide to and from large continental carbonate stores. Free oxygen did not exist in the atmosphere until about 2.4 billion years ago during the Great Oxygenation Event and its appearance is indicated by the end of the banded iron formations.
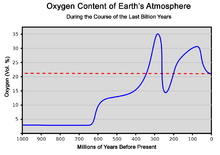
Before this time, any oxygen produced by photosynthesis was consumed by oxidation of reduced materials, notably iron. Molecules of free oxygen did not start to accumulate in the atmosphere until the rate of production of oxygen began to exceed the availability of reducing materials that removed oxygen. This point signifies a shift from a reducing atmosphere to an oxidizing atmosphere. O2 showed major variations until reaching a steady state of more than 15% by the end of the Precambrian.[46] The following time span from 541 million years ago to the present day is the Phanerozoic Eon, during the earliest period of which, the Cambrian, oxygen-requiring metazoan life forms began to appear.
The amount of oxygen in the atmosphere has fluctuated over the last 600 million years, reaching a peak of about 30% around 280 million years ago, significantly higher than today's 21%. Two main processes govern changes in the atmosphere: Plants using carbon dioxide from the atmosphere and releasing oxygen, and then plants using some oxygen at night by the process of photorespiration with the remainder of the oxygen being used to breakdown adjacent organic material. Breakdown of pyrite and volcanic eruptions release sulfur into the atmosphere, which oxidizes and hence reduces the amount of oxygen in the atmosphere. However, volcanic eruptions also release carbon dioxide, which plants can convert to oxygen. The exact cause of the variation of the amount of oxygen in the atmosphere is not known. Periods with much oxygen in the atmosphere are associated with rapid development of animals. Today's atmosphere contains 21% oxygen, which is great enough for this rapid development of animals.[47]
Air pollution
Air pollution is the introduction into the atmosphere of chemicals, particulate matter or biological materials that cause harm or discomfort to organisms.[48] Stratospheric ozone depletion is caused by air pollution, chiefly from chlorofluorocarbons and other ozone-depleting substances.
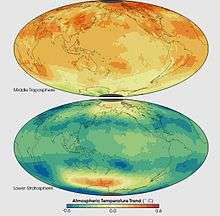
The scientific consensus is that the anthropogenic greenhouse gases currently accumulating in the atmosphere are the main cause of global warming.[49]
Images from space
On October 19, 2015, NASA started a website containing daily images of the full sunlit side of Earth on http://epic.gsfc.nasa.gov/. The images are taken from the Deep Space Climate Observatory (DSCOVR) and show Earth as it rotates during a day.[50]
- Blue light is scattered more than other wavelengths by the gases in the atmosphere, giving Earth a blue halo when seen from space.
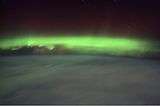 The geomagnetic storms cause displays of aurora across the atmosphere.
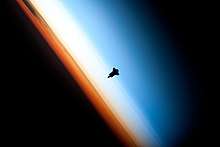
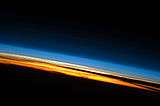 Limb view, of Earth's atmosphere. Colors roughly denote the layers of the atmosphere.
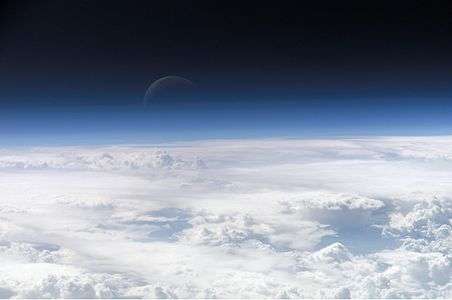
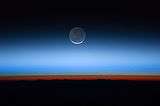 This image shows the Moon at the centre, with the limb of Earth near the bottom transitioning into the orange-colored troposphere. The troposphere ends abruptly at the tropopause, which appears in the image as the sharp boundary between the orange- and blue-colored atmosphere. The silvery-blue noctilucent clouds extend far above Earth's troposphere.
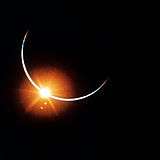 Earth's atmosphere backlit by the Sun in an eclipse observed from deep space onboard Apollo 12 in 1969.
See also
- Aerial perspective
- Air (classical element)
- Air glow
- Airshed
- Atmosphere (on atmospheres in general)
- Atmospheric dispersion modeling
- Atmospheric electricity
- Atmospheric Radiation Measurement Climate Research Facility (ARM) (in the U.S.)
- Atmospheric stratification
- Biosphere
- Climate system
- Earth's energy budget
- Compressed air
- COSPAR international reference atmosphere (CIRA)
- Environmental impact of aviation
- Global dimming
- Historical temperature record
- Hydrosphere
- Hypermobility (travel)
- Kyoto Protocol
- Leaching (agriculture)
- Lithosphere
- Reference atmospheric model
- Standard Dry Air
- U.S. Standard Atmosphere
- Warm period
References
- "Gateway to Astonaut Photos of Earth". NASA. Retrieved 2018-01-29.
- "Trends in Atmospheric Carbon Dioxide", Global Greenhouse Gas Reference Network, NOAA, 2019, retrieved 2019-05-31
- "Trends in Atmospheric Methane", Global Greenhouse Gas Reference Network, NOAA, 2019, retrieved 2019-05-31
- Haynes, H. M., ed. (2016–2017), CRC Handbook of Chemistry and Physics (97th ed.), CRC Press, p. 14-3, ISBN 978-1-4987-5428-6, which cites Allen's Astrophysical Quantities but includes only ten of its largest constituents.
- Cox, Arthur N., ed. (2000), Allen's Astrophysical Quantities (Fourth ed.), AIP Press, pp. 258–259, ISBN 0-387-98746-0, which rounds N2 and O2 to four significant digits without affecting the total because 0.004% was removed from N2 and added to O2. It includes 20 constituents.
- National Aeronautics and Space Administration (1976), U.S. Standard Atmosphere, 1976 (PDF), p. 3
- Allen, C. W. (1976), Astrophysical Quantities (Third ed.), Athlone Press, p. 119, ISBN 0-485-11150-0
- Two recent reliable sources cited here have total atmospheric compositions, including trace molecules, that exceed 100%. They are Allen's Astrophysical Quantities[5] (2000, 100.001241343%) and CRC Handbook of Chemistry and Physics[4] (2016–2017, 100.004667%), which cites Allen's Astrophysical Quantities. Both are used as references in this article. Both exceed 100% because their CO2 values were increased to 345 ppmv, without changing their other constituents to compensate. This is made worse by the April 2019 CO
2 value, which is 413.32 ppmv.[2] Although minor, the January 2019 value for CH
4 is 1866.1 ppbv (parts per billion).[3] Two older reliable sources have dry atmospheric compositions, including trace molecules, that total less than 100%: U.S. Standard Atmosphere, 1976[6] (99.9997147%); and Astrophysical Quantities[7] (1976, 99.9999357%). - Lide, David R. Handbook of Chemistry and Physics. Boca Raton, FL: CRC, 1996: 14–17
- M. Vázquez; A. Hanslmeier (2006). Ultraviolet Radiation in the Solar System. Astrophysics and Space Science Library. 331. Springer Science & Business Media. p. 17. Bibcode:2005ASSL..331.....V. doi:10.1007/978-1-4020-3730-6 (inactive 2020-02-08). ISBN 978-1-4020-3730-6.
- Wallace, John M. and Peter V. Hobbs. Atmospheric Science: An Introductory Survey. Elsevier. Second Edition, 2006. ISBN 978-0-12-732951-2. Chapter 1
- "Trace Gases". Ace.mmu.ac.uk. Archived from the original on 9 October 2010. Retrieved 2010-10-16.
- Detlev Möller: Luft: Chemie, Physik, Biologie, Reinhaltung, Recht. Walter de Gruyter, 2003, ISBN 3-11-016431-0, S. 173. (View in Google Books).
- Yunus Çengel. Termodinamica e trasmissione del calore.
- "Air Composition". The Engineering ToolBox. Retrieved 2017-07-04.
The composition of air is unchanged until elevation of approximately 10.000 m
- Zell, Holly (2015-03-02). "Earth's Upper Atmosphere". NASA. Retrieved 2017-02-20.
- Randy Russell (2008). "The Thermosphere". Retrieved 2013-10-18.
- "The height of the tropopause". Das.uwyo.edu. Retrieved 2012-04-18.
- Ahrens, C. Donald. Essentials of Meteorology. Published by Thomson Brooks/Cole, 2005.
- States, Robert J.; Gardner, Chester S. (January 2000). "Thermal Structure of the Mesopause Region (80–105 km) at 40°N Latitude. Part I: Seasonal Variations". Journal of the Atmospheric Sciences. 57 (1): 66–77. Bibcode:2000JAtS...57...66S. doi:10.1175/1520-0469(2000)057<0066:TSOTMR>2.0.CO;2.
- Joe Buchdahl. "Atmosphere, Climate & Environment Information Programme". Ace.mmu.ac.uk. Archived from the original on 2010-07-01. Retrieved 2012-04-18.
- Journal of the Atmospheric Sciences (1993). "stratopause". Retrieved 2013-10-18.
- Barry, R.G.; Chorley, R.J. (1971). Atmosphere, Weather and Climate. London: Menthuen & Co Ltd. p. 65.
- Tyson, P.D.; Preston-Whyte, R.A. (2013). The Weather and Climate of Southern Africa (2nd ed.). Oxford: Oxford University Press. p. 4.
- "Troposphere". Concise Encyclopedia of Science & Technology. McGraw-Hill. 1984.
It contains about four-fifths of the mass of the whole atmosphere.
- "ISS022-E-062672 caption". NASA. Retrieved 21 September 2012.
- "homosphere – AMS Glossary". Amsglossary.allenpress.com. Archived from the original on 14 September 2010. Retrieved 2010-10-16.
- "Earth's Atmosphere". Archived from the original on 2009-06-14.
- "NASA – Earth Fact Sheet". Nssdc.gsfc.nasa.gov. Archived from the original on 30 October 2010. Retrieved 2010-10-16.
- "Global Surface Temperature Anomalies". Archived from the original on 2009-03-03.
- "Earth's Radiation Balance and Oceanic Heat Fluxes". Archived from the original on 2005-03-03.
- "Coupled Model Intercomparison Project Control Run" (PDF). Archived from the original (PDF) on 2008-05-28.
- Geometric altitude vs. temperature, pressure, density, and the speed of sound derived from the 1962 U.S. Standard Atmosphere.
- Trenberth, Kevin E.; Smith, Lesley (1970-01-01). "The Mass of the Atmosphere: A Constraint on Global Analyses". Journal of Climate. 18 (6): 864. Bibcode:2005JCli...18..864T. doi:10.1175/JCLI-3299.1.
- Lutgens, Frederick K. and Edward J. Tarbuck (1995) The Atmosphere, Prentice Hall, 6th ed., pp. 14–17, ISBN 0-13-350612-6
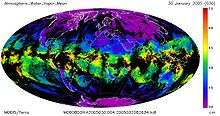
- "Atmospheric Temperature Trends, 1979–2005 : Image of the Day". Earthobservatory.nasa.gov. 2000-01-01. Retrieved 2014-06-10.
- St. Fleur, Nicholas (19 May 2017). "Spotting Mysterious Twinkles on Earth From a Million Miles Away". The New York Times. Retrieved 20 May 2017.
- Marshak, Alexander; Várnai, Tamás; Kostinski, Alexander (15 May 2017). "Terrestrial glint seen from deep space: oriented ice crystals detected from the Lagrangian point". Geophysical Research Letters. 44 (10): 5197. Bibcode:2017GeoRL..44.5197M. doi:10.1002/2017GL073248.
- Edlén, Bengt (1966). "The refractive index of air". Metrologia. 2 (2): 71–80. Bibcode:1966Metro...2...71E. doi:10.1088/0026-1394/2/2/002.
- Zahnle, K.; Schaefer, L.; Fegley, B. (2010). "Earth's Earliest Atmospheres". Cold Spring Harbor Perspectives in Biology. 2 (10): a004895. doi:10.1101/cshperspect.a004895. PMC 2944365. PMID 20573713.
- B. Windley: The Evolving Continents. Wiley Press, New York 1984
- J. Schopf: Earth's Earliest Biosphere: Its Origin and Evolution. Princeton University Press, Princeton, N.J., 1983
- Timothy W. Lyons, Christopher T. Reinhard & Noah J. Planavsky (2014). "Atmospheric oxygenation three billion years ago". Nature. 506 (7488): 307–15. Bibcode:2014Natur.506..307L. doi:10.1038/nature13068. PMID 24553238.
- Martin, Daniel; McKenna, Helen; Livina, Valerie (2016). "The human physiological impact of global deoxygenation". The Journal of Physiological Sciences. 67 (1): 97–106. doi:10.1007/s12576-016-0501-0. ISSN 1880-6546. PMC 5138252. PMID 27848144.
- http://www.nap.edu/openbook/0309100615/gifmid/30.gif
- Christopher R. Scotese, Back to Earth History : Summary Chart for the Precambrian, Paleomar Project
- Peter Ward: Out of Thin Air: Dinosaurs, Birds, and Earth's Ancient Atmosphere
- Starting from Pollution – Definition from the Merriam-Webster Online Dictionary
- "Summary for Policymakers" (PDF). Climate Change 2007: The Physical Science Basis. Contribution of Working Group I to the Fourth Assessment Report of the Intergovernmental Panel on Climate Change. Intergovernmental Panel on Climate Change. 5 February 2007.
- Northon, Karen (2015-10-19). "Daily Views of Earth Available on New NASA Website". NASA. Retrieved 2015-10-21.
External links
| Wikimedia Commons has media related to Earth's atmosphere. |
| Wikiquote has quotations related to: Air |
| Continents | 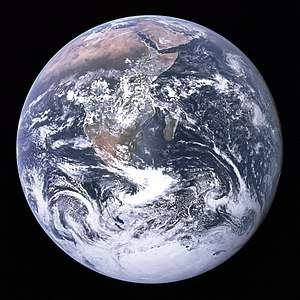 | |
|---|---|---|
| Oceans | ||
| Geology |
| |
| Atmosphere | ||
| Environment | ||
| Culture and society |
| |
| Planetary science |
| |
| ||
Atmospheres | ||
|---|---|---|
| Star |
| |
| Exoplanet |
| |
| Planet | ||
| Dwarf planet | ||
| Satellite | ||
| See also |
| |
Elements of nature | |||||
|---|---|---|---|---|---|
| Universe | |||||
| Earth |
| ||||
| Weather | |||||
| Natural environment | |||||
| Life |
| ||||
| |||||
| Air |
|  | ||||
|---|---|---|---|---|---|---|
| Energy |
| |||||
| Land |
| |||||
| Life | ||||||
| Water |
| |||||
| Related |
| |||||
| ||||||