Demography of the United Kingdom
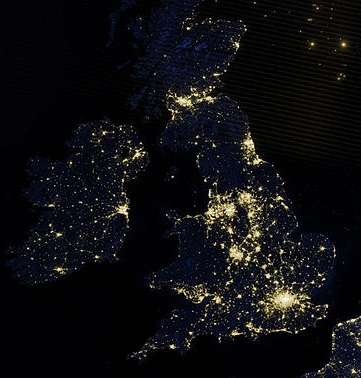
According to the 2011 UK Census, the total population of the United Kingdom was around 63,182,000.[1] It is the 21st-most populated country in the world. It's overall population density is 259 people per square kilometre (671 people per sq mi), with England having a significantly higher population density than Wales, Scotland and Northern Ireland.[2] Almost one-third of the population lives in England's southeast, which is predominantly urban and suburban, with about 9,000,000 in the capital city of London, the population density of which is just over 5,200 per square kilometre (13,468 per sq mi).[3]
The population of the United Kingdom is considered an example of a population that has undergone demographic transition – that is, the transition from a (typically) pre-industrial population with high birth and mortality rates and slow population growth, through a stage of falling mortality and faster rates of population growth, to a stage of low birth and mortality rates with, again, lower rates of population growth. This population growth through 'natural change' has been accompanied in the past two decades by growth through net international migration into the United Kingdom.[4]
The United Kingdom's high literacy rate (99% at age 15 and above)[5] is attributable to universal public education introduced for the primary level in 1870 (Scotland 1872, free 1890[6]) and secondary level in 1900. Parents are obliged to have their children educated from the ages of 5–16 years (18 in England as of 2013),[7] and can continue education free of charge in the form of A-Levels, vocational training or apprenticeship until the age of 18. The Church of England and the Church of Scotland function as the national churches in their respective countries (Wales has no established church following disestablishment in 1920), but all the major religions found in the world are represented in the United Kingdom.
The United Kingdom's population is predominantly White British. Being located close to continental Europe, the countries that formed the United Kingdom were subject to many invasions and migrations from the continent, especially from Scandinavia, including Roman occupation for several centuries. Historically, British people were therefore thought to be descended mainly from the different ethnic stocks that settled there before the 11th century: pre-Celtic, Celtic, Anglo-Saxon, Viking and Norman. However, recent genetic testing has revealed that these migrations contributed very little to the British genepool, with around 80% of white British DNA coming from an ancestral population who settled in the British Isles 12,000 years ago.[8][9][10]
Celtic languages are spoken in Scotland, Cornwall, and Northern Ireland, but the predominant language overall is English. In North and West Wales, Welsh is widely spoken as a first language, but less so in the South East of the country, where English is typically the first choice.
History
Roman Britain had an estimated population between 2.8 million and 3 million at the end of the second century CE. At the end of the fourth century, it had an estimated population of 3.6 million, of whom 125,000 consisted of the Roman army and their families and dependents.[11] The urban population of Roman Britain was about 240,000 people at the end of the fourth century.[11] Roman Britain's capital city, Londinium, is estimated to have had a population of about 60,000.[12][13] Londinium was an ethnically diverse city, with inhabitants from across the Roman Empire, including natives of Britannia, continental Europe, the Middle East, and North Africa.[14] There was also cultural diversity in other Roman-British towns, which were sustained by considerable migration, both within Britannia and from other Roman territories, including North Africa,[15] Roman Syria, the Eastern Mediterranean, and continental Europe.[16]
During the Industrial Revolution, child mortality decreased dramatically. The proportion of children born in London who died before the age of five decreased from 74.5 per thousand in 1730–1749 to 31.8 per thousand in 1810–1829.[17] According to Robert Hughes in The Fatal Shore, the population of England and Wales, which had remained steady at 6 million from 1700 to 1740, rose dramatically after 1740.
The first Census in 1801 revealed that the population of Great Britain was 10.5 million.[4][18] In 1800, the population of Ireland was between 4.5 and 5.5 million.[19][20]
The 1841 UK Census counted the population of England and Wales to be 15.9 million.[21] Ireland's population was 8.2 million in 1841.[21][22] The population of Scotland was 2.6 million.[21]
The Great Irish Famine, which began in the 1840s, caused the deaths of one million Irish people, and caused well over a million to emigrate.[23] Mass emigration became entrenched as a result of the famine, and the population continued to decline until the mid-20th century.
The population of England had almost doubled from 16.8 million in 1851 to 30.5 million in 1901. Ireland's population decreased rapidly, from 8.2 million in 1841 to less than 4.5 million in 1901.[24]
Population


| Part | Population (mid-2018)[25] |
Percentage of total
population (%) |
Area (km2)[26] |
Percentage of total area (%) |
Population
density | |
|---|---|---|---|---|---|---|
| England | 55,977,178 | 84.3 | 130,309 | 54 | 430/km² | |
| Scotland | 5,438,100 | 8.2 | 77,911 | 32 | 70/km² | |
| Wales | 3,138,631 | 4.7 | 20,736 | 9 | 151/km² | |
| Northern Ireland | 1,881,641 | 2.8 | 13,793 | 6 | 136/km² | |
| United Kingdom | 66,435,550 | 100 | 242,749 | 100 | 274/km² | |
(The population of Great Britain is therefore 64,553,909 (97.2% of UK) in an area of 228,956 km2 (94.3% of UK) and the population density is 282/km2.)
The United Kingdom (UK) Office for National Statistics' 2016-based National Population Projections indicated that, if recent trends continue, the UK's population would increase by 3.6 million between mid-2016 and mid-2026. This represents an average annual growth rate of 0.5%. Over the same period, the population of England is projected to grow by 5.9%; for Wales, this figure is 3.1%, while for Scotland and Northern Ireland the figures are 3.2% and 4.2% respectively. These projections do not allow for any possible effects of the UK leaving the European Union.[27]
There are 13 urban areas that exceed 500,000 inhabitants: they are centred on London, Birmingham, Glasgow, Leeds and Bradford, Southampton and Portsmouth, Sheffield, Liverpool, Leicester, Manchester, Belfast, Bristol, Newcastle upon Tyne and Nottingham.[28]
The population of the UK in the 2011 census was 63 million, of whom 31 million were male and 32 million female. The 2011 census recorded the population of England as 53.0 million, Scotland as 5.3 million, Wales as 3.1 million, and Northern Ireland as 1.8 million.[29]
Population change over time
The following table shows the total UK population estimated at census dates. Pre 1901 figures include the whole of Ireland, whereas from 1901 onwards only the population of Northern Ireland is included.
| Intercensal period |
Population at start of period |
Average annual numbers of | Population density at start of period (per km2) | ||||
|---|---|---|---|---|---|---|---|
| Overall change |
Births | Deaths | Net natural change |
Net migration* | |||
| 1851–1861 | 27,368,800 | 154,910 | Unknown | Unknown | Unknown | Unknown | 87 |
| 1861–1871 | 28,917,900 | 256,680 | Unknown | Unknown | Unknown | Unknown | 92 |
| 1871–1881 | 31,484,700 | 344,980 | Unknown | Unknown | Unknown | Unknown | 100 |
| 1881–1891 | 34,934,500 | 286,790 | Unknown | Unknown | Unknown | Unknown | 111 |
| 1891–1901 | 37,802,400 | 373,580 | Unknown | Unknown | Unknown | Unknown | 120 |
| 1901–1911 | 38,237,000 | 385,000 | 1,091,000 | 624,000 | 467,000 | −82,000 | 156 |
| 1911–1921 | 42,082,000 | 195,000 | 975,000 | 689,000 | 286,000 | −92,000 | 172 |
| 1921–1931 | 44,027,000 | 201,000 | 824,000 | 555,000 | 268,000 | −67,000 | 180 |
| 1931–1951 | 46,038,000 | 213,000 | 793,000 | 603,000 | 190,000 | 22,000 | 188 |
| 1951–1961 | 50,225,000 | 258,000 | 839,000 | 593,000 | 246,000 | 12,000 | 205 |
| 1961–1971 | 52,807,000 | 312,000 | 962,000 | 638,000 | 324,000 | −12,000 | 216 |
| 1971–1981 | 55,928,000 | 42,000 | 736,000 | 666,000 | 69,000 | −27,000 | 229 |
| 1981–1991 | 56,357,000 | 108,000 | 757,000 | 655,000 | 103,000 | 5,000 | 231 |
| 1991–2001 | 57,439,000 | 161,000 | 731,000 | 631,000 | 100,000 | 61,000 | 235 |
| 2001–2011 | 59,113,000 | 324,000 | 722,000 | 588,000 | 134,000 | 191,000 | 242 |
| 2011–2021 | 63,182,000 | N/A | N/A | N/A | N/A | N/A | 259 |
* and possibly other changes
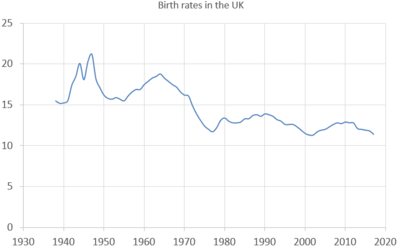
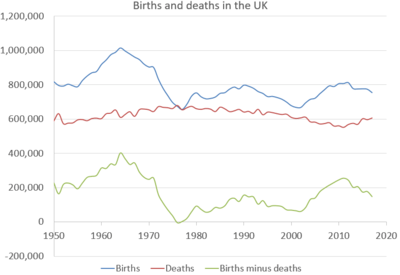
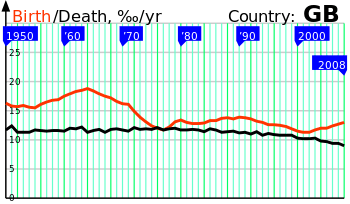
In 2015, there were 777,165 recorded live births in the UK. The crude birth rate was 11.9 per 1,000 population. The total fertility rate was 1.80. Also in 2015, 602,782 deaths were recorded, with the crude death rate being 9.3 per 1,000. The infant mortality rate was 3.9 per 1,000 live births.[34] Population density based on:
- Post-1901: calculated 243,820 km² area of the United Kingdom based on its current boundaries.
- Pre-1901: As above plus calculated 70,273 km² area of the Republic of Ireland.
Vital statistics
Total fertility rate (1552–1899)
The total fertility rate is the number of children born per woman. It is based on fairly good data for the entire period. Sources: Our World In Data and Gapminder Foundation.[35] Note: To see every year from 1552 see the reference link.
| Years | 1552 | 1556 | 1560 | 1565 | 1570 | 1575 | 1580 | 1590 | 1595 | 1600 | 1605 | 1610 | 1615 | 1620 | 1625 | 1630 | 1640 | 1650[35] |
|---|---|---|---|---|---|---|---|---|---|---|---|---|---|---|---|---|---|---|
| Total Fertility Rate | 5.12 | 4.78 | 4.7 | 5.31 | 4.64 | 4.48 | 4.62 | 4.25 | 4.47 | 4.63 | 4.79 | 4.47 | 4.51 | 4.78 | 4.35 | 4.45 | 4.71 | 3.49 |
| Years | 1660 | 1665 | 1670 | 1675 | 1680 | 1690 | 1695 | 1700 | 1705 | 1710 | 1715 | 1720 | 1725 | 1730 | 1735 | 1740 | 1750 | 1755[35] |
|---|---|---|---|---|---|---|---|---|---|---|---|---|---|---|---|---|---|---|
| Total Fertility Rate | 3.83 | 4.1 | 3.97 | 3.75 | 3.97 | 4.29 | 4.37 | 4.39 | 4.37 | 3.79 | 4.25 | 4.16 | 4.51 | 4.28 | 4.94 | 4.58 | 4.73 | 4.64 |
| Years | 1760 | 1765 | 1770 | 1775 | 1780 | 1785 | 1790 | 1795 | 1797 | 1799 | 1800[35] |
|---|---|---|---|---|---|---|---|---|---|---|---|
| Total Fertility Rate | 4.56 | 4.81 | 4.98 | 4.96 | 4.9 | 5.09 | 5.35 | 5.21 | 5.4 | 5.11 | 4.97 |
| Years | 1801 | 1802 | 1803 | 1804 | 1805 | 1806 | 1807 | 1808 | 1809 | 1810[35] |
|---|---|---|---|---|---|---|---|---|---|---|
| Total Fertility Rate | 4.6 | 5.3 | 5.61 | 5.65 | 5.55 | 5.49 | 5.45 | 5.4 | 5.24 | 5.36 |
| Years | 1811 | 1812 | 1813 | 1814 | 1815 | 1816 | 1817 | 1818 | 1819 | 1820[35] |
|---|---|---|---|---|---|---|---|---|---|---|
| Total Fertility Rate | 5.43 | 5.31 | 5.45 | 5.46 | 6.02 | 5.73 | 5.69 | 5.54 | 5.45 | 5.4 |
| Years | 1821 | 1822 | 1823 | 1824 | 1825 | 1826 | 1827 | 1828 | 1829 | 1830[35] |
|---|---|---|---|---|---|---|---|---|---|---|
| Total Fertility Rate | 5.55 | 5.69 | 5.54 | 5.42 | 5.38 | 5.36 | 5.07 | 5.23 | 4.85 | 4.83 |
| Years | 1831 | 1832 | 1833 | 1834 | 1835 | 1836 | 1837 | 1838 | 1839 | 1840[35] |
|---|---|---|---|---|---|---|---|---|---|---|
| Total Fertility Rate | 4.78 | 4.78 | 5 | 4.89 | 4.83 | 4.86 | 4.79 | 4.78 | 4.93 | 4.9 |
| Years | 1841 | 1842 | 1843 | 1844 | 1845 | 1846 | 1847 | 1848 | 1849 | 1850[35] |
|---|---|---|---|---|---|---|---|---|---|---|
| Total Fertility Rate | 4.89 | 4.83 | 4.82 | 4.83 | 4.75 | 4.9 | 4.58 | 4.71 | 4.78 | 4.85 |
| Years | 1851 | 1852 | 1853 | 1854 | 1855 | 1856 | 1857 | 1858 | 1859 | 1860[35] |
|---|---|---|---|---|---|---|---|---|---|---|
| Total Fertility Rate | 4.94 | 4.94 | 4.78 | 4.89 | 4.85 | 4.94 | 4.9 | 4.79 | 4.97 | 4.86 |
| Years | 1861 | 1862 | 1863 | 1864 | 1865 | 1866 | 1867 | 1868 | 1869 | 1870[35] |
|---|---|---|---|---|---|---|---|---|---|---|
| Total Fertility Rate | 4.88 | 4.92 | 4.94 | 4.96 | 4.94 | 4.92 | 4.94 | 4.97 | 4.82 | 4.88 |
| Years | 1871 | 1872 | 1873 | 1874 | 1875 | 1876 | 1877 | 1878 | 1879 | 1880[35] |
|---|---|---|---|---|---|---|---|---|---|---|
| Total Fertility Rate | 4.85 | 4.89 | 4.94 | 4.93 | 4.92 | 4.9 | 4.89 | 4.88 | 4.81 | 4.75 |
| Years | 1881 | 1882 | 1883 | 1884 | 1885 | 1886 | 1887 | 1888 | 1889 | 1890[35] |
|---|---|---|---|---|---|---|---|---|---|---|
| Total Fertility Rate | 4.68 | 4.62 | 4.55 | 4.47 | 4.39 | 4.32 | 4.24 | 4.16 | 4.11 | 4.06 |
| Years | 1891 | 1892 | 1893 | 1894 | 1895 | 1896 | 1897 | 1898 | 1899[35] |
|---|---|---|---|---|---|---|---|---|---|
| Total Fertility Rate | 4 | 3.95 | 3.9 | 3.84 | 3.79 | 3.73 | 3.68 | 3.62 | 3.58 |
Vital statistics (1900–2018)
| Average population[36] | Live births [37] | Deaths | Natural change | Crude birth rate (per 1000) | Crude death rate (per 1000) | Natural change (per 1000) | Total fertility rate[fn 1][35][38] | |
|---|---|---|---|---|---|---|---|---|
| 1900 | 1,089,487 | 695,867 | 393,620 | 3.53 | ||||
| 1901 | 1,092,781 | 655,646 | 437,135 | 3.49 | ||||
| 1902 | 1,103,483 | 636,650 | 466,833 | 3.44 | ||||
| 1903 | 1,113,086 | 613,726 | 499,360 | 3.40 | ||||
| 1904 | 1,109,542 | 651,301 | 458,241 | 3.35 | ||||
| 1905 | 1,092,108 | 617,516 | 474,592 | 3.30 | ||||
| 1906 | 1,098,475 | 629,955 | 468,520 | 3.24 | ||||
| 1907 | 1,077,851 | 625,271 | 452,580 | 3.19 | ||||
| 1908 | 1,102,345 | 621,427 | 480,918 | 3.14 | ||||
| 1909 | 1,073,781 | 614,910 | 458,871 | 3.07 | ||||
| 1910 | 1,051,240 | 578,091 | 473,149 | 2.99 | ||||
| 1911 | 1,033,395 | 620,828 | 412,567 | 2.92 | ||||
| 1912 | 1,025,828 | 580,977 | 444,851 | 2.90 | ||||
| 1913 | 1,032,286 | 600,554 | 431,732 | 2.93 | ||||
| 1914 | 1,032,734 | 611,970 | 420,764 | 2.88 | ||||
| 1915 | 956,877 | 666,322 | 290,555 | 2.59 | ||||
| 1916 | 922,085 | 599,621 | 322,464 | 2.60 | ||||
| 1917 | 790,736 | 589,416 | 201,320 | 2.10 | ||||
| 1918 | 787,427 | 715,246 | 72,181 | 2.03 | ||||
| 1919 | 826,202 | 602,188 | 224,014 | 2.31 | ||||
| 1920 | 1,126,849 | 555,326 | 571,523 | 3.08 | ||||
| 1921 | 1,001,725 | 544,140 | 457,585 | 2.69 | ||||
| 1922 | 924,740 | 579,480 | 345,260 | 2.44 | ||||
| 1923 | 900,130 | 526,858 | 373,272 | 2.38 | ||||
| 1924 | 865,329 | 563,891 | 301,438 | 2.28 | ||||
| 1925 | 842,405 | 558,132 | 284,273 | 2.20 | ||||
| 1926 | 825,174 | 536,411 | 288,763 | 2.15 | ||||
| 1927 | 777,520 | 568,655 | 208,865 | 2.01 | ||||
| 1928 | 783,052 | 543,664 | 239,388 | 2.01 | ||||
| 1929 | 761,963 | 623,231 | 138,732 | 1.95 | ||||
| 1930 | 769,239 | 536,860 | 232,379 | 1.95 | ||||
| 1931 | 749,974 | 573,908 | 176,066 | 1.89 | ||||
| 1932 | 730,079 | 567,986 | 162,093 | 1.83 | ||||
| 1933 | 691,560 | 579,467 | 112,093 | 1.72 | ||||
| 1934 | 711,483 | 558,072 | 153,411 | 1.76 | ||||
| 1935 | 711,426 | 561,324 | 150,102 | 1.75 | ||||
| 1936 | 720,129 | 580,942 | 139,187 | 1.77 | ||||
| 1937 | 723,779 | 597,798 | 125,981 | 1.79 | ||||
| 1938 | 735,573 | 559,598 | 175,975 | 15.5 | 1.84 | |||
| 1939 | 726,632 | 581,857 | 144,775 | 15.2 | 1.84 | |||
| 1940 | 701,875 | 673,253 | 28,622 | 15.2 | 1.74 | |||
| 1941 | 695,726 | 627,378 | 68,348 | 15.5 | 1.72 | |||
| 1942 | 771,851 | 562,356 | 209,495 | 17.4 | 1.93 | |||
| 1943 | 810,524 | 585,582 | 224,942 | 18.5 | 2.03 | |||
| 1944 | 878,298 | 573,570 | 303,728 | 20.1 | 2.25 | |||
| 1945 | 795,868 | 567,027 | 228,841 | 18.1 | 2.05 | |||
| 1946 | 955,266 | 573,361 | 381,905 | 20.3 | 2.47 | |||
| 1947 | 1,025,427 | 600,728 | 424,699 | 21.2 | 2.69 | |||
| 1948 | 905,182 | 546,002 | 359,180 | 18.2 | 2.39 | |||
| 1949 | 855,298 | 589,876 | 265,422 | 17.1 | 2.26 | |||
| 1950 | 50,150,000 | 818,421 | 590,136 | 228,285 | 16.3 | 11.8 | 4.6 | 2.08 |
| 1951 | 50,286,900 | 796,645 | 632,786 | 163,859 | 15.8 | 12.6 | 3.3 | 2.10 |
| 1952 | 50,429,200 | 792,917 | 573,806 | 219,111 | 15.7 | 11.4 | 4.3 | 2.15 |
| 1953 | 50,592,900 | 804,269 | 577,220 | 227,049 | 15.9 | 11.4 | 4.5 | 2.20 |
| 1954 | 50,764,900 | 794,769 | 578,400 | 216,369 | 15.7 | 11.4 | 4.3 | 2.26 |
| 1955 | 50,946,100 | 789,315 | 595,916 | 193,399 | 15.5 | 11.7 | 3.8 | 2.33 |
| 1956 | 51,183,500 | 825,137 | 597,981 | 227,156 | 16.1 | 11.7 | 4.4 | 2.40 |
| 1957 | 51,430,200 | 851,466 | 591,200 | 260,266 | 16.6 | 11.5 | 5.1 | 2.48 |
| 1958 | 51,652,500 | 870,497 | 604,040 | 266,457 | 16.9 | 11.7 | 5.2 | 2.55 |
| 1959 | 51,956,300 | 878,561 | 606,115 | 272,446 | 16.9 | 11.7 | 5.2 | 2.63 |
| 1960 | 52,372,500 | 918,286 | 603,328 | 314,958 | 17.5 | 11.5 | 6.0 | 2.71 |
| 1961 | 52,807,400 | 944,365 | 631,788 | 312,577 | 17.9 | 12.0 | 5.9 | 2.78 |
| 1962 | 53,291,800 | 975,635 | 636,051 | 339,584 | 18.3 | 11.9 | 6.4 | 2.87 |
| 1963 | 53,624,900 | 990,160 | 654,288 | 335,872 | 18.5 | 12.2 | 6.3 | 2.90 |
| 1964 | 53,990,800 | 1,014,672 | 611,130 | 403,542 | 18.8 | 11.3 | 7.5 | 2.95 |
| 1965 | 54,349,500 | 997,275 | 627,798 | 369,477 | 18.3 | 11.6 | 6.8 | 2.88 |
| 1966 | 54,642,700 | 979,587 | 643,754 | 335,833 | 17.9 | 11.8 | 6.1 | 2.80 |
| 1967 | 54,959,000 | 961,800 | 616,710 | 345,090 | 17.5 | 11.2 | 6.3 | 2.69 |
| 1968 | 55,213,500 | 947,231 | 655,998 | 291,233 | 17.2 | 11.9 | 5.3 | 2.61 |
| 1969 | 55,460,600 | 920,256 | 659,537 | 260,719 | 16.6 | 11.9 | 4.7 | 2.51 |
| 1970 | 55,632,200 | 903,907 | 655,385 | 248,522 | 16.2 | 11.8 | 4.5 | 2.44 |
| 1971 | 55,928,000 | 901,648 | 645,078 | 256,570 | 16.1 | 11.5 | 4.6 | 2.40 |
| 1972 | 56,096,000 | 833,984 | 673,938 | 160,046 | 14.9 | 12.0 | 2.9 | 2.20 |
| 1973 | 56,223,000 | 779,545 | 669,692 | 109,853 | 13.9 | 11.9 | 2.0 | 2.03 |
| 1974 | 56,235,000 | 737,138 | 667,359 | 69,779 | 13.1 | 11.9 | 1.2 | 1.92 |
| 1975 | 56,225,000 | 697,518 | 662,477 | 35,041 | 12.4 | 11.8 | 0.6 | 1.81 |
| 1976 | 56,216,000 | 675,526 | 680,799 | -5,273 | 12.0 | 12.1 | -0.1 | 1.74 |
| 1977 | 56,189,000 | 657,038 | 655,143 | 1,895 | 11.7 | 11.7 | 0.0 | 1.69 |
| 1978 | 56,178,000 | 686,952 | 667,177 | 19,775 | 12.2 | 11.9 | 0.4 | 1.75 |
| 1979 | 56,240,000 | 734,572 | 675,576 | 58,996 | 13.1 | 12.0 | 1.0 | 1.86 |
| 1980 | 56,329,000 | 753,708 | 661,519 | 92,189 | 13.4 | 11.7 | 1.6 | 1.90 |
| 1981 | 56,357,000 | 730,712 | 657,974 | 72,738 | 13.0 | 11.7 | 1.3 | 1.82 |
| 1982 | 56,290,000 | 718,999 | 662,081 | 56,918 | 12.8 | 11.8 | 1.0 | 1.78 |
| 1983 | 56,315,000 | 721,238 | 659,101 | 62,137 | 12.8 | 11.7 | 1.1 | 1.77 |
| 1984 | 56,409,000 | 729,401 | 644,918 | 84,483 | 12.9 | 11.4 | 1.5 | 1.77 |
| 1985 | 56,554,000 | 750,520 | 670,656 | 79,864 | 13.3 | 11.9 | 1.4 | 1.79 |
| 1986 | 56,683,000 | 754,805 | 660,735 | 94,070 | 13.3 | 11.7 | 1.7 | 1.78 |
| 1987 | 56,804,000 | 775,405 | 644,342 | 131,063 | 13.7 | 11.3 | 2.3 | 1.81 |
| 1988 | 56,916,000 | 787,303 | 649,178 | 138,125 | 13.8 | 11.4 | 2.4 | 1.82 |
| 1989 | 57,076,000 | 777,036 | 657,733 | 119,303 | 13.6 | 11.5 | 2.1 | 1.79 |
| 1990 | 57,237,000 | 798,364 | 641,799 | 156,565 | 13.9 | 11.2 | 2.7 | 1.83 |
| 1991 | 57,438,000 | 792,269 | 646,181 | 146,088 | 13.8 | 11.3 | 2.5 | 1.82 |
| 1992 | 57,584,000 | 780,779 | 634,238 | 146,541 | 13.6 | 11.0 | 2.5 | 1.79 |
| 1993 | 57,713,000 | 761,526 | 658,194 | 103,332 | 13.2 | 11.4 | 1.8 | 1.76 |
| 1994 | 57,862,000 | 750,480 | 626,222 | 124,258 | 13.0 | 10.8 | 2.1 | 1.74 |
| 1995 | 58,024,000 | 731,882 | 641,712 | 90,170 | 12.6 | 11.1 | 1.6 | 1.71 |
| 1996 | 58,164,000 | 733,163 | 638,879 | 94,284 | 12.6 | 11.0 | 1.6 | 1.73 |
| 1997 | 58,314,000 | 726,622 | 632,517 | 94,105 | 12.5 | 10.8 | 1.6 | 1.72 |
| 1998 | 58,474,000 | 716,888 | 627,592 | 89,296 | 12.3 | 10.7 | 1.5 | 1.71 |
| 1999 | 58,684,000 | 699,976 | 629,476 | 70,500 | 11.9 | 10.7 | 1.2 | 1.68 |
| 2000 | 58,886,000 | 679,029 | 610,579 | 68,450 | 11.5 | 10.4 | 1.2 | 1.64 |
| 2001 | 59,113,000 | 669,123 | 604,393 | 64,730 | 11.3 | 10.2 | 1.1 | 1.63 |
| 2002 | 59,365,000 | 668,777 | 608,045 | 60,732 | 11.3 | 10.2 | 1.0 | 1.63 |
| 2003 | 59,636,000 | 695,549 | 612,085 | 83,464 | 11.7 | 10.3 | 1.4 | 1.70 |
| 2004 | 59,950,000 | 715,996 | 584,791 | 131,205 | 11.9 | 9.8 | 2.2 | 1.77 |
| 2005 | 60,413,000 | 722,549 | 582,964 | 139,585 | 12.0 | 9.6 | 2.3 | 1.76 |
| 2006 | 60,827,000 | 748,563 | 572,224 | 176,339 | 12.3 | 9.4 | 2.9 | 1.82 |
| 2007 | 61,319,000 | 772,245 | 574,687 | 197,558 | 12.6 | 9.4 | 3.2 | 1.87 |
| 2008 | 61,823,000 | 794,383 | 579,697 | 214,686 | 12.8 | 9.4 | 3.5 | 1.96 |
| 2009 | 62,260,000 | 790,204 | 559,617 | 230,587 | 12.7 | 9.0 | 3.7 | 1.89 |
| 2010 | 62,759,000 | 807,721 | 561,666 | 246,055 | 12.9 | 8.9 | 3.9 | 1.92 |
| 2011 | 63,285,000 | 807,776 | 552,232 | 255,544 | 12.8 | 8.7 | 4.0 | 1.91 |
| 2012 | 63,705,000 | 812,970 | 569,024 | 243,946 | 12.8 | 8.9 | 3.8 | 1.92 |
| 2013 | 64,105,000 | 778,803 | 575,458 | 203,345 | 12.1 | 9.0 | 3.2 | 1.83 |
| 2014 | 64,596,000 | 776,352 | 570,341 | 206,011 | 12.0 | 8.8 | 3.2 | 1.82 |
| 2015 | 65,110,000 | 777,165 | 602,782 | 174,383 | 11.9 | 9.3 | 2.7 | 1.80 |
| 2016 | 65,648,000 | 774,835 | 595,659 | 179,176 | 11.8 | 9.1 | 2.7 | 1.79 |
| 2017 | 66,040,200 | 755,066 | 607,172 | 147,894 | 11.4 | 9.2 | 2.2 | 1.74 |
| 2018 | 66,436,000 | 731,213 | 616,014 | 115,199 | 11.0 | 9.3 | 1.7 | 1.68 |
| 2019 | 603,347 | |||||||
Life expectancy (1543–1950)
Sources: Our World In Data and the United Nations.
1543-1950
| Years | 1543 | 1548 | 1553 | 1558 | 1563 | 1568 | 1573 | 1578 | 1583 | 1588 | 1593 | 1603 | 1608 | 1613 | 1618 | 1623 | 1628 | 1633[39] |
|---|---|---|---|---|---|---|---|---|---|---|---|---|---|---|---|---|---|---|
| Life expectancy | 33.9 | 38.8 | 39.6 | 22.4 | 36.7 | 39.7 | 41.1 | 41.6 | 42.7 | 37.1 | 38.1 | 38.5 | 39.6 | 36.8 | 40.3 | 33.4 | 39.7 | 39.7 |
| Years | 1638 | 1643 | 1648 | 1653 | 1658 | 1663 | 1668 | 1673 | 1678 | 1683 | 1688 | 1693 | 1698 | 1703 | 1713 | 1718 | 1723 | 1728[39] |
|---|---|---|---|---|---|---|---|---|---|---|---|---|---|---|---|---|---|---|
| Life expectancy | 34.0 | 36.3 | 39.7 | 39.1 | 33.0 | 33.3 | 33.5 | 37.4 | 32.4 | 31.3 | 35.9 | 36.5 | 38.1 | 38.5 | 36.9 | 35.8 | 35.5 | 25.3 |
| Years | 1733 | 1738 | 1743 | 1748 | 1753 | 1758 | 1763 | 1768 | 1773 | 1778 | 1783 | 1788 | 1793 | 1798 | 1803 | 1808 | 1813 | 1818[39] |
|---|---|---|---|---|---|---|---|---|---|---|---|---|---|---|---|---|---|---|
| Life expectancy | 36.3 | 35.3 | 34.3 | 36.5 | 39.8 | 38.1 | 35.4 | 36.2 | 39.1 | 37.7 | 35.8 | 39.0 | 37.9 | 38.9 | 40.0 | 40.6 | 41.3 | 40.8 |
| Years | 1823 | 1828 | 1833 | 1838 | 1842 | 1843 | 1844 | 1845 | 1846 | 1847 | 1848 | 1849 | 1850[39] |
|---|---|---|---|---|---|---|---|---|---|---|---|---|---|
| Life expectancy | 40.5 | 41.4 | 40.9 | 40.6 | 41.0 | 41.6 | 41.2 | 42.2 | 40.2 | 38.5 | 39.9 | 37.7 | 42.8 |
| Years | 1851 | 1852 | 1853 | 1854 | 1855 | 1856 | 1857 | 1858 | 1859 | 1860[39] |
|---|---|---|---|---|---|---|---|---|---|---|
| Life expectancy | 41.0 | 40.4 | 40.0 | 39.5 | 40.7 | 42.5 | 40.9 | 39.5 | 40.4 | 41.9 |
| Years | 1861 | 1862 | 1863 | 1864 | 1865 | 1866 | 1867 | 1868 | 1869 | 1870[39] |
|---|---|---|---|---|---|---|---|---|---|---|
| Life expectancy | 41.6 | 42.1 | 40.4 | 39.6 | 39.8 | 40.1 | 42.0 | 41.7 | 41.3 | 40.6 |
| Years | 1871 | 1872 | 1873 | 1874 | 1875 | 1876 | 1877 | 1878 | 1879 | 1880[39] |
|---|---|---|---|---|---|---|---|---|---|---|
| Life expectancy | 41.1 | 42.7 | 43.3 | 42.1 | 41.5 | 42.7 | 43.7 | 42.0 | 43.5 | 43.0 |
| Years | 1881 | 1882 | 1883 | 1884 | 1885 | 1886 | 1887 | 1888 | 1889 | 1890[39] |
|---|---|---|---|---|---|---|---|---|---|---|
| Life expectancy | 45.1 | 44.0 | 44.0 | 43.6 | 44.6 | 44.6 | 45.1 | 46.3 | 45.9 | 44.1 |
| Years | 1891 | 1892 | 1893 | 1894 | 1895 | 1896 | 1897 | 1898 | 1899 | 1900[39] |
|---|---|---|---|---|---|---|---|---|---|---|
| Life expectancy | 44.4 | 45.6 | 44.7 | 48.3 | 45.4 | 47.1 | 46.4 | 46.1 | 45.2 | 45.6 |
| Years | 1901 | 1902 | 1903 | 1904 | 1905 | 1906 | 1907 | 1908 | 1909 | 1910[39] |
|---|---|---|---|---|---|---|---|---|---|---|
| Life expectancy | 46.9 | 48.3 | 49.5 | 48.1 | 49.9 | 49.6 | 50.6 | 51.0 | 51.7 | 53.3 |
| Years | 1911 | 1912 | 1913 | 1914 | 1915 | 1916 | 1917 | 1918 | 1919 | 1920[39] |
|---|---|---|---|---|---|---|---|---|---|---|
| Life expectancy | 51.2 | 54.3 | 53.4 | 53.2 | 51.2 | 54.2 | 54.2 | 47.3 | 54.3 | 57.3 |
| Years | 1921 | 1922 | 1923 | 1924 | 1925 | 1926 | 1927 | 1928 | 1929 | 1930[39] |
|---|---|---|---|---|---|---|---|---|---|---|
| Life expectancy | 58.1 | 57.0 | 59.3 | 58.1 | 58.4 | 59.6 | 59.0 | 59.9 | 57.6 | 60.8 |
| Years | 1931 | 1932 | 1933 | 1934 | 1935 | 1936 | 1937 | 1938 | 1939 | 1940[39] |
|---|---|---|---|---|---|---|---|---|---|---|
| Life expectancy | 60.0 | 60.5 | 60.6 | 61.3 | 62.0 | 61.8 | 62.3 | 63.2 | 63.6 | 60.9 |
| Years | 1941 | 1942 | 1943 | 1944 | 1945 | 1946 | 1947 | 1948 | 1949 | 1950[39] |
|---|---|---|---|---|---|---|---|---|---|---|
| Life expectancy | 61.4 | 64.0 | 64.0 | 64.8 | 65.8 | 66.3 | 66.3 | 68.4 | 68.1 | 68.6 |
1950-2015
| Years | 1950–1955 | 1955–1960 |
|---|---|---|
| Life expectancy | 69.4 | 70.6 |
| Years | 1960–1965 | 1965–1970 |
| Life expectancy | 71.0 | 71.7 |
| Years | 1970–1975 | 1975–1980 |
| Life expectancy | 72.3 | 73.0 |
| Years | 1980–1985 | 1985–1990 |
| Life expectancy | 74.2 | 75.1 |
| Years | 1990–1995 | 1995–2000 |
| Life expectancy | 76.3 | 77.2 |
| Years | 2000–2005 | 2005–2010 |
| Life expectancy | 78.4 | 79.7 |
| Years | 2010–2015 | |
| Life expectancy | 81.0 |
Source: UN World Population Prospects[40]
Age structure
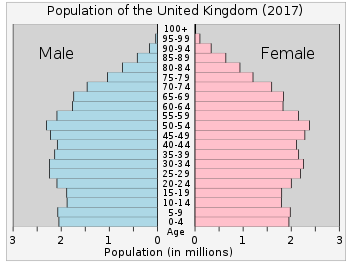
The key features of the age distribution profile for the UK population, as measured in the 2011 Census, were summarised in December 2012 by the Office for National Statistics in terms of peaks and wide bands of the pyramid reflecting high numbers of births in previous years, particularly for people aged 60–64 born following the Second World War and those aged 40–49, born during the 1960s baby boom. There is a smaller number of children aged five to nine years than ten years ago, which is a consequence of low numbers of births at the beginning of the 21st century, and the broadening of the pyramid in the 0–4 years category is due to higher numbers of births in recent years. At higher ages, females outnumber males, reflecting the higher life expectancy of females. At lower ages, there are more males than females, reflecting that there are slightly more boys than girls born each year.[41][42]
The most recent UK Office for National Statistics' population estimates for mid-2016 suggest the median age of the UK population was 40.0 years.[43]
In 2015, there were estimated to be over half a million people (556,270) aged 90 and over living in the UK, up from 194,670 people in 1985,[44] and there were estimated to be 14,570 centenarians (people aged 100 or over) and 850 people aged 105 or over.[45]
The UK Office for National Statistics' 2016-based National Population Projections suggest that the UK population will continue to age, with the number of people aged 85 and over doubling from 1.6 million in mid-2016 to 3.2 million in mid-2041.[46]
| Ages | 1976 | 1986 | 2016 |
|---|---|---|---|
| 0–15 years (%) | 24.5 | 20.5 | 18.9 |
| 16–64 years (%) | 61.2 | 64.1 | 63.1 |
| 65 years and over (%) | 14.2 | 15.4 | 18.0 |
| Ages attained
(years) |
Population | % of total |
|---|---|---|
| 0–4 | 3,914,000 | 6.2 |
| 5–9 | 3,517,000 | 5.6 |
| 10–14 | 3,670,000 | 5.8 |
| 15–19 | 3,997,000 | 6.3 |
| 20–24 | 4,297,000 | 6.8 |
| 25–29 | 4,307,000 | 6.8 |
| 30–34 | 4,126,000 | 6.5 |
| 35–39 | 4,194,000 | 6.6 |
| 40–44 | 4,626,000 | 7.3 |
| 45–49 | 4,643,000 | 7.3 |
| 50–54 | 4,095,000 | 6.5 |
| 55–59 | 3,614,000 | 5.7 |
| 60–64 | 3,807,000 | 6.0 |
| 65–69 | 3,017,000 | 4.8 |
| 70–74 | 2,463,000 | 3.9 |
| 75–79 | 2,006,000 | 3.2 |
| 80–84 | 1,496,000 | 2.4 |
| 85–89 | 918,000 | 1.5 |
| 90+ | 476,000 | 0.8 |
| Age group | Population | Percentage (%) | ||
|---|---|---|---|---|
| Male
(million) |
Female
(million) |
Total
(million) | ||
| 0–14 | 5.681 | 5.419 | 11.100 | 17.6 |
| 15–64 | 20.751 | 20.953 | 41.704 | 66.0 |
| 65+ | 4.597 | 5.781 | 10.378 | 16.4 |
| All ages | 31.029 | 32.153 | 63.182 | 100 |
Social issues
Fertility
In 2012, the UK's total fertility rate (TFR) was 1.92 children per woman,[50] below the replacement rate, which in the UK is 2.075.[51] In 2001, the TFR was at a record low of 1.63, but it then increased every year until it reached a peak of 1.96 in 2008, before decreasing again.[50] The TFR was considerably higher during the 1960s 'baby boom', peaking at 2.95 children per woman in 1964.[52] In 2012 and 2013, England and Wales's TFR decreased to 1.85.[50][53] In Scotland however TFR is lower: it decreased from 1.75 in 2010 to 1.67 in 2012.[50] Northern Ireland has the highest TFR in the UK, standing at 2.02 in 2010 and 2.03 in 2012.[50]
In 2014, 27% of births were to mothers born outside the UK, a 0.5 point increase since 2013. The 2014 fertility rate was higher for foreign-born mothers (2.09) than UK-born mothers (1.76). In the 2010–14 time period, the most common countries of birth for mothers (excluding the UK) were Poland, Pakistan and India; and Poland and India for fathers. Within the UK, Newham, London had the highest rate of births to non-UK mothers (76.7%) and Torfaen, Wales the lowest (3.2%).[54]
Death rate and cause
| First cause | Second cause | |
|---|---|---|
| Male | Ischaemic heart disease | Dementia and Alzheimer's disease |
| Female | Dementia and Alzheimer's disease | Ischaemic heart disease |
| First cause | Second cause | |
|---|---|---|
| Male | Ischaemic heart disease (~15.4%) | Malignant neoplasms of trachea, bronchus and lungs (lung cancer) |
| Female | Dementia and Alzheimer's disease (~12.2%) | Ischaemic heart disease |
(Percentiles are rounded where given)
Other demographics statistics
Demographic statistics according to the World Population Review in 2019.[57]
- One birth every 39 seconds
- One death every 52 seconds
- Net gain of one person every minute
- One net migrant every 3 minutes
Demographic statistics according to the CIA World Factbook, unless otherwise indicated.[38]
- Population
- 65,105,246 United Kingdom (July 2018 est.)
constituent countries:
- England 55,268,100
- Scotland 5,404,700
- Wales 3,113,200
- Northern Ireland 1,862,100
- Age structure
- 0-14 years: 17.59% (male 5,871,268 /female 5,582,107)
- 15-24 years: 11.71% (male 3,895,850 /female 3,726,311)
- 25-54 years: 40.29% (male 13,387,119 /female 12,843,549)
- 55-64 years: 12.22% (male 3,936,466 /female 4,022,245)
- 65 years and over: 18.19% (male 5,321,392 /female 6,518,939) (2018 est.)
- 0-14 years: 17.53% (male 5,819,363/female 5,532,123)
- 15-24 years: 11.9% (male 3,938,643/female 3,770,511)
- 25-54 years: 40.55% (male 13,387,903/female 12,873,090)
- 55-64 years: 11.98% (male 3,843,268/female 3,918,244)
- 65 years and over: 18.04% (male 5,246,475/female 6,439,832) (2017 est.)
- Median age
- total: 40.5 years. Country comparison to the world: 48th
- male: 39.3 years
- female: 41.7 years (2018 est.)
- total: 40.5 years
- male: 39.3 years
- female: 41.7 years (2017 est.)
- Birth rate
- 12 births/1,000 population (2018 est.) Country comparison to the world: 167th
- 12.1 births/1,000 population (2017 est.)
- Death rate
- 9.4 deaths/1,000 population (2018 est.) Country comparison to the world: 53rd
- Total fertility rate
- 1.88 children born/woman (2018 est.) Country comparison to the world: 137th
- Population growth rate
- 0.51% (2018 est.) Country comparison to the world: 154th
- 0.52% (2017 est.)
- Ethnic groups
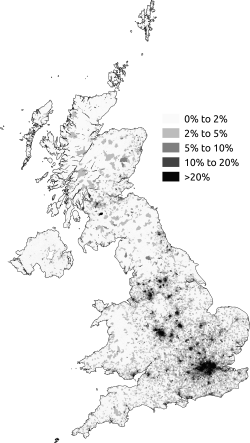
white 87.2%, black/African/Caribbean/black British 3%, Asian/Asian British: Indian 2.3%, Asian/Asian British: Pakistani 1.9%, mixed 2%, other 3.7% (2011 est.)
- Net migration rate
- 2.5 migrant(s)/1,000 population (2017 est.) Country comparison to the world: 37th
- Mother's mean age at first birth
- 28.5 years
- note: data represent England and Wales only (2014 est.)
- Life expectancy at birth
- total population: 80.8 years
- male: 78.6 years
- female: 83.1 years (2017 est.) Country comparison to the world: 35th
- Religions
Christian (includes Anglican, Roman Catholic, Presbyterian, Methodist) 59.5%, Muslim 4.4%, Hindu 1.3%, other 2%, unspecified 7.2%, none 25.7% (2011 est.)
- Urbanization
- urban population: 83.4% of total population (2018)
- rate of urbanization: 0.89% annual rate of change (2015-20 est.)
- Dependency ratios
- total dependency ratio: 55.5
- youth dependency ratio: 27.4
- elderly dependency ratio: 28.2
- potential support ratio: 3.5 (2015 est.)
- Infant mortality rate
- total: 4.3 deaths/1,000 live births
- male: 4.7 deaths/1,000 live births
- female: 3.9 deaths/1,000 live births (2017 est.) Country comparison to the world: 185
- Sex ratio
- at birth: 1.05 male(s)/female
- 0-14 years: 1.05 male(s)/female
- 15-24 years: 1.04 male(s)/female
- 25-54 years: 1.04 male(s)/female
- 55-64 years: 0.98 male(s)/female
- 65 years and over: 0.81 male(s)/female
- total population: 0.99 male(s)/female (2017 est.)
- School life expectancy (primary to tertiary education)
- total: 18 years
- male: 17 years
- female: 18 years (2014)
- Unemployment, youth ages 15–24
- total: 14.6% Country comparison to the world: 91st
- male: 16.2%
- female: 12.9% (2015 est.)
LGBT
There are known difficulties in producing reliable estimates of the lesbian, gay, bisexual and transgender population.
The Integrated Household Survey,[58] published by the Office for National Statistics, provides the following estimates for the adult UK population as of 2011:
- 1.1 percent (approximately 545,000 adults at the time of the survey) identify as gay or lesbian.
- 0.4 percent (approximately 220,000 adults) identify as bisexual.
- 0.3 percent identify as "other".
- 3.6 percent of those surveyed replied "don't know" or refused to answer the question.
- 0.6 percent of those surveyed provided "no response" to the question.
- An estimated 2.7 percent of 16- to 24-year-olds in the UK identify as gay, lesbian or bisexual compared with 0.4 percent of those aged over 65.
Other sources provide alternative estimates of the population by sexual orientation. For example, one British journal published in 2004 estimated that approximately 5% of the British population is gay.[59] A government figure estimated in 2005 that there are 3.6 million gay people in Britain comprising 6 percent of the population.,[60] though a report by the Equality and Human Rights Commission[61] described that estimate as 'of questionable validity' when set against available survey estimates.
The Gender Identity Research and Education Society (GIRES) estimated in 2009 that "56,000 might potentially be transsexual people",[62] noting that it is very difficult to make a reliable estimate. This would be 0.09% of the population at the time.
Country of birth

Below are the 60 largest foreign-born groups in the UK according to 2014 and 2015 ONS estimates.
| Country of birth |
Estimated population | |
|---|---|---|
| 2014[63] | 2015[64] | |
| United Kingdom |
54,786,000 | 55,642,000 |
| Poland |
790,000 | 831,000 |
| India |
793,000 | 795,000 |
| Pakistan |
523,000 | 503,000 |
| Republic of Ireland |
383,000 | 382,000 |
| Germany |
301,000 | 286,000 |
| Romania |
170,000 | 220,000 |
| Bangladesh |
212,000 | 217,000 |
| South Africa |
201,000 | 200,000 |
| Nigeria |
178,000 | 199,000 |
| China |
196,000 | 197,000 |
| United States |
187,000 | 181,000 |
| Italy |
150,000 | 162,000 |
| France |
147,000 | 153,000 |
| Lithuania |
137,000 | 151,000 |
| Portugal |
127,000 | 140,000 |
| Jamaica |
136,000 | 137,000 |
| Kenya |
129,000 | 134,000 |
| Sri Lanka |
139,000 | 132,000 |
| Philippines |
128,000 | 132,000 |
| Australia |
126,000 | 125,000 |
| Spain |
119,000 | 125,000 |
| Colombia |
125,000 | 125,000 |
| Somalia |
114,000 | 114,000 |
| Zimbabwe |
120,000 | 112,000 |
| Ghana |
92,000 | 108,000 |
| Latvia |
102,000 | 94,000 |
| Canada |
86,000 | 87,000 |
| Iran |
80,000 | 86,000 |
| Slovakia |
75,000 | 85,000 |
| Hungary |
79,000 | 80,000 |
| Afghanistan |
81,000 | 76,000 |
| Turkey |
82,000 | 72,000 |
| Iraq |
79,000 | 71,000 |
| Netherlands |
66,000 | 69,000 |
| Bulgaria |
65,000 | 69,000 |
| Nepal |
70,000 | 67,000 |
| Malaysia |
64,000 | 62,000 |
| Cyprus |
60,000 | 60,000 |
| Uganda |
51,000 | 60,000 |
| New Zealand |
63,000 | 59,000 |
| Greece |
52,000 | 57,000 |
| Brazil |
47,000 | 53,000 |
| Czech Republic |
42,000 | 49,000 |
| Russia |
40,000 | 46,000 |
| Taiwan |
38,000 | 45,000 |
| Singapore |
46,000 | 44,000 |
| Japan |
30,000 | 43,000 |
| Tanzania |
34,000 | 41,000 |
| Thailand |
40,000 | 39,000 |
| Egypt |
35,000 | 38,000 |
| Belgium |
20,000 | 35,000 |
| Mauritius |
41,000 | 34,000 |
| Sweden |
26,000 | 31,000 |
| Sierra Leone |
24,000 | 31,000 |
| Saudi Arabia |
34,000 | 30,000 |
| Vietnam |
28,000 | 29,000 |
| Malta |
27,000 | 28,000 |
| Denmark |
25,000 | 28,000 |
| Albania |
20,000 | 28,000 |
| Zambia |
31,000 | 27,000 |
| DR Congo |
24,000 | 24,000 |
| Libya |
24,000 | 24,000 |
 Estimated foreign-born population by country of birth, April 2007 – March 2008.
 Estimated foreign-nationals population by country of nationality, April 2007 – March 2008.
Ethnicity
| Ethnic group | 2001[66][67][68][69] | 2011[70] | ||
|---|---|---|---|---|
| Number | % | Number | % | |
| White: Total | 54,153,898 | 92.12% | 55,073,552 | 87.17% |
| White: Irish Traveller | 63,193 | 0.10% | ||
| Asian or Asian British: Total | 2,578,826 | 4.39% | 4,373,339 | 6.92% |
| Asian or Asian British: Indian | 1,053,411 | 1.79% | 1,451,862 | 2.30% |
| Asian or Asian British: Pakistani | 747,285 | 1.27% | 1,174,983 | 1.86% |
| Asian or Asian British: Bangladeshi | 283,063 | 0.48% | 451,529 | 0.71% |
| Asian or Asian British: Chinese[note 1] | 247,403 | 0.42% | 433,150 | 0.69% |
| Asian or Asian British: Asian Other | 247,664 | 0.42% | 861,815 | 1.36% |
| Black or Black British[note 2] | 1,148,738 | 1.95% | 1,904,684 | 3.01% |
| British Mixed | 677,117 | 1.15% | 1,250,229 | 1.98% |
| Other: Total | 230,615 | 0.39% | 580,374 | 0.92% |
| Total | 58,789,194 | 100.00% | 63,182,178 | 100.00% |
Note:
- In 2001, listed under the "Other ethnic group" heading.
- For the purpose of harmonising results to make them comparable across the UK, the ONS includes individuals in Scotland who classified themselves in the "African" category (29,638 people), which in the Scottish version of the census is separate from "Caribbean or Black" (6,540 people),[71] in this "Black or Black British" category. The ONS note that "the African categories used in Scotland could potentially capture White/Asian/Other African in addition to Black identities".[72]
Religion

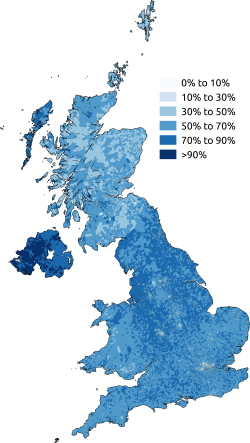
The traditional religion in the United Kingdom is Christianity. In England the established church is the Church of England (Anglican). In Scotland, the Church of Scotland (a Presbyterian Church) is regarded as the 'national church' but there is not an established church.
In Wales there is no established church, with the Church in Wales having been disestablished in 1920. Likewise, in Ireland the Church of Ireland was disestablished in 1871. In Northern Ireland and similarly in parts of Scotland, there is a degree of sectarian divide between Roman Catholic and Protestant communities.
The table below shows data regarding religion for the 2001 and 2011 censuses:
| Religion | 2001[73][74][75][76] | 2011[77][78][79][80] | ||
|---|---|---|---|---|
| Number | % | Number | % | |
| Christian | 42,079,417 | 71.58% | 37,583,962 | 59.49% |
| Muslim | 1,591,126 | 2.71% | 2,786,635 | 4.41% |
| Hindu | 558,810 | 0.95% | 835,394 | 1.32% |
| Sikh | 336,149 | 0.57% | 432,429 | 0.68% |
| Jewish | 266,740 | 0.45% | 269,568 | 0.43% |
| Buddhist | 151,816 | 0.26% | 261,584 | 0.41% |
| Other religion | 178,837 | 0.30% | 262,774 | 0.42% |
| No religion | 16,221,509 | 25.67% | ||
| Religion not stated | 4,528,323 | 7.17% | ||
| (No religion and Religion not stated) | 13,626,299 | 23.18% | 20,749,832 | 32.84% |
| Total population | 58,789,194 | 100.00% | 63,182,178 | 100.00% |
In the 2011 Census, rather than select one of the specified religions offered on the Census form, many people chose to write in their own religion. Some of these religions were reassigned to one of the main religions offered. In England and Wales, 241,000 people belonged to religious groups which did not fall into any of the main religions.[81] The largest of these were Pagans (57,000) and Spiritualists (39,000). The census also recorded 177,000 people stating their religion as Jedi Knight. These returns were classified as "No religion", along with Atheist, Agnostic, Heathen and those who ticked "Other" but did not write in any religion.
In 2012 the British Social Attitudes Survey found the highest number to be non-religious (48%) followed by Christians (46%) with another six percent identifying otherwise. Discrepancies found between surveys may be the result of differences in phrasing, question order, and data collection method.[82]
Languages
The United Kingdom's de facto official language is English which is spoken as a first language by 95% of the population. Six regional languages; Scots, Ulster-Scots, Welsh, Cornish, Irish and Scottish Gaelic are protected under the European Charter for Regional or Minority Languages. Abilities in these languages (other than Cornish) for those aged three and above were recorded in the UK census 2011 as follows.[83][84][85]
| Ability | Wales | Scotland | Northern Ireland | |||||||
|---|---|---|---|---|---|---|---|---|---|---|
| Welsh | Scottish Gaelic | Scots | Irish | Ulster-Scots | ||||||
| Number | % | Number | % | Number | % | Number | % | Number | % | |
| Understands but does not speak, read or write | 157,792 | 5.15% | 23,357 | 0.46% | 267,412 | 5.22% | 70,501 | 4.06% | 92,040 | 5.30% |
| Speaks, reads and writes | 430,717 | 14.06% | 32,191 | 0.63% | 1,225,622 | 23.95% | 71,996 | 4.15% | 17,228 | 0.99% |
| Speaks but does not read or write | 80,429 | 2.63% | 18,966 | 0.37% | 179,295 | 3.50% | 24,677 | 1.42% | 10,265 | 0.59% |
| Speaks and reads but does not write | 45,524 | 1.49% | 6,218 | 0.12% | 132,709 | 2.59% | 7,414 | 0.43% | 7,801 | 0.45% |
| Reads but does not speak or write | 44,327 | 1.45% | 4,646 | 0.09% | 107,025 | 2.09% | 5,659 | 0.33% | 11,911 | 0.69% |
| Other combination of skills | 40,692 | 1.33% | 1,678 | 0.03% | 17,381 | 0.34% | 4,651 | 0.27% | 959 | 0.06% |
| No skills | 2,263,975 | 73.90% | 5,031,167 | 98.30% | 3,188,779 | 62.30% | 1,550,813 | 89.35% | 1,595,507 | 91.92% |
| Total | 3,063,456 | 100.00% | 5,118,223 | 100.00% | 5,118,223 | 100.00% | 1,735,711 | 100.00% | 1,735,711 | 100.00% |
| Can speak | 562,016 | 18.35% | 57,602 | 1.13% | 1,541,693 | 30.12% | 104,943 | 6.05% | 35,404 | 2.04% |
| Has some ability | 799,481 | 26.10% | 87,056 | 1.70% | 1,929,444 | 37.70% | 184,898 | 10.65% | 140,204 | 8.08% |
Cornish is spoken by around 2,500 people. In the 2011 census 464 respondents aged three and over in Cornwall said that Cornish was their main language, amounting to 0.09% of the total population of Cornwall aged three and over.
 Welsh
Welsh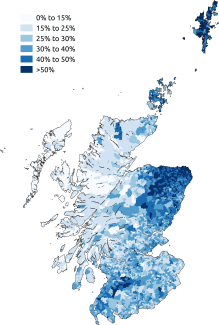 Scots
Scots Scottish Gaelic
 Irish
Irish Ulster-Scots
After English, Polish was the second most common language given in the United Kingdom census 2011. 618,091 respondents aged three and over said that Polish was their main language, amounting to 1.01% of the total population of the United Kingdom aged three and over.
The French language is spoken in some parts of the Channel Islands although the islands, like the Isle of Man, are not part of the United Kingdom.[86] British Sign Language is also common.
National identity
Respondents to the 2011 UK census gave their national identities as follows.[87][88][89]
| National identity | United Kingdom | Country | |||
|---|---|---|---|---|---|
| England | Scotland | Wales | N. Ireland | ||
| English only | 51.41% | 60.38% | 2.28% | 11.22% | 0.60% |
| Scottish only | 5.93% | 0.79% | 62.43% | 0.50% | 0.37% |
| Welsh only | 3.26% | 0.55% | 0.15% | 57.51% | 0.06% |
| Northern Irish only | 0.81% | 0.21% | 0.33% | 0.14% | 20.94% |
| British only | 18.77% | 19.19% | 8.37% | 16.95% | 39.89% |
| English and British only | 7.82% | 9.09% | 1.26% | 1.54% | 0.27% |
| Scottish and British only | 1.67% | 0.15% | 18.29% | 0.07% | 0.09% |
| Welsh and British only | 0.44% | 0.11% | 0.06% | 7.11% | 0.02% |
| Northern Irish and British only | 0.22% | 0.03% | 0.15% | 0.02% | 6.17% |
| Other combination of UK identities only (excludes Irish) | 0.45% | 0.37% | 1.01% | 1.10% | 0.13% |
| Other identity and at least one UK identity | 0.97% | 0.90% | 1.25% | 0.43% | 3.05% |
| Irish only | 1.31% | 0.64% | 0.41% | 0.32% | 25.26% |
| Other | 6.94% | 7.59% | 4.01% | 3.10% | 3.12% |
| Total | 100.00% | 100.00% | 100.00% | 100.00% | 100.00% |
Education


Each country of the United Kingdom has a separate education system, with power over education matters in Scotland, Wales and Northern Ireland being devolved.
The Secretary of State for Education is responsible to the UK Parliament for education in England. Depending on the status of state schools, control of day-to-day administration and funding may be the responsibility of either the local education authorities or the school's own governing institution. Universal state education in England and Wales was introduced for primary level in 1870 and secondary level in 1900.[90] Education is mandatory from ages 5 to 18, raised from 16 (15 if born in late July or August) in 2013. The majority of children are educated in state-sector schools, only a small proportion of which select on the grounds of academic ability. Despite a fall in actual numbers, the proportion of children in England attending private schools rose slightly from 7.1% to 7.3% between 2004 and 2007.[91]
Just over half of students at the leading universities of Cambridge and Oxford had attended state schools.[92] State schools that are allowed to select pupils according to intelligence and academic ability can achieve comparable results to the most selective private schools: out of the top ten performing schools in terms of GCSE results in 2006, two were state-run grammar schools. England has four universities ranked amongst the top ten in the 2011 THES - QS World University Rankings.[93]

In Scotland, the Cabinet Secretary for Education and Lifelong Learning is responsible to the Scottish Parliament for education, with day-to-day administration and funding of state schools being the responsibility of local authorities. Scotland first legislated for universal provision of education in 1696. The proportion of children in Scotland attending private schools is just over 4%, though it has been rising slowly in recent years. Scottish students who attend Scottish universities pay neither tuition fees nor graduate endowment charges, as the fees were abolished in 2001 and the graduate endowment scheme was abolished in 2008.[94]
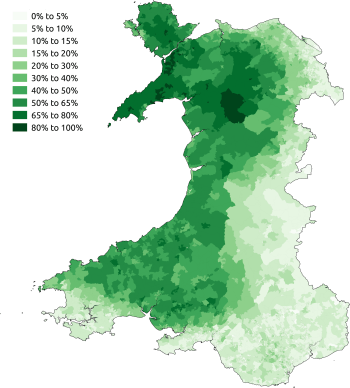
The National Assembly for Wales has responsibility for education in Wales. A significant number of students in Wales are educated either wholly or largely through the medium of Welsh and lessons in the language are compulsory for all until the age of 16. There are plans to increase the provision of Welsh-medium schools as part of the policy of having a fully bilingual Wales.
The Northern Ireland Assembly is responsible for education in Northern Ireland though responsibility at a local level is administered by 5 Education and Library Boards covering different geographical areas.
The UK has some of the top universities in the world with Cambridge, Oxford and Imperial College ranked amongst the top 10 in the 2014–15 Times Higher Education World University Rankings.
The Programme for International Student Assessment coordinated by the OECD currently ranks the overall knowledge and skills of British 15-year-olds as 13th in the world in reading literacy, mathematics, and science with the average British student scoring 503.7, compared with the OECD average of 493.[95]
See also
- Demography of England
- Demography of Scotland
- Demography of Wales
- Demography of Northern Ireland
- Demography of London
- Demography of Birmingham
- Demography of Greater Manchester
- City status in the United Kingdom
- List of cities in the United Kingdom
- List of renewable resources produced and traded by the United Kingdom
- List of urban areas in the United Kingdom
- Genetic history of Britain
Notes
- In fertility rates, 2.1 and above is a stable population and has been marked blue, 2 and below leads to an aging population and the result is that the population decreases.
References
- "2011 Census: Population Estimates for the United Kingdom" (PDF). Office for National Statistics. 27 March 2011. Retrieved 18 December 2012.
- "Main comparisons: Population and Migration". Office for National Statistics. Archived from the original on 5 January 2016. Retrieved 23 June 2016.
- "Table 2 2011 Census: Usual resident population and population density, the local authorities in the United Kingdom 17 December 2012". Ons.gov.uk. 17 December 2012. Retrieved 23 December 2012.
- Focus on People and Migration, ONS, retrieved 4 May 2015
- UK Literacy Rate 2003 [CIA] World Book, Retrieved 17 June 2013
- Education (Scotland) Act 1872
- "School leaving age". GOV.UK.
- Owen, James (27 April 2006). "British Have Changed Little Since Ice Age, Gene Study Says". Archived from the original on 27 April 2006.
- Sykes, Bryan (2011). Blood of the Isles. Transworld. ISBN 9781446438800.
- Oppenheimer, Stephen. "Myths of British ancestry".
- Joan P. Alcock, A Brief History of Roman Britain, page 260, Hachette UK
- Will Durant (7 June 2011). Caesar and Christ: The Story of Civilization. Simon and Schuster. pp. 468–. ISBN 978-1-4516-4760-0.
- Anne Lancashire (2002). London Civic Theatre: City Drama and Pageantry from Roman Times to 1558. Cambridge University Press. p. 19. ISBN 978-0-5216-3278-2.
- DNA study finds London was ethnically diverse from start, BBC, 23 November 2015
- Ray Laurence (2012), Roman Archaeology for Historians, page 121, Routledge
- David Shotter (2012), Roman Britain, page 37, Routledge
- Mabel C. Buer, Health, Wealth and Population in the Early Days of the Industrial Revolution, London: George Routledge & Sons, 1926, page 30 ISBN 0-415-38218-1
- A portrait of Britain in 2031, The Independent, 24 October 2007
- Statistics | Counting the Emigrants, Public Record Office of Northern Ireland
- History and Lessons of Potato Late Blight Archived 9 May 2011 at the Wayback Machine, University of California
- 1841: A window on Victorian Britain, The Independent, 25 April 2006
- Irish-Catholic Immigration, The Library of Congress
- Mintz, Steven. "The Irish Potato Famine". Digitalhistory.uh.edu. Archived from the original on 23 August 2012. Retrieved 31 July 2012.
- "Ireland – Population Summary". Homepage.tinet.ie. Retrieved 31 July 2012.
- "Population Estimates for UK, England and Wales, Scotland and Northern Ireland: mid-2018". Office for National Statistics.
- "The Countries of the UK". Office for National Statistics. Archived from the original on 8 January 2016. Retrieved 15 October 2017.
- National Population Projections, 2016-based, retrieved 29 October 2017
- "2011 Census – Built-up areas". ONS. Retrieved 20 August 2013.
- Table 1 2011 Census: Usual resident population by five-year age group and sex, United Kingdom and constituent countries, Accessed 20 December 2012
- "National Statistics Online" (PDF). Archived from the original (PDF) on 29 June 2011.
- "UK 2011 Census".
- "UK Population Estimates 1851 to 2014- Office for National Statistics". Office for National Statistics. September 2014. Retrieved 17 March 2017.
- "Vital statistics in the UK: births, deaths and marriages - Office for National Statistics". www.ons.gov.uk.
- "Vital Statistics: Population and Health Reference Tables". Office for National Statistics. 28 November 2016. Retrieved 7 January 2017.
- Max Roser (2014), "Total Fertility Rate around the world over the last centuries", Our World In Data, Gapminder Foundation, archived from the original on 5 July 2019, retrieved 7 August 2018
- "United Kingdom population mid-year estimate". Office for National Statistics. Retrieved 6 March 2018.
- "Vital statistics: population and health reference tables". Office for National Statistics. Retrieved 6 March 2018.
- "World Factbook EUROPE : United Kingdom", The World Factbook, 12 July 2018
- "Life expectancy". Our World in Data. Retrieved 28 August 2018.
- "World Population Prospects – Population Division – United Nations". Archived from the original on 19 September 2016. Retrieved 15 July 2017.
- 2011 Census: Population Estimates for the United Kingdom, 27 March 2011, Accessed 21 December 2012
- Structure of Population by Age Archived 17 November 2014 at the Wayback Machine Bluenomics
- Population Estimates for UK, England and Wales, Scotland and Northern Ireland: Mid-2016, Office for National Statistics
- "Estimates of the very old (including centenarians), UK - Office for National Statistics". www.ons.gov.uk. Retrieved 16 September 2017.
- "Estimates of the very old (including centenarians), UK - Office for National Statistics". www.ons.gov.uk. Retrieved 16 September 2017.
- "National Population Projections, 2016-based - Office for National Statistics". www.ons.gov.uk. Retrieved 29 October 2017.
- Office for National Statistics, Article: Overview for UK population: July 2017
- 2011 Census: Usual resident population by five-year age group and sex, local authorities in the United Kingdom, ons.gov.uk Accessed 23 December 2012
- Table 1 2011 Census: Usual resident population by five-year age group and sex, United Kingdom and constituent countries, ons.gov.uk Accessed 20 December 2012
- "Vital Statistics: Population and Health Reference Tables (February 2014 Update): Annual Time Series Data". ONS. Retrieved 27 April 2014.
- "Fertility: UK fertility highest since 1980". Office for National Statistics. 22 August 2007. Retrieved 22 September 2007.
- "Large decrease in number of births, ONS figures show". BBC News.
- "Births in England and Wales by Parents' Country of Birth, 2014". Office for National Statistics. 27 August 2015. Retrieved 23 November 2015.
- United Kingdom Government Digital Service - Health profile for England: Major causes of death and how they have changed The Cabinet Office of (H.M.) Government of the United Kingdom Accessed 15 February 2018
- Office for National Statistics - Most deaths caused by; correlated to age and gender Accessed 15 February 2018
- "United Kingdom Population 2019", World Population Review
- "Integrated Household Survey April 2011 to March 2012: Experimental Statistics" (PDF). Ons.gov.uk. Retrieved 7 November 2017.
- Full text -The British Journal of Psychiatry – Rcpsych.org retrieved 6 January 2013
- 3.6m people in Britain are gay – official retrieved 6 January 2013
- "Research Report 37 – Estimating the size and composition of the LGBT population in Britain", Equalityhumanrights.com, retrieved 3 May 2015
- Gender variance in the UK: prevalence, incidence, growth and geographic distribution (June 2009) page 13, retrieved 12 May 2013
- "Table 1.3: Overseas-born population in the United Kingdom, excluding some residents in communal establishments, by sex, by country of birth, January 2014 to December 2014". Office for National Statistics. 27 August 2015. Retrieved 11 October 2016. Figure given is the central estimate. See the source for 95% confidence intervals.
- "Table 1.3: Overseas-born population in the United Kingdom, excluding some residents in communal establishments, by sex, by country of birth, January 2015 to December 2015". Office for National Statistics. 25 August 2016. Retrieved 11 October 2016. Figure given is the central estimate. See the source for 95% confidence intervals.
- "COLOMBIA : MAPPING EXERCISE LONDON, SEPTEMBER 2007" (PDF). Unitedkingdom.iom.int. Archived from the original (PDF) on 15 March 2017. Retrieved 7 November 2017.
- "2001 Census KS06 Ethnic group: Key Statistics for local Authorities" (XLS). Ons.gov.uk. Retrieved 4 September 2014.
- "Analysis of Ethnicity in the 2001 Census – Summary Report". Scotland.gov.uk. Retrieved 4 September 2014.
- "Census 2001 Key Statistics – Urban area summary results for local authorities KS06 Ethnic group" (XLS). Ons.gov.uk. Retrieved 4 September 2014.
- "Northern Ireland Neighbourhood Information Service" (XLS). Ninis2.nisra.gov.uk. Retrieved 4 September 2014.
- 2011 Census: KS201UK Ethnic group, local authorities in the United Kingdom ONS, Retrieved 21 October 2013
- "Table KS201SC – Ethnic group: All people" (PDF). National Records of Scotland. 2013. Retrieved 28 April 2015.
- "Ethnic group". Office for National Statistics. Retrieved 27 April 2015.
- "Religion (2001 Census)". data.gov.uk. Retrieved 18 December 2012.
- "Summary: Religious Group Demographics". scotland.gov.uk. Retrieved 18 December 2012.
- "Census 2001: Religion (administrative geographies)". nisra.gov.uk. Retrieved 18 December 2012.
- "Table KS07c: Religion (full list with 10 or more persons)". nisra.gov.uk. Retrieved 18 December 2012.
- "2011 Census: KS209EW Religion, local authorities in England and Wales". ons.gov.uk. Retrieved 18 December 2012.
- "Scotland's Census 2011: Table KS209SCa" (PDF). scotlandcensus.gov.uk. Retrieved 26 September 2013.
- "Census 2011: Religion: KS211NI (administrative geographies)". nisra.gov.uk. Retrieved 18 December 2012.
- "Census 2011: Religion – Full Detail: QS218NI – Northern Ireland". nisra.gov.uk. Retrieved 1 October 2013.
- Census Table QS210EW Religion (detailed), Ons.gov.uk, retrieved 4 May 2015.
- Michael Lipka (24 April 2014). Cameron's 'Christian country': What the numbers say about religion in the United Kingdom (Report). Pew Research.
- "NOMIS – Census 2011". Retrieved 28 July 2014.
- "Scotland's Census 2011 – Standard Outputs". Retrieved 28 July 2014.
- "Northern Ireland Neighbourhood Information Service". Retrieved 28 July 2014.
- "Royal.gov.uk". Royal.gov.uk. Archived from the original on 21 September 2012. Retrieved 4 October 2012.
- 2011 Census, England and Wales: National identity (detailed), local authorities in England and Wales, Accessed 2 April 2014
- 2011 Census, Scotland: National identity (detailed) Archived 7 April 2014 at the Wayback Machine, Accessed 2 April 2014
- 2011 Census, Northern Ireland: National Identity – Full Detail, Accessed 2 April 2014
- "United Kingdom". Humana. Archived from the original on 3 October 2006. Retrieved 18 May 2006.
- Private school pupil numbers in decline guardian.co.uk 9 November 2007
- More state pupils in universities BBC News, 19 July 2007
- "QS World University Rankings – 2011". Top Universities. 19 December 2012. Archived from the original on 1 October 2011. Retrieved 16 June 2013.
- MSPs vote to scrap endowment fee BBC News, 28 February 2008
- https://www.oecd.org/pisa/Combined_Executive_Summaries_PISA_2018.pdf
Bibliography
- "Census 2001". Religion in Britain. Archived from the original on 12 March 2007. Retrieved 6 September 2005.
- "Census 2001". 390,000 Jedis There Are. Retrieved 6 September 2005.
- Census 2001 website
- Abstract (1833). Abstract of the Answers and Returns made pursuant to an act passed in the eleventh year of the reign of His Majesty King George IV intituled an act for taking an account of the population of Great Britain, and the increase and diminution thereof. Population Register Abstract 1831. British Parliamentary Papers, 38.
- Arkell, T. (1992). An Examination of the Poll Taxes of the late Seventeenth Century, the Marriage Duty Act and Gregory King.
- K. Schürer, & T. Arkell (eds.), Surveying the People: the interpretation and use of document sources for the study of population in the late seventeenth century (pp. 142–177). Oxford: Leopard's Hill Press.
- Boulton, J. (1992). "The Marriage Duty Act and parochial registration in London, 1695–1706". In: K. Schürer, & T. Arkell (eds.), Surveying the People: the interpretation and use of document sources for the study of population in the late seventeenth century; pp. 222–252. Oxford: Leopard's Hill Press.
- Boulton, J. (1993). "Clandestine marriage in London: an examination of the neglected urban variable", in: Urban History; 20, pp. 191–210.
United Kingdom articles | |||||||||||||||
|---|---|---|---|---|---|---|---|---|---|---|---|---|---|---|---|
| History |
|  | |||||||||||||
| Geography |
| ||||||||||||||
| Politics |
| ||||||||||||||
| Economy |
| ||||||||||||||
| Society |
| ||||||||||||||
| |||||||||||||||
| |||||||||||||||
| Companies |
| ||||||||
|---|---|---|---|---|---|---|---|---|---|
| Currency, governance, regulation |
| ||||||||
| History |
| ||||||||
| Nations, regions, cities |
| ||||||||
| People and labour |
| ||||||||
| Sectors |
| ||||||||
| Trade and business organisations |
| ||||||||
| |||||||||