World economy
The world economy or global economy is the economy of all humans of the world, considered as the international exchange of goods and services that is expressed in monetary units of account.[1] In some contexts, the two terms are distinct "international" or "global economy" being measured separately and distinguished from national economies while the "world economy" is simply an aggregate of the separate countries' measurements. Beyond the minimum standard concerning value in production, use and exchange the definitions, representations, models and valuations of the world economy vary widely. It is inseparable from the geography and ecology of Earth.
| World economy |
|---|
It is common to limit questions of the world economy exclusively to human economic activity and the world economy is typically judged in monetary terms, even in cases in which there is no efficient market to help valuate certain goods or services, or in cases in which a lack of independent research or government cooperation makes establishing figures difficult. Typical examples are illegal drugs and other black market goods, which by any standard are a part of the world economy, but for which there is by definition no legal market of any kind.
However, even in cases in which there is a clear and efficient market to establish a monetary value, economists do not typically use the current or official exchange rate to translate the monetary units of this market into a single unit for the world economy since exchange rates typically do not closely reflect worldwide value, for example in cases where the volume or price of transactions is closely regulated by the government.
Rather, market valuations in a local currency are typically translated to a single monetary unit using the idea of purchasing power. This is the method used below, which is used for estimating worldwide economic activity in terms of real United States dollars or euros. However, the world economy can be evaluated and expressed in many more ways. It is unclear, for example, how many of the world's 7.62 billion people have most of their economic activity reflected in these valuations.
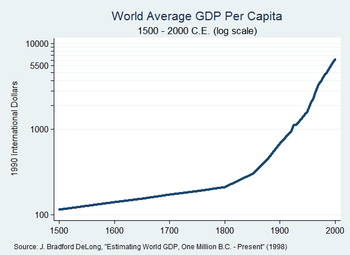
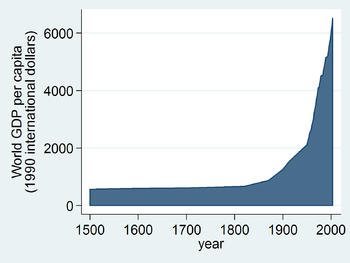
According to Maddison, until the middle of 19th century, global output was dominated by China and India. Waves of Industrial Revolution in Western Europe and Northern America shifted the shares to the Western Hemisphere. As of 2020, the following 15 countries or regions have reached an economy of at least US$2 trillion by GDP in nominal or PPP terms: Brazil, China, France, Germany, India, Indonesia, Italy, Japan, South Korea, Mexico, Russia, Turkey, the United Kingdom, the United States and the European Union.[2]
Overview
World economy by country groups
The following two tables list the country groups with individual countries designated by the IMF.[3] Members of the G-20 major economies are in bold.
| List of country groups by GDP (nominal) at peak level as of 2020 in millions US$[4] | List of country groups by GDP (PPP) at peak level as of 2020 in millions US$[4] | ||||||||||||||||||||||||||||||||||||||||||||||||||||||||||||||||||||||||||||||||||||||||||
|
| ||||||||||||||||||||||||||||||||||||||||||||||||||||||||||||||||||||||||||||||||||||||||||
Current world economic league table of largest economies in the world by GDP and share of global economic growth
The following two tables list the 25 largest economies by GDP (nominal), twenty largest economies by GDP (PPP) as of 2019. Members of the G-20 major economies are in bold.
| List of the 25 largest economies by GDP (nominal) at their peak level as of 2020 in millions US$[5] |
List of the 25 largest economies by GDP (PPP) at their peak level as of 2020 in millions US$[6] |
List of the 25 economies by highest GDP (nominal) per capita at their peak level as of 2020 in US$ |
List of the 25 economies by highest GDP (PPP) per capita at their peak level as of 2020 in US$ | ||||||||||||||||||||||||||||||||||||||||||||||||||||||||||||||||||||||||||||||||||||||||||||||||||||||||||||||||||||||||||||||||||||||||||||||||||||||||||||||||||||||||||||||||||||||||||||||||||||||||||||||||||||||||||||||||||||||||||||||||||||||||||||||||||||||||||||||||||||||||||||||||||||||||||||||||||||||||||||||||||||||||||||||||||||||||||||||||||||||||||||||||||||||||||||||||||||||||||||||||||||||||||||||||||||||||||||||||
|
|
|
| ||||||||||||||||||||||||||||||||||||||||||||||||||||||||||||||||||||||||||||||||||||||||||||||||||||||||||||||||||||||||||||||||||||||||||||||||||||||||||||||||||||||||||||||||||||||||||||||||||||||||||||||||||||||||||||||||||||||||||||||||||||||||||||||||||||||||||||||||||||||||||||||||||||||||||||||||||||||||||||||||||||||||||||||||||||||||||||||||||||||||||||||||||||||||||||||||||||||||||||||||||||||||||||||||||||||||||||||||
Twenty largest economies in the world by nominal GDP
The following is a list of the twenty largest economies by nominal GDP at peak value as of the specific year according to the International Monetary Fund.[7]
Twenty largest economies in the world by GDP (PPP)
The following is a list of twenty largest economies by GDP based on purchasing power parity at peak value as of the specific year according to the International Monetary Fund and the CIA World Factbook.[8][9]
Statistical indicators
Economy
%2C_Credit_Suisse.png)
- GDP (GWP) (gross world product): (purchasing power parity exchange rates) – $59.38 trillion (2005 est.), $51.48 trillion (2004), $23 trillion (2002)
- GDP (GWP) (gross world product):[11] (market exchange rates) – $60.69 trillion (2008)
- GDP[12] (real growth rate):
- Developed Economies 2.2% (2017), 2.0% (predicted 2018)
- Developing Countries 4.3% (2017), 4.6% (predicted 2018)
- Least developed countries 4.8% (2017), 5.4% (predicted 2018)
- GDP – per capita: purchasing power parity – $9,300, €7,500 (2005 est.), $8,200, €6,800 (92) (2003), $7,900, €5,000 (2002)
- World median income: purchasing power parity $1,041, €950 (1993)[13]
- GDP – composition by sector: agriculture: 4%; industry: 32%; services: 64% (2004 est.)
- Inflation rate (consumer prices); national inflation rates vary widely in individual cases, from declining prices in Japan to hyperinflation in several Third World countries (2003):
- World 2.6% (2017), 2.8% (predicted 2018);[14]
- Developed Economies 1% to 4% typically
- Developing Countries 5% to 60% typically
- Least developed countries 11.4% (2017), 8.3% (predicted 2018)[14]
- Derivatives OTC outstanding notional amount: $601 trillion (Dec 2010) ()
- Derivatives exchange traded outstanding notional amount: $82 trillion (June 2011) ()
- Global debt issuance: $5.187 trillion, €3 trillion (2004), $4.938 trillion, €3.98 trillion (2003), $3.938 trillion (2002) (Thomson Financial League Tables)
- Global equity issuance: $505 billion, €450 billion (2004), $388 billion. €320 billion (2003), $319 billion, €250 trillion (2002) (Thomson Financial League Tables)
Employment
- Unemployment rate: 8.7% (2009 est.). 30% (2007 est.) combined unemployment and underemployment in many non-industrialized countries; developed countries typically 4%–12% unemployment.
Industries
- Industrial production growth rate: 3% (2002 est.)
Energy
- Yearly electricity – production: 21,080,878 GWh (2011 est.),[15] 15,850,000 GWh (2003 est.), 14,850,000 GWh (2001 est.)
- Yearly electricity – consumption: 14,280,000 GWh (2003 est.), 13,930,000 GWh (2001 est.)
- Oil – production: 79,650,000 bbl/d (12,663,000 m3/d) (2003 est.), 75,460,000 barrels per day (11,997,000 m3/d) (2001)
- Oil – consumption: 80,100,000 bbl/d (12,730,000 m3/d) (2003 est.), 76,210,000 barrels per day (12,116,000 m3/d) (2001)
- Oil – proved reserves: 1.025 trillion barrel (163 km3) (2001 est.)
- Natural gas – production: 3,366 km3 (2012 est.),[16] 2,569 km3 (2001 est.)
- Natural gas – consumption: 2,556 km3 (2001 est.)
- Natural gas – proved reserves: 161,200 km3 (1 January 2002)
Cross-border
- Yearly exports: $12.4 trillion, €11.05 trillion (2009 est.)
- Exports – commodities: the whole range of industrial and agricultural goods and services
- Exports – partners: US 12.7%, Germany 7.1%, China 6.2%, France 4.4%, Japan 4.2%, UK 4.1% (2008)
- Yearly imports: $12.29 trillion, €10.95 trillion (2009 est.)
- Imports – commodities: the whole range of industrial and agricultural goods and services
- Imports – partners: China 10.3%, Germany 8.6%, US 8.1%, Japan 5% (2008)
- Debt – external: $56.9 trillion, €40 trillion (31 December 2009 est.)
Gift economy
- Yearly economic aid – recipient: net Official Development Assistance (ODA) of $135.2 billion (2014)[17]
Communications
Telephones – main lines in use: 843,923,500 (2007)
4,263,367,600 (2008)
Transport
Transportation infrastructure worldwide includes:
- Airports
- Total: 41,821 (2013)[20]
- Roadways (in kilometres)
- Total: 32,345,165 km
- Paved: 19,403,061 km
- Unpaved: 12,942,104 km (2002)
- Railways
- Total: 1,122,650 km includes about 190,000 to 195,000 km of electrified routes of which 147,760 km are in Europe, 24,509 km in the Far East, 11,050 km in Africa, 4,223 km in South America, and 4,160 km in North America.
Economic studies
To promote exports, many government agencies publish on the web economic studies by sector and country. Among these agencies include the USCS (US DoC) and FAS (USDA) in the United States, the EDC and AAFC in Canada, Ubifrance in France, the UKTI in the United Kingdom, the HKTDC and JETRO in Asia, Austrade and the NZTE in Oceania. Through Partnership Agreements, the Federation of International Trade Associations publishes studies from several of these agencies (USCS, FAS, AAFC, UKTI, and HKTDC) as well as other non-governmental organizations on its website globaltrade.net.
See also
- Capitalism
- Common Wealth: Economics for a Crowded Planet (book)
- Economic bubble
- Economic collapse
- Economic history of the world
- Emerging and growth-leading economies
- Global financial system
- Global workforce
- Globality
- Globalization
- Trade route
- Overconsumption
- Petrodollar recycling
- World Trade Report
- World systems theory
Regional economies:
- Economy of Africa
- Economy of Asia
- Economy of Europe
- Economy of North America
- Economy of Oceania
- Economy of South America
Events:
- 2007–2008 world food price crisis
- Late 2000s recession
- Oil price increases since 2003
Lists:
- List of countries by GDP sector composition
- List of world's largest economies (nominal) – based on current currency market exchange rates
- List of world's largest economies (PPP) – based on purchasing power parity
- Historical list of world's largest economies (PPP) – for the years between 1 and 1998
- List of world production
References
- "World Economy." – Definition. American English Definition of with Pronunciation by Macmillan Dictionary. N.p., n.d. Web. 02 Jan. 2015.
- "Gross domestic product, current prices & Gross domestic product based on purchasing-power-parity (PPP) valuation of country GDP". World Economic Outlook Database, October 2015. International Monetary Fund. October 2015. Archived from the original on 2015-10-11. Retrieved 2015-10-15.
- Archived 2018-10-10 at the Wayback Machine IMF GDP 2018 Data (October 2019)
- "Gross domestic product". IMF World Economic Outlook. October 2019. Retrieved 16 May 2020.
- IMF GDP (Nominal) Data (October 2019)
- IMF GDP (PPP) Data (April 2020)
- "Gross domestic product, current prices". International Monetary Fund. International Monetary Fund. October 2015. Retrieved 11 October 2015.
- "Gross domestic product based on purchasing-power-parity (PPP) valuation of country GDP; Current international dollar". International Monetary Fund. October 2018. Archived from the original on 3 April 2019. Retrieved 14 May 2017.
- "GDP (PURCHASING POWER PARITY)". CIA World Factbook. CIA World Factbook. 2014. Archived from the original on June 25, 2014. Retrieved October 7, 2014.
- Based on the IMF data. If no data was available for a country from IMF, data from the World Bank is used.
- "IMF World Economic Outlook, Crisis and Recovery, April 2009". Imf.org. 2009-04-16. Archived from the original on 2012-05-19. Retrieved 2012-07-17.
- "World Economic Situation and Prospects 2018". United Nations Department of Economic and Social Affairs, Development Policy and Analysis Division. Table A.3. ISBN 978-92-1-109177-9. Archived from the original on 2018-03-03. Retrieved 2018-03-02.
- B. Milanovic (January 2002). "True World Income Distribution, 1988 and 1993: First Calculation Based on Household Surveys Alone" (PDF). Archived (PDF) from the original on 2011-11-01. Retrieved 13 May 2011.
- "World Economic Situation and Prospects 2018". United Nations Department of Economic and Social Affairs, Development Policy and Analysis Division. Table I.2. p. 11. ISBN 978-92-1-109177-9. Archived from the original on 2018-03-03. Retrieved 2018-03-02.
- "International Energy Statistics". Archived from the original on 16 August 2016. Retrieved 1 April 2017.
- "International Energy Statistics". Archived from the original on 4 March 2016. Retrieved 1 April 2017.
- "Development aid stable in 2014 but flows to poorest countries still falling". OECD. 2015-04-08. Archived from the original on 2015-07-23. Retrieved 2015-07-23.
- global cellphone penetration reaches 50 percent Archived 2008-12-17 at the Wayback Machine
- "World Internet Usage Statistics News and World Population Stats". Internetworldstats.com. Archived from the original on 2011-06-23. Retrieved 2015-06-08.
- "The World Factbook — Central Intelligence Agency". Archived from the original on 25 June 2014. Retrieved 1 April 2017.
- "3. Military expenditure - SIPRI". Archived from the original on 25 May 2017. Retrieved 1 April 2017.
External links
| Wikiquote has quotations related to: World economy |
- OECD – Economic Outlook
- US Bureau of Labor and Statistics, Major Economic Indicators
- IMF – World Economic Outlook
- UN DESA – World Economy publications
- CIA – The World Factbook – World
- Career Education for a Global Economy
- BBC News Special Report – Global Economy
- Guardian Special Report – Global Economy
- World Bank Summary Trade Statistics for World
| Authority control |
|
|---|