Whanganui (New Zealand electorate)
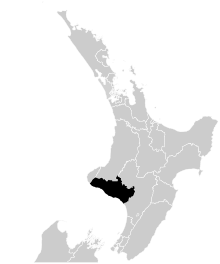
Whanganui (known as Wanganui until 1996) is a New Zealand parliamentary electorate. It was first established in 1860 for the 3rd Parliament and has existed continuously since then.
It has been held by Harete Hipango of the National Party since the 2017 general election.
Population centres
In the 1860 electoral redistribution, the House of Representatives increased the number of representatives by 12, reflecting the immense population growth since the original electorates were established in 1853. The redistribution created 15 additional electorates with between one and three members, and the Wanganui and Rangitikei electorate was split into two separate electorates: the Rangitikei electorate and the Wanganui electorate.[1]
The electorate is based on the city of Whanganui, the towns Opunake and Hawera, and smaller centres Kaponga, Eltham, Normanby, Manaia, Patea and Waverley.
History
Henry Shafto Harrison was the first representative. His 7 February 1861 election was declared invalid. He stood again in the 1861 by-election and was elected again. He then served the electorate until the end of the term in 1866.[2][3]
Harrison, John Bryce and John Garner contested the 1866 election. The nomination meeting was held on Friday, 2 March 1866. Harrison, Bryce and Garner received 51, 102 and 7 votes, respectively, at the election on the following day. Bryce was thus declared elected.[4] Bryce resigned in 1867.[5]
The resulting 6 May 1867 by-election was won by Harrison, and he served until the dissolution of Parliament on 30 December 1870.[2]
Bryce was again elected in the 30 January 1871 election. This time, he served three parliamentary terms until the dissolution in November 1881.[5]
Wanganui became a two-member electorate for the 12 January 1876 election. Apart from Bryce, Julius Vogel was elected, who was later to become Premier. Vogel resigned on 9 September 1876. [6]
The resulting 2 October 1876 by-election was won by William Fox, resulting in his second period of representation of this electorate. He served until the end of the term on 15 August 1879.[7]
Bryce and John Ballance won the 1879 election. They both server until the end of the term, with Parliament being dissolved on 8 November 1881. [8]
For the 1881 election, the electorate reverted to being represented by a single member. The election, held on 9 December, was won by William Hogg Watt. He served until the end of the term, with Parliament being dissolved on 27 June 1884.[9]
The 1884 election was once again won by John Ballance. This time, he would serve in three successive Parliaments. He died in office on 27 April 1893 during the 11th Parliament. [8] Ballance formed the Liberal Party after the 1890 election and became its leader, and thus introduced party politics to New Zealand. The Liberal Government of New Zealand would last for 21 years and is the longest serving government in New Zealand's history.
Ballance's death triggered the 1893 by-election, which was held on 13 June and won by Archibald Willis, who was re-elected at the 1893 election a few months later.[10]
Gilbert Carson was successful in the 1896 election. He served one term.[11] He was succeeded by Willis in the 1899 election, who served two more terms for the electorate.[10]
James Thomas Hogan won the 1905 election. He served two terms[12] and was defeated in the 1911 election by Bill Veitch.
Veitch had a long career in the electorate, serving until 1935, when he defeated. He was initially an Independent, but joined the Liberal Party in 1925, and changed to the United Party in 1928.
Joe Cotterill won the electorate in the 1935 election for the Labour Party. He also had a long career, retiring in 1960 from the Wanganui seat.
He was succeeded by his party colleague George Spooner in the 1960 election, who served three terms and was defeated in 1969 election by Bill Tolhurst from the National Party.
Tolhurst served one term and at the 1972 election, the electorate returned to Labour. Russell Marshall served six terms and retired in 1990.
In the 1990 election, Cam Campion secured the seat for National. He retired in 1993 and died two years after that.
The seat returned to Labour again, with Jill Pettis winning the 1993 election. She was the first woman to represent Wanganui. She served four terms, until her defeat in the 2005 election by Chester Borrows of the National Party.[13] Pettis served an additional term as a List MP until 2008. Borrows announced in 2016 that he would not seek reelection at the 2017 general election[14] and the seat was won by Harete Hipango, retaining it for the National Party.
Several members (Fox, Vogel and Ballance) became Premier. Terry Heffernan stood in the electorate five times for four parties, from 1981 to 1993.
Members of Parliament
Unless otherwise stated, all MPs terms began and ended at a general election.
Key
Independent Liberal Conservative Liberal–Labour United Labour United Labour National
single-member electorate
| Election | Winner | |
|---|---|---|
| 1861 election | Henry Harrison | |
| 1861 by-election | ||
| 1866 election | John Bryce | |
| 1867 by-election | Henry Harrison (2nd time) | |
| 1871 election | John Bryce (2nd time) | |
multi-member electorate
| Election | Winners | |||
|---|---|---|---|---|
| 1876 election | John Bryce | Julius Vogel | ||
| 1876 by-election | William Fox | |||
| 1879 election | John Ballance | |||
single-member electorate
List MPs
Members of Parliament elected from party lists in elections where that person also unsuccessfully contested the electorate. Unless otherwise stated, all MPs terms began and ended at general elections.
| Election | Winner | |
|---|---|---|
| 1996 election | Peter Gresham | |
| 2005 election | Jill Pettis | |
Election results
2017 election
| 2017 general election: Whanganui[15] | |||||||||
|---|---|---|---|---|---|---|---|---|---|
| Notes: |
Blue background denotes the winner of the electorate vote.
| ||||||||
| Party | Candidate | Votes | % | ±% | Party votes | % | ±% | ||
| National | Harete Hipango | 16,751 | 44.91 | −8.24 | 16,874 | 44.73 | −2.4 | ||
| Labour | Steph Lewis | 15,045 | 40.34 | +0.03 | 13,748 | 36.44 | +10.99 | ||
| NZ First | Reg Skipworth | 2,580 | 6.92 | — | 3,783 | 10.02 | −1.9 | ||
| Green | Nicola Patrick | 2,067 | 5.54 | — | 1,775 | 4.70 | −2.49 | ||
| ACT | Alan Davidson | 294 | 0.79 | +0.07 | 168 | 0.44 | −0.03 | ||
| Opportunities | 639 | 1.69 | — | ||||||
| Māori | 162 | 0.43 | −0.15 | ||||||
| Legalise Cannabis | 154 | 0.41 | −0.13 | ||||||
| Conservative | 94 | 0.25 | −4.75 | ||||||
| Ban 1080 | 56 | 0.15 | −0.01 | ||||||
| Outdoors | 25 | 0.07 | — | ||||||
| People's Party | 23 | 0.06 | — | ||||||
| United Future | 23 | 0.06 | −0.15 | ||||||
| Democrats | 20 | 0.05 | −0.11 | ||||||
| Mana | 12 | 0.03 | −0.7[lower-alpha 1] | ||||||
| Internet | 7 | 0.02 | −0.71[lower-alpha 2] | ||||||
| Informal votes | 560 | 161 | |||||||
| Total Valid votes | 37,297 | 37,724 | |||||||
| National hold | Majority | 1,706 | 4.57 | −8.27 | |||||
2014 election
| 2014 general election: Whanganui[16] | |||||||||
|---|---|---|---|---|---|---|---|---|---|
| Notes: |
Blue background denotes the winner of the electorate vote.
| ||||||||
| Party | Candidate | Votes | % | ±% | Party votes | % | ±% | ||
| National | 18,649 | 53.15 | -0.54 | 16,687 | 47.13 | -0.43 | |||
| Labour | Hamish McDouall | 14,144 | 40.31 | +2.80 | 9,012 | 25.45 | -1.96 | ||
| Conservative | Kim MacIntyre | 872 | 2.49 | +2.49 | 1,771 | 5.00 | +1.77 | ||
| Māori | Nancy Tuaine | 610 | 1.74 | +1.74 | 205 | 0.58 | +0.13 | ||
| ACT | Alan Daniel Davidson | 252 | 0.72 | +0.29 | 167 | 0.47 | -0.61 | ||
| Democrats | Heather Marion Smith | 208 | 0.59 | +0.20 | 57 | 0.16 | +0.01 | ||
| NZ First | 4,221 | 11.92 | +2.39 | ||||||
| Green | 2,546 | 7.19 | -1.77 | ||||||
| Internet Mana | 259 | 0.73 | +0.49 | ||||||
| Legalise Cannabis | 190 | 0.54 | -0.01 | ||||||
| United Future | 75 | 0.21 | -0.24 | ||||||
| Ban 1080 | 56 | 0.16 | +0.16 | ||||||
| Civilian | 22 | 0.06 | +0.06 | ||||||
| Focus | 14 | 0.04 | +0.04 | ||||||
| Independent Coalition | 13 | 0.04 | +0.04 | ||||||
| Informal votes | 350 | 112 | |||||||
| Total Valid votes | 35,085 | 35,407 | |||||||
| National hold | Majority | 4,505 | 12.84 | -3.34 | |||||
2011 election
| 2011 general election: Whanganui[17] | |||||||||
|---|---|---|---|---|---|---|---|---|---|
| Notes: |
Blue background denotes the winner of the electorate vote.
| ||||||||
| Party | Candidate | Votes | % | ±% | Party votes | % | ±% | ||
| National | 16,743 | 53.69 | -2.61 | 15,151 | 47.56 | +1.25 | |||
| Labour | Hamish McDouall | 11,697 | 37.51 | -0.10 | 8,733 | 27.41 | -8.10 | ||
| Green | John Milnes | 1,444 | 4.63 | +0.19 | 2,855 | 8.96 | +3.68 | ||
| NZ First | Ian Brougham | 1,043 | 3.34 | +3.34 | 3,035 | 9.53 | +4.39 | ||
| ACT | Alan Daniel Davidson | 135 | 0.43 | -0.56 | 345 | 1.08 | -1.99 | ||
| Democrats | Heather Marion Smith | 121 | 0.39 | -0.28 | 47 | 0.15 | -0.07 | ||
| Conservative | 1,030 | 3.23 | -+3.23 | ||||||
| Māori | 225 | 0.71 | -0.29 | ||||||
| Legalise Cannabis | 176 | 0.55 | +0.21 | ||||||
| United Future | 143 | 0.45 | -0.20 | ||||||
| Mana | 75 | 0.24 | +0.24 | ||||||
| Libertarianz | 22 | 0.07 | +0.02 | ||||||
| Alliance | 21 | 0.07 | -0.02 | ||||||
| Informal votes | 616 | 235 | |||||||
| Total Valid votes | 31,183 | 31,858 | |||||||
| National hold | Majority | 5,046 | 16.18 | -2.51 | |||||
Electorate (as at 11 November 2011): 43,350[18]
2008 election
| 2008 general election: Whanganui[19] | |||||||||
|---|---|---|---|---|---|---|---|---|---|
| Notes: |
Blue background denotes the winner of the electorate vote.
| ||||||||
| Party | Candidate | Votes | % | ±% | Party votes | % | ±% | ||
| National | 19,072 | 56.30 | 15,869 | 46.30 | |||||
| Labour | Hamish McDouall | 12,739 | 37.61 | 12,170 | 35.51 | ||||
| Green | John Milnes | 1,503 | 4.44 | 1,809 | 5.28 | ||||
| ACT | Alan Davidson | 336 | 0.99 | 1,052 | 3.07 | ||||
| Democrats | Heather Marion Smith | 225 | 0.66 | 73 | 0.21 | ||||
| NZ First | 1,761 | 5.14 | |||||||
| Māori | 342 | 1.00 | |||||||
| Progressive | 253 | 0.74 | |||||||
| Bill and Ben | 249 | 0.73 | |||||||
| United Future | 224 | 0.65 | |||||||
| Kiwi | 186 | 0.54 | |||||||
| Legalise Cannabis | 116 | 0.34 | |||||||
| Family Party | 91 | 0.27 | |||||||
| Alliance | 28 | 0.08 | |||||||
| Libertarianz | 18 | 0.05 | |||||||
| Workers Party | 16 | 0.05 | |||||||
| Pacific | 10 | 0.03 | |||||||
| RONZ | 3 | 0.01 | |||||||
| RAM | 2 | 0.01 | |||||||
| Informal votes | 304 | 162 | |||||||
| Total Valid votes | 33,875 | 34,272 | |||||||
| National hold | Majority | 6,333 | |||||||
2005 election
| 2005 general election: Whanganui[20] | |||||||||
|---|---|---|---|---|---|---|---|---|---|
| Notes: |
Blue background denotes the winner of the electorate vote.
| ||||||||
| Party | Candidate | Votes | % | ±% | Party votes | % | ±% | ||
| National | Chester Borrows | 15,846 | 49.28 | +9.70 | 13,417 | 41.13 | |||
| Labour | 13,444 | 41.81 | -4.56 | 13,045 | 39.99 | ||||
| Green | John Milnes | 1,171 | 3.64 | 1,466 | 4.49 | ||||
| United Future | David Ball | 502 | 1.56 | 885 | 2.71 | ||||
| Māori | Aaron Makutu | 429 | 1.33 | 265 | 0.841 | ||||
| Progressive | Debbie Lucas | 371 | 1.15 | 448 | 1.37 | ||||
| One NZ | Ian Brougham | 214 | 0.67 | 52 | 0.16 | ||||
| Democrats | Malcolm Murchie | 175 | 0.54 | 68 | 0.21 | ||||
| NZ First | 2,185 | 6.70 | |||||||
| ACT | 296 | 0.91 | |||||||
| Destiny | 282 | 0.86 | |||||||
| Legalise Cannabis | 68 | 0.21 | |||||||
| Christian Heritage | 62 | 0.19 | |||||||
| Alliance | 31 | 0.10 | |||||||
| 99 MP | 18 | 0.06 | |||||||
| Libertarianz | 16 | 0.05 | |||||||
| Family Rights | 7 | 0.02 | |||||||
| RONZ | 7 | 0.02 | |||||||
| Direct Democracy | 6 | 0.02 | |||||||
| Informal votes | 376 | 144 | |||||||
| National gain from Labour | Majority | 2,402 | 7.47 | +14.26 | |||||
1999 election
Refer to Candidates in the New Zealand general election 1999 by electorate#Whanganui for a list of candidates.
1993 election
| Party | Candidate | Votes | % | ± | |
|---|---|---|---|---|---|
| Labour | Jill Pettis | 7,399 | 36.6 | +5.6 | |
| National | Gael Donoghue | 4,028 | 19.9 | ||
| NZ First | Terry Heffernan | 3,621 | 17.9 | ||
| Independent | Cam Campion | 2,525 | 12.4 | -20.6 | |
| Alliance | F Frederiske | 2,253 | 11.1 | ||
| Christian Heritage | J Rush | 378 | 1.8 | ||
| Majority | 3,371 | 16.6 | |||
| Turnout | 20,204 | ||||
1990 election
| Party | Candidate | Votes | % | ± | |
|---|---|---|---|---|---|
| National | Cam Campion | 6,751 | 33.0 | ||
| Labour | Jill Pettis | 6,342 | 31.0 | ||
| Democrats | Terry Heffernan | 5,983 | 29.2 | -5.7 | |
| Green | T Sarten | 762 | 3.7 | ||
| NewLabour | M Blakely | 446 | 2.1 | ||
| Social Credit | G Butler | 123 | 0.6 | ||
| Independent | C Fackney | 22 | 0.1 | ||
| Majority | 409 | 2.0 | |||
| Turnout | 20,429 | ||||
1987 election
| Party | Candidate | Votes | % | ± | |
|---|---|---|---|---|---|
| Labour | Russell Marshall | 7,548 | 36.0 | -10.7 | |
| Democrats | Terry Heffernan | 7,300 | 34.9 | +5.8 | |
| National | A R Anderson | 6,089 | 29.1 | ||
| Majority | 248 | 1.1 | -16.5 | ||
| Turnout | 22,925 | 92.7 | -1.4 | ||
1984 election
| Party | Candidate | Votes | % | ± | |
|---|---|---|---|---|---|
| Labour | Russell Marshall | 10,391 | 46.7 | +6.3 | |
| Social Credit | Terry Heffernan | 6,473 | 29.1 | -3.5 | |
| National | Sue Westwood | 4,579 | 20.6 | ||
| NZ Party | Ian David Harrex | 751 | 3.4 | ||
| Independent | T L Sullivan | 47 | 0.2 | ||
| Majority | 3,918 | 17.6 | +9.8 | ||
| Turnout | 23,965 | 94.1 | +3.6 | ||
1981 election
| Party | Candidate | Votes | % | ± | |
|---|---|---|---|---|---|
| Labour | Russell Marshall | 8,572 | 40.4 | -6.4 | |
| Social Credit | Terry Heffernan | 6,904 | 32.6 | ||
| National | Jennifer Tolhurst | 5,719 | 27.0 | ||
| Majority | 1,668 | 7.8 | -7.2 | ||
| Turnout | 23,477 | 90.5 | +15.5 | ||
1978 election
| Party | Candidate | Votes | % | ± | |
|---|---|---|---|---|---|
| Labour | Russell Marshall | 9,703 | 46.8 | +0.2 | |
| National | J G Rowan | 6,601 | 31.8 | -8.6 | |
| Social Credit | Oliver Marks | 3,956 | 19.1 | +9.4 | |
| Values | R W Holmes | 449 | 2.2 | ||
| Independent | T L Sullivan | 34 | 0.1 | ±0.0 | |
| Majority | 3,102 | 15.0 | +8.8 | ||
| Turnout | 27,741 | 75.0 | -18.3 | ||
1975 election
| Party | Candidate | Votes | % | ± | |
|---|---|---|---|---|---|
| Labour | Russell Marshall | 9,313 | 46.6 | -7.8 | |
| National | J G Rowan | 8,069 | 40.4 | ||
| Social Credit | Oliver Marks | 1,937 | 9.7 | ||
| Values | Roger Angus | 541 | 2.7 | ||
| Christian Democratic | Tom Fouhy | 100 | 0.5 | ||
| Independent | T L Sullivan | 16 | 0.1 | -0.2 | |
| Majority | 1,244 | 6.2 | -9.5 | ||
| Turnout | 22,689 | 88.3 | -4.4 | ||
1972 election
| Party | Candidate | Votes | % | ± | |
|---|---|---|---|---|---|
| Labour | Russell Marshall | 9,987 | 54.4 | ||
| National | Bill Tolhurst | 7,108 | 38.7 | -9.3 | |
| Social Credit | J S Humphreys | 1,168 | 6.3 | -2.8 | |
| New Democratic | R A Dowdie | 53 | 0.3 | ||
| Independent | T L Sullivan | 50 | 0.3 | +0.1 | |
| Majority | 2,879 | 15.7 | |||
| Turnout | 19,944 | 92.7 | +0.9 | ||
1969 election
| Party | Candidate | Votes | % | ± | |
|---|---|---|---|---|---|
| National | Bill Tolhurst | 8,233 | 48.0 | +6.1 | |
| Labour | George Spooner | 7,274 | 42.5 | +.06 | |
| Social Credit | J S Humphreys | 1,557 | 9.1 | ||
| Independent | D M Lewis | 40 | 0.2 | ||
| Independent | T L Sullivan | 32 | 0.2 | ||
| Majority | 959 | 5.5 | |||
| Turnout | 18,755 | 91.8 | +1.3 | ||
1966 election
| Party | Candidate | Votes | % | ± | |
|---|---|---|---|---|---|
| Labour | George Spooner | 6,499 | 41.9 | -5.4 | |
| National | John Grace | 5,591 | 36.0 | -1.6 | |
| Social Credit | Percival John Dempsey | 3,206 | 20.6 | +4.5 | |
| Christian Democratic | D G Tumery | 233 | 1.5 | ||
| Majority | 908 | 5.9 | -2.8 | ||
| Turnout | 17,249 | 90.5 | -2.5 | ||
1963 election
| Party | Candidate | Votes | % | ± | |
|---|---|---|---|---|---|
| Labour | George Spooner | 7,430 | 46.3 | +6.1 | |
| National | John Grace | 6,033 | 37.6 | ||
| Social Credit | Percival John Dempsey | 2,593 | 16.1 | ||
| Majority | 1,397 | 8.7 | +7.6 | ||
| Turnout | 17,258 | 93.4 | |||
1960 election
| Party | Candidate | Votes | % | ± | |
|---|---|---|---|---|---|
| Labour | George Spooner | 6,071 | 40.2 | ||
| National | E J Crotty | 5,911 | 39.1 | ||
| Social Credit | Roly Marks | 3,132 | 20.7 | -1.7 | |
| Majority | 160 | 1.1 | |||
| Turnout | 16,335 | 93.0 | -1.9 | ||
1957 election
| Party | Candidate | Votes | % | ± | |
|---|---|---|---|---|---|
| Labour | Joe Cotterill | 6,550 | 43.5 | +5.6 | |
| National | A K MacLean | 5,131 | 34.1 | ||
| Social Credit | Roly Marks | 3,378 | 22.4 | -4.0 | |
| Majority | 1,419 | 9.4 | +7.2 | ||
| Turnout | 15,911 | 94.9 | +1.8 | ||
1954 election
| Party | Candidate | Votes | % | ± | |
|---|---|---|---|---|---|
| Labour | Joe Cotterill | 5,115 | 37.9 | -12.9 | |
| National | J S Rumbold | 4,810 | 35.7 | ||
| Social Credit | Roly Marks | 3,378 | 26.4 | ||
| Majority | 305 | 2.2 | +0.6 | ||
| Turnout | 14,562 | 93.1 | +4.7 | ||
1951 election
| Party | Candidate | Votes | % | ± | |
|---|---|---|---|---|---|
| Labour | Joe Cotterill | 6,779 | 50.8 | -2.9 | |
| National | E V O'Keefe | 6,553 | 49.2 | +2.9 | |
| Majority | 226 | 1.6 | -5.8 | ||
| Turnout | 14,993 | 89.2 | -3.1 | ||
1949 election
| Party | Candidate | Votes | % | ± | |
|---|---|---|---|---|---|
| Labour | Joe Cotterill | 7,336 | 53.7 | -3.4 | |
| National | E V O'Keefe | 6,317 | 46.3 | ||
| Majority | 1,019 | 7.4 | -6.6 | ||
| Turnout | 14,863 | 92.3 | -0.7 | ||
1946 election
| Party | Candidate | Votes | % | ± | |
|---|---|---|---|---|---|
| Labour | Joe Cotterill | 7,833 | 57.0 | ||
| National | Eric Merewether | 5,899 | 43.0 | ||
| Majority | 1,934 | 14.0 | |||
| Turnout | 14,730 | 93.0 | |||
1943 election
| Party | Candidate | Votes | % | ± | |
|---|---|---|---|---|---|
| Labour | Joe Cotterill | 6,691 | 49.05 | -15.34 | |
| National | E J Kirk | 4,254 | 31.18 | ||
| Real Democracy | Roly Marks | 1,722 | 12.62 | ||
| Democratic Labour | S Duffy | 832 | 6.09 | ||
| Informal votes | 142 | 1.04 | +0.58 | ||
| Majority | 2,437 | 17.86 | +11.38 | ||
| Turnout | 13,641 | 96.69 | +1.95 | ||
| Registered electors | 14,107 | ||||
1938 election
| Party | Candidate | Votes | % | ± | |
|---|---|---|---|---|---|
| Labour | Joe Cotterill | 8,630 | 64.39 | +18.09 | |
| National | Bill Veitch | 4,710 | 35.14 | +3.70 | |
| Informal votes | 62 | 0.46 | -0.20 | ||
| Majority | 3,920 | 29.24 | +14.38 | ||
| Turnout | 13,402 | 94.74 | |||
| Registered electors | 14,145 | ||||
1935 election
| Party | Candidate | Votes | % | ± | |
|---|---|---|---|---|---|
| Labour | Joe Cotterill | 4,887 | 46.66 | ||
| Democrat | Bill Veitch | 3,318 | 31.68 | -21.39 | |
| Reform | Norman Rhind Bain | 1,754 | 16.74 | ||
| Independent Liberal | James Thomas Hogan | 524 | 5.00 | ||
| Informal votes | 61 | 0.58 | +0.06 | ||
| Majority | 1,569 | 14.98 | |||
| Turnout | 10,473 | 91.59 | +8.41 | ||
| Registered electors | 11,434 | ||||
1931 election
| Party | Candidate | Votes | % | ± | |
|---|---|---|---|---|---|
| United | Bill Veitch | 5,096 | 53.07 | +5.52 | |
| Labour | Bill Rogers | 4,506 | 46.93 | +19.79 | |
| Majority | 590 | 6.14 | -14.26 | ||
| Informal votes | 50 | 0.52 | -0.05 | ||
| Turnout | 9,652 | 83.18 | -4.55 | ||
| Registered electors | 11,604 | ||||
1928 election
| Party | Candidate | Votes | % | ± | |
|---|---|---|---|---|---|
| United | Bill Veitch | 4,979 | 47.55 | +4.28 | |
| Labour | Bill Rogers | 2,842 | 27.14 | +4.80 | |
| Reform | N. G. Lewis | 2,650 | 25.31 | ||
| Majority | 2,137 | 20.41 | +11.52 | ||
| Informal votes | 60 | 0.57 | -0.11 | ||
| Turnout | 10,531 | 87.73 | -4.09 | ||
| Registered electors | 12,004 | ||||
1925 election
| Party | Candidate | Votes | % | ± | |
|---|---|---|---|---|---|
| Liberal | Bill Veitch | 4,339 | 43.27 | ||
| Reform | John Coull[34] | 3,448 | 34.39 | ||
| Labour | Bill Rogers | 2,240 | 22.34 | ||
| Majority | 891 | 8.89 | |||
| Informal votes | 69 | 0.68 | |||
| Turnout | 10,096 | 91.82 | |||
| Registered electors | 10,996 | ||||
1908 election
| Party | Candidate | Votes | % | ± | |
|---|---|---|---|---|---|
| Liberal–Labour | James Thomas Hogan | 3,041 | 45.85 | ||
| Conservative | George Hutchison | 1,882 | 28.37 | ||
| Independent | Charles Mackay | 1,710 | 25.78 | ||
| Majority | 1,159 | 17.47 | |||
| Turnout | 6,633 | 78.06 | |||
| Registered electors | 8,497 | ||||
| Party | Candidate | Votes | % | ± | |
|---|---|---|---|---|---|
| Liberal–Labour | James Thomas Hogan | 3,602 | 54.30 | +8.46 | |
| Conservative | George Hutchison | 2,860 | 43.12 | 14.74 | |
| Majority | 742 | 11.19 | -6.29 | ||
| Turnout | 6,462 | 76.05 | -2.01 | ||
| Registered electors | 8,497 | ||||
1899 election
| Party | Candidate | Votes | % | ± | |
|---|---|---|---|---|---|
| Liberal | Archibald Willis | 2,878 | 55.83 | ||
| Conservative | Gilbert Carson | 2,169 | 42.08 | ||
| Independent Liberal | John Michael Murphy | 108 | 2.10 | ||
| Majority | 709 | 13.75 | |||
| Turnout | 5,155 | 80.53 | |||
| Registered electors | 6,401 | ||||
1893 by-election
| Party | Candidate | Votes | % | ± | |
|---|---|---|---|---|---|
| Liberal | Archibald Willis | 1,031 | 62.37 | ||
| Conservative | Gilbert Carson | 622 | 37.62 | ||
| Majority | 409 | 24.74 | |||
| Turnout | 1,653 | ||||
1890 election
| Party | Candidate | Votes | % | ± | |
|---|---|---|---|---|---|
| Liberal | John Ballance | 808 | 50.85 | -15.95 | |
| Conservative | Gilbert Carson | 781 | 49.15 | +15.95 | |
| Majority | 27 | 1.69 | -31.9 | ||
| Turnout | 1,589 | 75.20 | -4.19 | ||
| Registered electors | 2,113 | ||||
1887 election
| Party | Candidate | Votes | % | ± | |
|---|---|---|---|---|---|
| Independent | John Ballance | 865 | 66.80 | ||
| Independent | Gilbert Carson | 430 | 33.20 | ||
| Majority | 435 | 33.59 | |||
| Turnout | 1,295 | 79.39 | |||
| Registered electors | 1,631 | ||||
1884 election
| Party | Candidate | Votes | % | ± | |
|---|---|---|---|---|---|
| Independent | John Ballance | 541 | 60.11 | +10.36 | |
| Independent | George Hutchison | 205 | 22.77 | ||
| Independent | William Hogg Watt | 154 | 17.11 | -33.14 | |
| Majority | 336 | 37.33 | 2.69 | ||
| Turnout | 900 | 66.86 | |||
| Registered electors | 1,346 | ||||
1881 election
| Party | Candidate | Votes | % | ± | |
|---|---|---|---|---|---|
| Independent | William Hogg Watt | 397 | 50.25 | ||
| Independent | John Ballance | 393 | 49.75 | -18.28 | |
| Majority | 4 | 0.50 | |||
| Turnout | 790 | 64.17 | +4.44 | ||
| Registered electors | 1,231 | ||||
1879 election
| Party | Candidate | Votes | % | ± | |
|---|---|---|---|---|---|
| Independent | John Bryce | 560 | 69.65 | ||
| Independent | John Ballance | 547 | 68.03 | ||
| Independent | Sir William Fox | 501 | 62.31 | ||
| Majority | 46 | 5.72 | |||
| Turnout | 804 | 59.73 | |||
| Registered electors | 1,346 | ||||
1876 by-election
| Party | Candidate | Votes | % | ± | |
|---|---|---|---|---|---|
| Independent | William Fox | 256 | 60.81 | ||
| Independent | John Morgan | 165 | 39.19 | ||
| Turnout | 421 | ||||
| Majority | 91 | 21.62 | |||
1867 by-election
| Party | Candidate | Votes | % | ± | |
|---|---|---|---|---|---|
| Independent | Henry Shafto Harrison | 143 | 57.66 | ||
| Independent | William Hutchison | 105 | 42.34 | ||
| Turnout | 248 | ||||
| Majority | 38 | 15.32 | |||
Notes
- 2017 Mana Party swing is relative to the votes for Internet-Mana in 2014; it shared a party list with the Internet Party in the 2014 election
- 2017 Internet Party swing is relative to the votes for Internet-Mana in 2014; it shared a party list with Mana Party in the 2014 election
References
- McRobie 1989, pp. 32f.
- Scholefield 1925, p. 100.
- Wilson 1985, p. 203.
- "The Wanganui Election". Wellington Independent. XXI (2331). 6 March 1866. p. 4. Retrieved 19 August 2010.
- Scholefield 1925, p. 81.
- Scholefield 1925, pp. 142-143.
- Scholefield 1925, p. 94.
- Scholefield 1925, p. 77.
- Scholefield 1925, p. 145.
- Scholefield 1925, p. 147.
- Scholefield 1925, p. 84.
- Scholefield 1925, p. 103.
- "Hon Chester Borrows". New Zealand Parliament. Retrieved 18 March 2012.
- Moir, Jo (29 November 2016). "In hindsight National's Chester Borrows says he "could have had more fights" as an MP". Stuff.co.nz. Retrieved 27 September 2017.
- "Official Count Results -- Whanganui". Wellington: New Zealand Electoral Commission. Retrieved 23 December 2017.
- 2014 election results
- 2011 election results
- "Enrolment statistics". Electoral Commission. 11 November 2011. Retrieved 17 November 2011.
- 2008 election results
- 2005 election results
- Part 1: Votes recorded at each polling place (Technical report). New Zealand Chief Electoral Office. 1993.
- Part 1: Votes recorded at each polling place (Technical report). New Zealand Chief Electoral Office. 1990.
- Norton 1988, pp. 385.
- Norton 1988, pp. 384.
- "The New Zealand Official Year-Book, 1951–52". Statistics New Zealand. Retrieved 19 November 2012.
- "The General Election, 1949". National Library. 1950. pp. 1–5, 8. Retrieved 3 January 2014.
- "The General Election, 1946". National Library. 1947. pp. 1–11, 14. Retrieved 1 January 2014.
- "The General Election, 1943". National Library. 1944. p. 11. Retrieved 28 March 2014.
- "The General Election, 1938". National Library. 1939. pp. 1–6. Retrieved 8 February 2012.
- The General Election, 1935. Government Printer. 1936. Retrieved 2 November 2014.
- The General Election, 1931. Government Printer. 1932. p. 5. Retrieved 2 November 2014.
- The General Election, 1928. Government Printer. 1929. p. 5. Retrieved 29 November 2014.
- The General Election, 1925. Government Printer. 1926. p. 3. Retrieved 20 November 2014.
- "Local and General News". The New Zealand Herald. LXII (19163). 31 October 1925. p. 12. Retrieved 28 November 2014.
- AtoJs 1908 election 1909, p. 30.
- AtoJs 1908 election 1909, p. 11.
- "The General Election, 1899". Wellington: Appendix to the Journals of the House of Representatives. 19 June 1900. p. 3. Retrieved 12 March 2014.
- "Electoral District of Wanganui". Wanganui Chronicle. XLIII (1500). 5 December 1899. p. 3. Retrieved 13 March 2014.
- "Wanganui Election". Woodville Examiner. VIII (2054). 12 June 1893. p. 3. Retrieved 1 April 2016.
- "The General Election, 1890". National Library. 1891. Retrieved 25 February 2012.
- "The General Election, 1887". National Library. 1887. Retrieved 25 February 2012.
- Cooper, G. S. (1884). The General Election, 1884. National Library. pp. 1–3. Retrieved 24 December 2014.
- Cooper, G. S. (1882). Votes Recorded for Each Candidate. Government Printer. Retrieved 24 October 2015.CS1 maint: ref=harv (link)
- "Wanganui Election". Wanganui Herald. XII (9507). 6 September 1879. p. 2. Retrieved 2 November 2016.
- "Local and General". The Oamaru Mail. 3 October 1876.
- "Wanganui". Wellington Independent. 4 May 1867.
Bibliography
- Mansfield, F. W. (1909). The General Election, 1908. National Library. Retrieved 25 April 2015.
- Scholefield, Guy (1925) [First ed. published 1913]. New Zealand Parliamentary Record (2nd ed.). Wellington: Govt. Printer.CS1 maint: ref=harv (link)
- Wilson, James Oakley (1985) [First ed. published 1913]. New Zealand Parliamentary Record, 1840–1984 (4th ed.). Wellington: V.R. Ward, Govt. Printer. OCLC 154283103.CS1 maint: ref=harv (link)
- Norton, Clifford (1988). New Zealand Parliamentary Election Results 1946–1987: Occasional Publications No 1, Department of Political Science. Wellington: Victoria University of Wellington. ISBN 0-475-11200-8.CS1 maint: ref=harv (link)
External links
- Electorate Profile Parliamentary Library