Selwyn (New Zealand electorate)
Selwyn is a current electorate in the New Zealand House of Representatives, composed of towns on the outskirts of Christchurch city. The electorate was first formed for the 1866 election and has been abolished three times during its history. It was last re-established for the 2008 election and has since been held by Amy Adams for the National Party.
Region and population centres
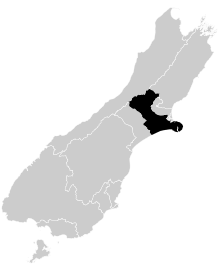
The electorate is mainly rural, stretching from the Southern Alps to the Banks Peninsula, its borders broadly defined by the Rakaia River in the south and the Waimakariri River in the north. Major towns include Rolleston, Lincoln, Prebbleton, and Darfield, with smaller towns such as Tai Tapu, Leeston and Dunsandel. The electorate also includes parts of Christchurch city's territorial authority.
History
Existence and changes to area
An electorate called Selwyn existed between 1866 and 1919. A Selwyn electorate also existed between 1946 and 1972 and again from 1978 until it was absorbed by Rakaia for the first MMP election in 1996.[1] The latest version of the Selwyn electorate was created for the 2008 election. This followed a review of electoral boundaries conducted after the 2006 Census, because of a general northwards population movement in the South Island. Even though the number of South Island electorates is fixed, the decline in the population of electorates from Rakaia south has resulted in the boundaries of electorates from Invercargill north to Rakaia shifting further northwards.
Due to the rapid growth of Selwyn relative to Christchurch (which lost population after the earthquakes), the 2013 redistribution had Selwyn losing Halswell and Westmorland to Port Hills and Harewood to Waimakariri while regaining the towns of Rakaia and Chertsey back from Rangitata.[2] Data from the 2018 census showed Selywn's population had continued to grow – it had the largest discrepancy of any electorate – and so the electorate would need to lose further area for the 2020 boundaries.[3] It shed an area around Hornby South to Wigram, the Banks Peninsula to the recreated Banks Peninsula, the area west of the Rakaia to Rangitata, and an area around Christchurch Airport to Ilam.[4]
Voting history
The dominant topic for the 1875 election was the abolition of the Provinces. William Reeves, the incumbent, favoured the retention of the provincial system of government, while his opponent, Cecil Fitzroy, was an abolitionist. Fitzroy, who was 31 years old and 20 years Reeves' junior, narrowly won the election.[5][6] Edward Lee acted as returning officer for the election.[7]
In the 1879 election, John Hall was returned unopposed.[8] In the 1881 election, Hall beat R. Lockhead by 467 to 169 votes.[9][10]
In the 1890 election, Alfred Saunders, Thomas Hamilton Anson, and William Jerrington Popple received 536, 485 and 237 votes, respectively.[11]
The electorate is one of the National Party's safest seats. National have held the seat, whenever it has existed since it was first recreated in 1946. The incumbent MP is Amy Adams, who has received between 60% and 70% of the electorate vote in the four elections since its latest recreation in 2008. In 2011, the candidate for the other major New Zealand party, Labour, received less than 11% of the electoral vote and came third, behind the Greens in the 2011 election. In that election, the only polling booths where Adams didn't receive the most votes were Arthur's Pass and Diamond Harbour.
Members of Parliament
Key:
Independent Conservative Reform Liberal National Green
| Election | Winner | |
|---|---|---|
| 1866 election | Edward Stevens | |
| 1871 election | William Reeves | |
| 1875 election | Cecil Fitzroy | |
| 1879 election | John Hall | |
| 1881 election | ||
| 1883 by-election | Edward Lee | |
| 1884 by-election | Edward Wakefield | |
| 1884 election | ||
| 1887 election | John Hall | |
| 1890 election | Alfred Saunders | |
| 1893 election | ||
| 1896 election | Cathcart Wason | |
| 1899 election | Charles Hardy | |
| 1902 election | ||
| 1905 election | ||
| 1908 election | ||
| 1911 election | William Dickie | |
| 1914 election | ||
| (Electorate abolished 1919–1946) | ||
| 1946 election | John McAlpine | |
| 1949 election | ||
| 1951 election | ||
| 1954 election | ||
| 1957 election | ||
| 1960 election | ||
| 1963 election | ||
| 1966 election | Colin McLachlan | |
| 1969 election | ||
| (Electorate abolished 1972–1978, see Rakaia) | ||
| 1978 election | Colin McLachlan | |
| 1981 election | Ruth Richardson | |
| 1984 election | ||
| 1987 election | ||
| 1990 election | ||
| 1993 election | ||
| 1994 by-election | David Carter | |
| (Electorate abolished 1996–2008, see Banks Peninsula & Rakaia) | ||
| 2008 election | Amy Adams | |
| 2011 election | ||
| 2014 election | ||
| 2017 election | ||
List MPs
Members of Parliament elected from party lists in elections where that person also unsuccessfully contested the Selwyn electorate. Unless otherwise stated, all MPs terms began and ended at general elections.
| Election | Winner | |
|---|---|---|
| 2011 election | Eugenie Sage | |
Election results
2017 election
| 2017 general election: Selwyn[12] | |||||||||
|---|---|---|---|---|---|---|---|---|---|
| Notes: |
Blue background denotes the winner of the electorate vote.
| ||||||||
| Party | Candidate | Votes | % | ±% | Party votes | % | ±% | ||
| National | 28,686 | 65.86 | -4.11 | 26,003 | 59.00 | -4.58 | |||
| Labour | Tony Condon | 9,047 | 20.77 | +9.22 | 11,508 | 26.11 | +13.14 | ||
| Green | Chrys Horn | 2,772 | 6.36 | -5.19 | 2,339 | 5.30 | -5.60 | ||
| NZ First | Lindy Michelle Palmer | 1,345 | 3.08 | -2.15 | 2,440 | 5.53 | -1.42 | ||
| Opportunities | Nicky Snoyink | 1,270 | 2.91 | — | 1,131 | 2.56 | — | ||
| ACT | Brian Davidson | 198 | 0.45 | +0.21 | 201 | 0.45 | +0.06 | ||
| Conservative | 87 | 0.2 | -3.29 | ||||||
| Legalise Cannabis | 79 | 0.2 | -0.13 | ||||||
| Māori | 75 | 0.17 | -0.14 | ||||||
| Ban 1080 | 41 | 0.09 | -0.13 | ||||||
| Outdoors | 36 | 0.08 | — | ||||||
| United Future | 32 | 0.07 | -0.17 | ||||||
| People's Party | 11 | 0.02 | — | ||||||
| Internet | 6 | 0.01 | -0.5[lower-alpha 1] | ||||||
| Democrats | 3 | 0.01 | -0.02 | ||||||
| Mana | 2 | 0 | -0.51[lower-alpha 2] | ||||||
| Informal votes | 235 | 74 | |||||||
| Total Valid votes | 43,553 | 44,068 | |||||||
| National hold | Majority | 19,639 | 45.09 | -13.33 | |||||
2014 election
| 2014 general election: Selwyn[13] | |||||||||
|---|---|---|---|---|---|---|---|---|---|
| Notes: |
Blue background denotes the winner of the electorate vote.
| ||||||||
| Party | Candidate | Votes | % | ±% | Party votes | % | ±% | ||
| National | 24,625 | 69.97 | +0.83 | 22,809 | 63.58 | +0.93 | |||
| Green | Peter Selwyn Hill | 4,064 | 11.55 | +1.37 | 3,910 | 10.90 | -0.54 | ||
| Labour | Gordon John Dickson | 3,835 | 10.90 | -4.37 | 4,654 | 12.97 | -3.15 | ||
| NZ First | Bill Woods | 1,841 | 5.23 | +1.69 | 2,494 | 6.95 | +2.20 | ||
| Conservative | Roger Clibborn | 619 | 1.76 | -0.12 | 1,253 | 3.49 | +1.03 | ||
| Māori | Sheryl Gardyne | 129 | 0.37 | +0.37 | 111 | 0.31 | -0.06 | ||
| ACT | Paul Gilbert | 83 | 0.24 | +0.24 | 139 | 0.39 | -0.52 | ||
| Internet Mana | 184 | 0.51 | +0.37 | ||||||
| Legalise Cannabis | 120 | 0.33 | +0.00 | ||||||
| United Future | 87 | 0.24 | -0.45 | ||||||
| Ban 1080 | 78 | 0.22 | +0.22 | ||||||
| Civilian | 16 | 0.04 | +0.04 | ||||||
| Democrats | 10 | 0.03 | -0.01 | ||||||
| Focus | 5 | 0.01 | +0.01 | ||||||
| Independent Coalition | 5 | 0.01 | +0.01 | ||||||
| Informal votes | 182 | 65 | |||||||
| Total Valid votes | 35,196 | 35,875 | |||||||
| National hold | Majority | 20,561 | 58.42 | +4.54 | |||||
2011 election
| 2011 general election: Selwyn[14] | |||||||||
|---|---|---|---|---|---|---|---|---|---|
| Notes: |
Blue background denotes the winner of the electorate vote.
| ||||||||
| Party | Candidate | Votes | % | ±% | Party votes | % | ±% | ||
| National | 24,963 | 69.14 | +8.65 | 23,086 | 62.65 | +7.74 | |||
| Labour | Jo McLean | 5,512 | 15.27 | -14.54 | 5,942 | 16.12 | -9.49 | ||
| Green | Eugenie Sage | 3,674 | 10.18 | +10.18 | 4,215 | 11.44 | +3.91 | ||
| NZ First | Bill Woods | 1,277 | 3.54 | +3.54 | 1,750 | 4.75 | +1.71 | ||
| Conservative | Wilton Gray | 677 | 1.88 | +1.88 | 906 | 2.46 | +2.46 | ||
| ACT | 336 | 0.91 | -2.77 | ||||||
| United Future | 256 | 0.69 | -0.45 | ||||||
| Māori | 137 | 0.37 | -0.04 | ||||||
| Legalise Cannabis | 123 | 0.33 | +0.07 | ||||||
| Mana | 52 | 0.14 | +0.14 | ||||||
| Alliance | 24 | 0.07 | +0.02 | ||||||
| Democrats | 13 | 0.04 | +0.02 | ||||||
| Libertarianz | 11 | 0.03 | +0.01 | ||||||
| Informal votes | 526 | 192 | |||||||
| Total Valid votes | 36,103 | 36,851 | |||||||
| National hold | Majority | 19,451 | 53.88 | +23.20 | |||||
Electorate (as at 26 November 2011): 46,937[15]
2008 election
| 2008 general election: Selwyn[16] | |||||||||
|---|---|---|---|---|---|---|---|---|---|
| Notes: |
Blue background denotes the winner of the electorate vote.
| ||||||||
| Party | Candidate | Votes | % | ±% | Party votes | % | ±% | ||
| National | Amy Adams | 21,836 | 60.49 | 20,141 | 54.91 | ||||
| Labour | David Coates | 10,761 | 29.81 | 9,395 | 25.61 | ||||
| Progressive | Philippa Main | 1,316 | 3.65 | 672 | 1.83 | ||||
| Independent | Bill Woods | 603 | 1.67 | ||||||
| ACT | Ivor Watson | 539 | 1.49 | 1,350 | 3.68 | ||||
| Family Party | Samuel Dennis | 493 | 1.37 | 141 | 0.38 | ||||
| Kiwi | Eleanor Williamson | 296 | 0.82 | 191 | 0.52 | ||||
| United Future | Victoria Norman | 253 | 0.70 | 421 | 1.15 | ||||
| Green | 2,761 | 7.53 | |||||||
| NZ First | 1,115 | 3.04 | |||||||
| Bill and Ben | 201 | 0.55 | |||||||
| Māori | 151 | 0.41 | |||||||
| Legalise Cannabis | 97 | 0.26 | |||||||
| Alliance | 17 | 0.05 | |||||||
| Libertarianz | 8 | 0.02 | |||||||
| Democrats | 7 | 0.02 | |||||||
| Workers Party | 5 | 0.01 | |||||||
| RAM | 3 | 0.01 | |||||||
| Pacific | 2 | 0.01 | |||||||
| RONZ | 1 | 0.00 | |||||||
| Informal votes | 409 | 155 | |||||||
| Total Valid votes | 36,097 | 36,679 | |||||||
| National win new seat | Majority | 11,075 | 30.68 | ||||||
1994 by-election
A by-election was held following the resignation of Ruth Richardson.[17]
| Party | Candidate | Votes | % | ± | |
|---|---|---|---|---|---|
| National | David Carter | 8,906 | 42.32 | ||
| Alliance | John Wright | 8,488 | 40.33 | ||
| Labour | Marian Hobbs | 2,173 | 10.33 | ||
| NZ First | Tim Shadbolt | 1,165 | 5.54 | ||
| Christian Heritage | Rosemary Francis | 182 | 0.86 | ||
| NORML | Warren Bryson | 39 | 0.19 | ||
| Kiwis Against Further Immigration | Bruce Annan | 29 | 0.14 | ||
| McGillicuddy Serious | Tim Owens | 26 | 0.12 | ||
| Natural Law | Warwick Jones | 22 | 0.10 | ||
| NZ Coalition | Kieron Daok | 10 | 0.05 | ||
| Christ's Ambassadors Union | Victor Bryer | 2 | 0.01 | ||
| Majority | 418 | 1.99 | |||
| Turnout | 21,042 | ||||
1987 election
| Party | Candidate | Votes | % | ± | |
|---|---|---|---|---|---|
| National | Ruth Richardson | 10,720 | 54.9 | +4.9 | |
| Labour | Bill Woods | 7,758 | 39.8 | +8.8 | |
| Democrats | J R E Palmer | 640 | 3.3 | -1.5 | |
| Independent National | G P Dennis | 194 | 1.0 | +1.0 | |
| Wizard Party | C I Walker | 177 | 1.0 | +1.0 | |
| Majority | 2,962 | 16.1 | |||
| Turnout | 89.7 | ||||
| Registered electors | 22,160 | ||||
1984 election
| Party | Candidate | Votes | % | ± | |
|---|---|---|---|---|---|
| National | Ruth Richardson | 10,076 | 50.0 | +2.6 | |
| Labour | C E Manning | 6,247 | 31.0 | -5.8 | |
| NZ Party | M R MacDonald | 2,859 | 14.2 | +14.2 | |
| Social Credit | J D Gribben | 977 | 4.8 | -11.0 | |
| Majority | 3,829 | 19.0 | |||
| Turnout | 94.8 | ||||
| Registered electors | 20,455 | ||||
1981 election
| Party | Candidate | Votes | % | ± | |
|---|---|---|---|---|---|
| National | Ruth Richardson | 9,496 | 47.4 | +2.1 | |
| Labour | Bill Woods | 7,367 | 36.8 | -1.8 | |
| Social Credit | J D Gribben | 3,157 | 15.8 | +2.0 | |
| Majority | 2,129 | 10.6 | |||
| Turnout | 90.2 | ||||
| Registered electors | 22,293 | ||||
1978 election
| Party | Candidate | Votes | % | ± | |
|---|---|---|---|---|---|
| National | Colin McLachlan | 8,335 | 45.3 | ||
| Labour | Bill Woods | 7,103 | 38.6 | ||
| Social Credit | J D Gribben | 2,537 | 13.8 | ||
| Values | A G Fairweather | 411 | 2.3 | ||
| Majority | 1,232 | 6.7 | |||
| Turnout | 66.3 | ||||
| Registered electors | 27,882 | ||||
1966 election
| Party | Candidate | Votes | % | ± | |
|---|---|---|---|---|---|
| National | Colin McLachlan | 7,374 | 52.5 | -3.9 | |
| Labour | T K Campbell | 4,777 | 34.0 | +0.9 | |
| Social Credit | M McConnell | 1,903 | 13.5 | +7.0 | |
| Majority | 2,597 | 18.5 | |||
| Turnout | 85.3 | ||||
| Registered electors | 16,542 | ||||
1963 election
| Party | Candidate | Votes | % | ± | |
|---|---|---|---|---|---|
| National | John McAlpine | 8,164 | 56.4 | +0.1 | |
| Labour | Francis Edward Smith | 4,793 | 33.1 | -3.4 | |
| Social Credit | R H Morton | 942 | 6.5 | -0.7 | |
| Liberal | E L May | 572 | 4.0 | +4.0 | |
| Majority | 3,371 | 23.3 | |||
| Turnout | 88.1 | ||||
| Registered electors | 16,534 | ||||
1960 election
| Party | Candidate | Votes | % | ± | |
|---|---|---|---|---|---|
| National | John McAlpine | 8,096 | 56.3 | +3.1 | |
| Labour | John Palmer | 5,257 | 36.5 | -3.5 | |
| Social Credit | R H Morton | 1,042 | 7.2 | +1.4 | |
| Majority | 2,839 | 19.8 | |||
| Turnout | 90.0 | ||||
| Registered electors | 16,074 | ||||
1957 election
| Party | Candidate | Votes | % | ± | |
|---|---|---|---|---|---|
| National | John McAlpine | 7,564 | 53.2 | +3.1 | |
| Labour | S S M Cook | 5,833 | 41.0 | +10.4 | |
| Social Credit | R H Morton | 823 | 5.8 | -13.5 | |
| Majority | 1,731 | 12.2 | |||
| Turnout | 92.0 | ||||
| Registered electors | 15,501 | ||||
1954 election
| Party | Candidate | Votes | % | ± | |
|---|---|---|---|---|---|
| National | John McAlpine | 6,473 | 50.1 | -5.8 | |
| Labour | D Clinton | 3,852 | 30.6 | -13.5 | |
| Social Credit | T A Ward | 2,387 | 19.3 | +19.3 | |
| Majority | 2,521 | 19.5 | |||
| Turnout | 89.3 | ||||
| Registered electors | 14,612 | ||||
1951 election
| Party | Candidate | Votes | % | ± | |
|---|---|---|---|---|---|
| National | John McAlpine | 8,738 | 55.9 | +1.5 | |
| Labour | Jim Barclay | 6,902 | 44.1 | -1.5 | |
| Majority | 1,836 | 11.8 | |||
| Turnout | 91.3 | ||||
| Registered electors | 17,170 | ||||
1949 election
| Party | Candidate | Votes | % | ± | |
|---|---|---|---|---|---|
| National | John McAlpine | 8,205 | 54.4 | +2.6 | |
| Labour | Alan Sharp | 6,878 | 45.6 | -2.6 | |
| Majority | 1,327 | 8.8 | |||
| Turnout | 94.7 | ||||
| Registered electors | 16,035 | ||||
1946 election
| Party | Candidate | Votes | % | ± | |
|---|---|---|---|---|---|
| National | John McAlpine | 6,970 | 51.8 | ||
| Labour | Alan Sharp | 6,498 | 48.2 | ||
| Majority | 472 | 3.6 | |||
| Turnout | 93.2 | ||||
| Registered electors | 14,463 | ||||
1899 election
| Party | Candidate | Votes | % | ± | |
|---|---|---|---|---|---|
| Conservative | Charles Hardy | 1,308 | 38.96 | ||
| Liberal | John Rennie | 1,168 | 34.79 | ||
| Liberal | John Barrett | 454 | 13.52 | ||
| Liberal | Kenneth Wilson | 427 | 12.72 | ||
| Majority | 140 | 4.17 | -1.57 | ||
| Turnout | 3,357 | 74.93 | -10.05 | ||
| Registered electors | 4,480 | ||||
1896 election
| Party | Candidate | Votes | % | ± | |
|---|---|---|---|---|---|
| Conservative | Cathcart Wason | 1,676 | 52.87 | ||
| Independent | Alfred Saunders | 1,494 | 47.13 | ||
| Majority | 182 | 5.74 | |||
| Turnout | 3,170 | 84.99 | |||
| Registered electors | 3,730 | ||||
1890 election
| Party | Candidate | Votes | % | ± | |
|---|---|---|---|---|---|
| Independent | Alfred Saunders | 536 | 42.61 | ||
| Conservative | Thomas Hamilton Anson | 485 | 38.55 | ||
| Liberal | William Jerrington Popple | 237 | 18.84 | ||
| Majority | 51 | 4.05 | |||
| Turnout | 1,258 | 62.49 | |||
| Registered electors | 2,013 | ||||
1884 by-election
| Party | Candidate | Votes | % | ± | |
|---|---|---|---|---|---|
| Independent | Edward Wakefield | 479 | 60.25 | ||
| Independent | John McLachlan | 316 | 39.75 | ||
| Majority | 163 | 20.50 | |||
| Turnout | 795 | +177 | |||
1883 by-election
| Party | Candidate | Votes | % | ± | |
|---|---|---|---|---|---|
| Independent | Edward Lee | 258 | 41.75 | ||
| Independent | Edward Richardson | 220 | 35.60 | ||
| Independent | John McLachlan | 140 | 22.65 | ||
| Turnout | 618 | ||||
| Majority | 38 | 6.15 | |||
1875 election
| Party | Candidate | Votes | % | ± | |
|---|---|---|---|---|---|
| Independent | Cecil Fitzroy | 244 | 51.48 | ||
| Independent | William Reeves | 230 | 48.52 | ||
| Majority | 14 | 2.95 | |||
| Turnout | 474 | 68.30 | |||
| Registered electors | 694 | ||||
Notes
- 2017 Internet Party swing is relative to the votes for Internet-Mana in 2014; it shared a party list with Mana Party in the 2014 election
- 2017 Mana Party swing is relative to the votes for Internet-Mana in 2014; it shared a party list with the Internet Party in the 2014 election
References
- McRobie 1989, pp. 91–96.
- Report of the Representation Commission 2014 (PDF). Representation Commission. 4 April 2014. p. 10. ISBN 978-0-477-10414-2. Retrieved 26 September 2014.
- Cooke, Henry (23 September 2019). "Census 2018: New Zealand to gain one new seat in 2020 election". Stuff. Retrieved 23 September 2019.
- "Report of the Representation Commission 2020" (PDF). 17 April 2020.
- "Mr. C. A. Fitzroy at Doyleston". The Press. XXIV (3218). 23 December 1875. p. 2. Retrieved 11 July 2015.
- "Selwyn Poll". The Press. XXIV (3224). 31 December 1875. p. 2. Retrieved 11 July 2015.
- "Election Notices". The Press. XXIV (3212). 16 December 1875. p. 4. Retrieved 11 July 2015.
- "Selwyn nomination". Star (3553). 30 August 1879. p. 3. Retrieved 5 May 2012.
- "The General Election". Otago Daily Times (6190). 10 December 1881. p. 2. Retrieved 7 May 2012.
- "The General Elections". The Star (4249). 3 December 1881. p. 3. Retrieved 7 May 2012.
- "Election Notices". The Press. XLVII (7731). 10 December 1890. p. 1. Retrieved 24 June 2012.
- "Official Count Results – Selwyn". Wellington: New Zealand Electoral Commission. Retrieved 22 December 2017.
- 2014 election results
- 2011 election results
- "Enrolment statistics". Electoral Commission. 26 November 2011. Retrieved 27 November 2011.
- 2008 election results
- "Part XIV – Selwyn By-election" (PDF). Electoral Commission. Retrieved 13 July 2013.
- "The General Election, 1899". Wellington: Appendix to the Journals of the House of Representatives. 19 June 1900. p. 2. Retrieved 12 February 2014.
- "Untitled". The Press. LVI (10516). 30 November 1899. p. 8. Retrieved 18 February 2014.
- "The General Election, 1890". National Library. 1891. Retrieved 25 February 2012.
- "Selwyn Election". The Press. XL (5755). 28 February 1884. p. 3. Retrieved 5 May 2012.
- "Selwyn Election". New Zealand Times. 20 April 1883.
- "Selwyn Election". New Zealand Mail. 14 April 1883.
- "The Result of the Selwyn Election". New Zealand Times. 20 April 1883.
- McRobie, Alan (1989). Electoral Atlas of New Zealand. Wellington: GP Books. ISBN 0-477-01384-8.CS1 maint: ref=harv (link)
- Wilson, James Oakley (1985) [First published in 1913]. New Zealand Parliamentary Record, 1840–1984 (4th ed.). Wellington: V.R. Ward, Govt. Printer. OCLC 154283103.CS1 maint: ref=harv (link)