Verquières
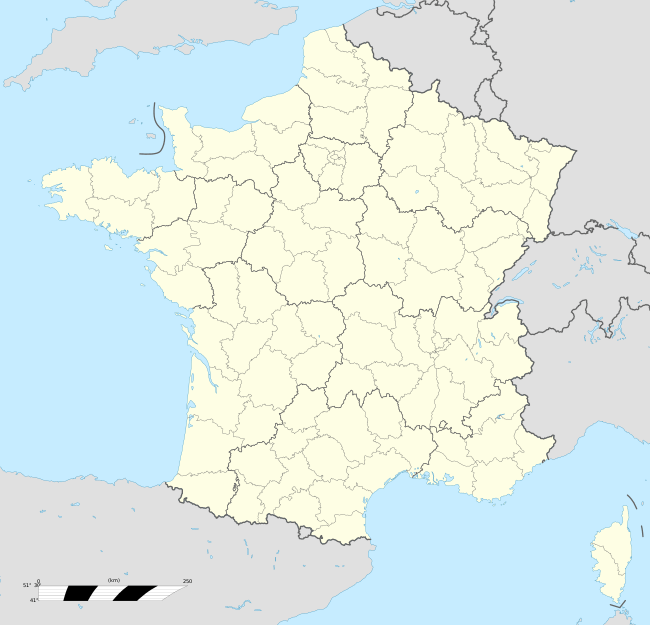
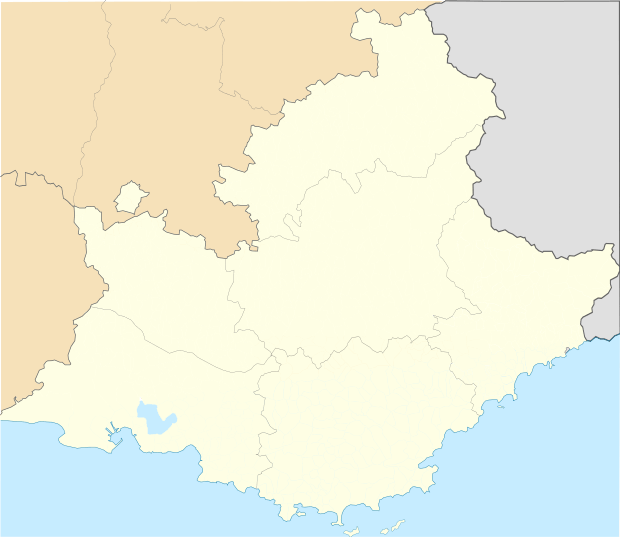
Verquières is a commune in the Bouches-du-Rhône department in southern France.
Verquières | |
|---|---|
The church in Verquières | |
.svg.png) Coat of arms | |
Location of Verquières 
| |
 Verquières  Verquières | |
| Coordinates: 43°50′27″N 4°55′09″E | |
| Country | France |
| Region | Provence-Alpes-Côte d'Azur |
| Department | Bouches-du-Rhône |
| Arrondissement | Arles |
| Canton | Châteaurenard |
| Intercommunality | Rhône Alpilles Durance |
| Government | |
| • Mayor (2008–2014) | Jean-Marc Martin-Teisserre |
| Area 1 | 4.91 km2 (1.90 sq mi) |
| Population (2017-01-01)[1] | 818 |
| • Density | 170/km2 (430/sq mi) |
| Time zone | UTC+01:00 (CET) |
| • Summer (DST) | UTC+02:00 (CEST) |
| INSEE/Postal code | 13116 /13670 |
| Elevation | 45–51 m (148–167 ft) (avg. 49 m or 161 ft) |
| 1 French Land Register data, which excludes lakes, ponds, glaciers > 1 km2 (0.386 sq mi or 247 acres) and river estuaries. | |
History
Towards the middle of the 12th century when the manor fell Diocese of Avignon on which city had been built. The parish was removed and attached to Saint-Andiol, and then restored in 1841.
Aside from his Mas Provençal, very typical include its castle and the Jesuit Church of St. Vérédème, fortified 14th century and enlarged in the 19th.
Its features: a massive square tower and spire serving his masons' marks, its barrel-vaulted nave broken, its apse semi-circular buttresses crowned with watch towers. Remember People's Oratory where we once went in procession to the rain
There are also beautiful wrought iron cross, very ornate they are due to the dexterity of the Reverend Roy who was pastor of the town from 1876 to 1894.
Finally, we can admire a beautiful loft and amazing framing the entrance of the pyramid field Beauplan located off the village road Eyragues.
Population
| Historical population | ||
|---|---|---|
| Year | Pop. | ±% |
| 1793 | 74 | — |
| 1800 | 83 | +12.2% |
| 1806 | 76 | −8.4% |
| 1821 | 104 | +36.8% |
| 1831 | 110 | +5.8% |
| 1836 | 109 | −0.9% |
| 1841 | 120 | +10.1% |
| 1846 | 133 | +10.8% |
| 1851 | 152 | +14.3% |
| 1856 | 169 | +11.2% |
| 1861 | 171 | +1.2% |
| 1866 | 195 | +14.0% |
| 1872 | 195 | +0.0% |
| 1876 | 212 | +8.7% |
| 1881 | 209 | −1.4% |
| 1886 | 184 | −12.0% |
| 1891 | 206 | +12.0% |
| 1896 | 189 | −8.3% |
| 1901 | 216 | +14.3% |
| 1906 | 242 | +12.0% |
| 1911 | 252 | +4.1% |
| 1921 | 247 | −2.0% |
| 1926 | 260 | +5.3% |
| 1931 | 268 | +3.1% |
| 1936 | 272 | +1.5% |
| 1946 | 281 | +3.3% |
| 1954 | 278 | −1.1% |
| 1962 | 296 | +6.5% |
| 1968 | 335 | +13.2% |
| 1975 | 316 | −5.7% |
| 1982 | 508 | +60.8% |
| 1990 | 654 | +28.7% |
| 1999 | 801 | +22.5% |
| 2008 | 779 | −2.7% |
References
- "Populations légales 2017". INSEE. Retrieved 6 January 2020.
| Wikimedia Commons has media related to Verquieres. |