Saint-Marc-Jaumegarde
Saint-Marc-Jaumegarde (Provençal: Sant Marc de Jaumegarda) is a commune in the Bouches-du-Rhône department in southern France.
Saint-Marc-Jaumegarde | |
|---|---|
 The centre of the village of Saint-Marc | |
.svg.png) Coat of arms | |
Location of Saint-Marc-Jaumegarde 
| |
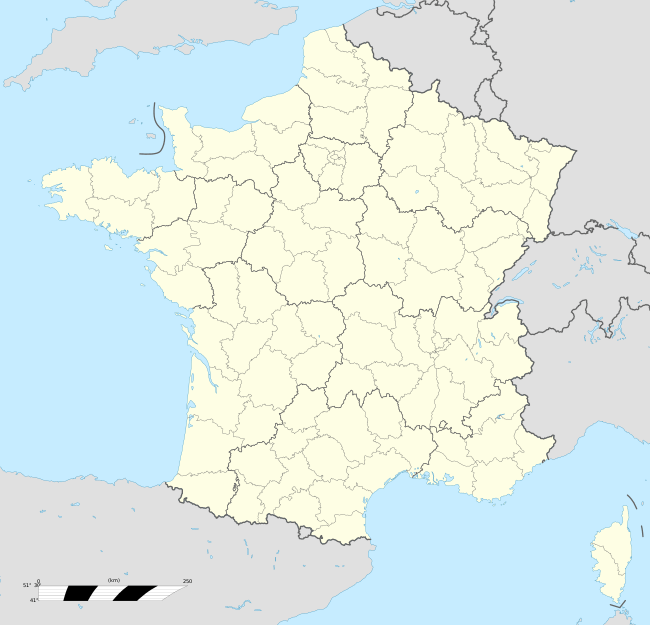 Saint-Marc-Jaumegarde 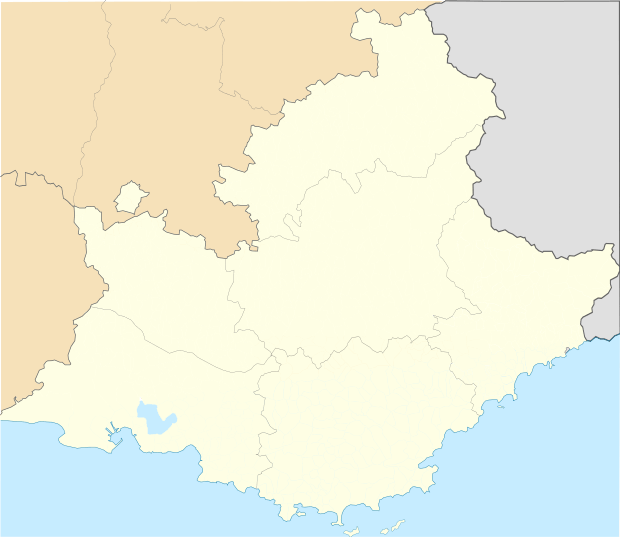 Saint-Marc-Jaumegarde | |
| Coordinates: 43°32′55″N 5°31′29″E | |
| Country | France |
| Region | Provence-Alpes-Côte d'Azur |
| Department | Bouches-du-Rhône |
| Arrondissement | Aix-en-Provence |
| Canton | Trets |
| Intercommunality | Aix-Marseille-Provence |
| Government | |
| • Mayor (2008–2014) | Régis Martin |
| Area 1 | 22.56 km2 (8.71 sq mi) |
| Population (2017-01-01)[1] | 1,250 |
| • Density | 55/km2 (140/sq mi) |
| Time zone | UTC+01:00 (CET) |
| • Summer (DST) | UTC+02:00 (CEST) |
| INSEE/Postal code | 13095 /13100 |
| Elevation | 241–600 m (791–1,969 ft) (avg. 395 m or 1,296 ft) |
| Website | www |
| 1 French Land Register data, which excludes lakes, ponds, glaciers > 1 km2 (0.386 sq mi or 247 acres) and river estuaries. | |
Location
It is located 6 kilometres away from Aix-en-Provence and Vauvenargues, Bouches-du-Rhône, and 3 kilometres away from Le Tholonet, near the Montagne Sainte-Victoire.
The commune includes Bonfillons, Roussillier, Plan de l'Orgue, Savoyards, and Bourg.

There are two man-made lakes, namely Bimont and Zola, and the streamlet, Prignon.
History
In 1239, the land was given to the Lord of Esparon by Ramon Berenguer IV, Count of Provence.
By 1490, Jacques Garde had become Lord of Saint-Marc, and twenty years later the land was passed on to Dauphine Garde, wife of Bertrand de Puget.
In 1723, Saint-Marc was sold to the Meyronnets, a family of advisors in the Provence Parliament. In 1784-1785 Philippe de Meyronnet invited Lucien Bonaparte and Joseph Bonaparte to his estate.
Population
| Historical population | ||
|---|---|---|
| Year | Pop. | ±% |
| 1793 | 221 | — |
| 1800 | 280 | +26.7% |
| 1806 | 291 | +3.9% |
| 1821 | 280 | −3.8% |
| 1831 | 268 | −4.3% |
| 1836 | 258 | −3.7% |
| 1841 | 241 | −6.6% |
| 1846 | 231 | −4.1% |
| 1851 | 253 | +9.5% |
| 1856 | 242 | −4.3% |
| 1861 | 185 | −23.6% |
| 1866 | 163 | −11.9% |
| 1872 | 181 | +11.0% |
| 1876 | 159 | −12.2% |
| 1881 | 166 | +4.4% |
| 1886 | 112 | −32.5% |
| 1891 | 126 | +12.5% |
| 1896 | 108 | −14.3% |
| 1901 | 100 | −7.4% |
| 1906 | 79 | −21.0% |
| 1911 | 65 | −17.7% |
| 1921 | 90 | +38.5% |
| 1926 | 115 | +27.8% |
| 1931 | 101 | −12.2% |
| 1936 | 108 | +6.9% |
| 1946 | 152 | +40.7% |
| 1954 | 182 | +19.7% |
| 1962 | 207 | +13.7% |
| 1968 | 356 | +72.0% |
| 1975 | 539 | +51.4% |
| 1982 | 517 | −4.1% |
| 1990 | 884 | +71.0% |
| 1999 | 1,078 | +21.9% |
| 2008 | 1,101 | +2.1% |
References
- "Populations légales 2017". INSEE. Retrieved 6 January 2020.
| Wikimedia Commons has media related to Saint-Marc-Jaumegarde. |
| Authority control |
|
|---|