South Dorset (UK Parliament constituency)
South Dorset is a constituency[n 1] represented in the House of Commons of the UK Parliament since 2010 by Richard Drax, a Conservative.[n 2] The constituency was created as a consequence of the Redistribution of Seats Act 1885, although the area covered has changed since then.
| South Dorset | |
|---|---|
| Borough constituency for the House of Commons | |
 Boundary of South Dorset in Dorset | |
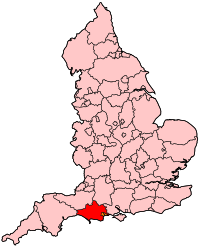 Location of Dorset within England | |
| County | Dorset |
| Electorate | 73,499 (December 2010)[1] |
| Major settlements | Weymouth and Swanage |
| Current constituency | |
| Created | 1885 |
| Member of Parliament | Richard Drax (Conservative) |
| Number of members | One |
| Created from | Dorset |
History
Formation
The constituency was created as a consequence of the Redistribution of Seats Act 1885. The Act reduced the number of MPs.in Dorset from 10 to 4 (see Redistribution of Seats Act 1885#Redistributed seats: England). It was initially proposed to name the new constituencies after existing boroughs (Shaftesbury, Dorchester, Poole and Bridport) but, following an amendment in the Commons on 14 April 1885, the names were changed to the points of the compass (North Dorset, South Dorset, East Dorset, West Dorset).[2]
The South Dorset constituency was divided into 7 polling districts. Dorchester was chosen as the place where the nomination of candidates would take place and the result would be declared.[3] The area covered was:[3]
- Broadwey polling district: Bincombe, Broadwey, Buckland Ripers, Preston and Sutton Poyntz, Upwey
- Chesilton polling district: Portland
- Dorchester polling district: Bockhampton-cum-Stinsford, Bradford Peverell and Muckleford, Charminster, Dorchester All Saints, Dorchester Holy Trinity, Dorchester St Peter, Fordington, Stratton and Grimstone, West Knighton, West Stafford, Whitcombe, Winterborne Came, Winterborne Herringstone, Winterborne Monkton, Winterborne St Martin
- Melcombe Regis polling district: Chickerell, Fleet, Melcombe Regis, Radipole, Weymouth, Wyke Regis
- Poxwell polling district: Broadmayne, Osmington, Poxwell, Warmwell, Watercombe
- Puddletown polling district: Affpuddle, Athelhampton, Burleston, Dewlish, Piddlehinton, Puddletown, Tincleton, Tolpuddle, Turners Puddle, Woodsford
- Winfrith polling district: Chaldon Herring, Coombe Keynes, East Lulworth, Moreton, Owermoigne, West Lulworth, Winfrith Newburgh, Wool
Recent history
In the 1997 election the seat was won by Ian Bruce by a margin of only 77 votes, one of the smallest margins in the UK. The 2001 election saw the second Labour win in South Dorset's history with Labour's smallest majority in England, at 153. In the 2005 election this constituency was one of the few in which Labour significantly increased their majority. Conservative candidate Ed Matts was found to have doctored an image which was part of his campaign material. Matts changed a photo of a protest against the deportation of a South Dorset resident, so that it appeared to be a protest against "uncontrolled immigration". In both elections, the left-wing singer-songwriter Billy Bragg led an anti-Conservative tactical voting campaign in Dorset constituencies.
The 2010 election saw Conservative Richard Drax, a former soldier and journalist from a long line of Dorset representatives, defeating the incumbent Jim Knight, who ended his final year in parliament as the Minister (of State) for Employment and Welfare Reform. Richard Drax retained the seat in 2015 election with an increased majority.
Boundaries
1885–1918: The Municipal Boroughs of Dorchester, and Weymouth and Melcombe Regis, and parts of the Sessional Divisions of Dorchester and Wareham.
1918–1950: The Municipal Boroughs of Wareham, and Weymouth and Melcombe Regis, the Urban Districts of Portland and Swanage, the Rural District of Wareham and Purbeck, and the part of the Rural District of Weymouth that was not included in the Dorset West constituency (i.e. Bincombe, Broadwey, Chickerell, Fleet, Osmington, Owermoigne, Poxwell, Preston, Radipole, Upwey and Wyke Regis).
1950–1983: The Municipal Boroughs of Wareham, and Weymouth and Melcombe Regis, the Urban Districts of Portland and Swanage, the Rural District of Wareham and Purbeck, and in the Rural District of Dorchester the civil parishes of Bincombe, Chickerell, Fleet, Osmington, Owermoigne, and Poxwell.
1983–1997: The Borough of Weymouth and Portland, the District of Purbeck wards of Bere Regis, Castle, Langton, St Martin, Swanage North, Swanage South, Wareham, West Purbeck, Winfrith, and Wool, and the District of West Dorset ward of Owermoigne.
1997–2010: The Borough of Weymouth and Portland, the District of Purbeck wards of Castle, Langton, Swanage North, Swanage South, West Purbeck, Winfrith, and Wool, and the District of West Dorset ward of Owermoigne.
2010–present: The Borough of Weymouth and Portland, the District of Purbeck wards of Castle, Creech Barrow, Langton, Swanage North, Swanage South, West Purbeck, Winfrith, and Wool, and the District of West Dorset ward of Owermoigne.
Constituency profile
The seat includes the coastal areas to the south of the county of Dorset, plus some rural Purbeck territory further inland. The port of Weymouth is one of the few large towns in Dorset and its suburbs extend onto the Wyke Regis peninsula and the isle of Portland, connected to the mainland by road (and, in the past, rail).
The constituency includes Bovington army camp, and further east, Corfe Castle, connected by the preserved Swanage Railway steam railway to the holiday resort of Swanage. This part of the seat is closer to Poole and Bournemouth than to Weymouth.
Workless claimants were in November 2012 significantly lower than the national average of 3.8%, at 2.8% of the population based on a statistical compilation by The Guardian.[4]
Members of Parliament
Elections
Elections in the 2010s
| Party | Candidate | Votes | % | ± | |
|---|---|---|---|---|---|
| Conservative | Richard Drax | 30,024 | 58.8 | +2.7 | |
| Labour | Carralyn Parkes | 12,871 | 25.2 | -8.4 | |
| Liberal Democrats | Nick Ireland | 5,432 | 10.6 | +4.8 | |
| Green | Jon Orrell | 2,246 | 4.4 | 0.0 | |
| Independent | Joseph Green | 485 | 0.9 | +0.9 | |
| Majority | 17,153 | 33.6 | +11.1 | ||
| Turnout | 51,250 | 69.4 | +0.7 | ||
| Conservative hold | Swing | ||||
| Party | Candidate | Votes | % | ± | |
|---|---|---|---|---|---|
| Conservative | Richard Drax | 29,135 | 56.1 | +7.2 | |
| Labour | Tashi Warr | 17,440 | 33.6 | +9.4 | |
| Liberal Democrats | Howard Legg | 3,053 | 5.9 | −0.1 | |
| Green | Jon Orrell | 2,278 | 4.4 | −0.3 | |
| Majority | 11,695 | 22.5 | -1.8 | ||
| Turnout | 51,906 | 68.7 | +0.6 | ||
| Conservative hold | Swing | ||||
| Party | Candidate | Votes | % | ± | |
|---|---|---|---|---|---|
| Conservative | Richard Drax | 23,756 | 48.7 | +3.6 | |
| Labour | Simon Bowkett | 11,762 | 24.2 | -6.1 | |
| UKIP | Malcolm Shakesby | 7,304 | 15.0 | +11.0 | |
| Liberal Democrats | Howard Legg | 2,901 | 6.0 | -13.0 | |
| Green | Jane Burnet | 2,275 | 4.7 | +3.5 | |
| Independent | Mervyn Stewkesbury | 435 | 0.9 | N/A | |
| Movement for Active Democracy | Andy Kirkwood | 164 | 0.3 | -0.2 | |
| Majority | 11,994 | 24.7 | +9.9 | ||
| Turnout | 48,737 | 68.1 | -0.5 | ||
| Conservative hold | Swing | ||||
| Party | Candidate | Votes | % | ± | |
|---|---|---|---|---|---|
| Conservative | Richard Drax | 22,667 | 45.1 | +7.1 | |
| Labour | Jim Knight | 15,224 | 30.3 | -11.4 | |
| Liberal Democrats | Ros Kayes | 9,557 | 19.0 | +3.2 | |
| UKIP | Mike Hobson | 2,034 | 4.0 | +0.8 | |
| Green | Brian Heatley | 595 | 1.2 | +1.2 | |
| Movement for Active Democracy | Andy Kirkwood | 233 | 0.5 | +0.5 | |
| Majority | 7,443 | 14.8 | N/A | ||
| Turnout | 50,310 | 68.6 | -0.8 | ||
| Conservative gain from Labour | Swing | +9.3 | |||
Elections in the 2000s
| Party | Candidate | Votes | % | ± | |
|---|---|---|---|---|---|
| Labour | Jim Knight | 20,231 | 41.6 | −0.4 | |
| Conservative | Ed Matts | 18,419 | 37.9 | −3.7 | |
| Liberal Democrats | Graham Oakes | 7,647 | 15.7 | +1.3 | |
| UKIP | Hugh Chalker | 1,571 | 3.2 | +1.2 | |
| Legalise Cannabis | Vic Hamilton | 282 | 0.6 | N/A | |
| Respect | Berny Parkes | 219 | 0.5 | N/A | |
| Personality and Rational Thinking? Yes! Party | Andy Kirkwood | 107 | 0.2 | N/A | |
| Wessex Regionalist | Colin Bex | 83 | 0.2 | N/A | |
| Socialist Labour | David Marchesi | 25 | 0.1 | N/A | |
| Majority | 1,812 | 3.7 | +3.3 | ||
| Turnout | 48,584 | 69.4 | +3.9 | ||
| Labour hold | Swing | +1.7 | |||
| Party | Candidate | Votes | % | ± | |
|---|---|---|---|---|---|
| Labour | Jim Knight | 19,027 | 42.0 | +6.0 | |
| Conservative | Ian Bruce | 18,874 | 41.6 | +5.5 | |
| Liberal Democrats | Andy Canning | 6,531 | 14.4 | -5.8 | |
| UKIP | Laurie Moss | 913 | 2.0 | +0.3 | |
| Majority | 153 | 0.4 | N/A | ||
| Turnout | 45,345 | 65.5 | -8.5 | ||
| Labour gain from Conservative | Swing | ||||
Elections in the 1990s
| Party | Candidate | Votes | % | ± | |
|---|---|---|---|---|---|
| Conservative | Ian Bruce | 17,755 | 36.10 | -14.2 | |
| Labour | Jim Knight | 17,678 | 35.94 | +14.84 | |
| Liberal Democrats | Michael Plummer | 9,936 | 20.20 | -6.9 | |
| Referendum | Patrick C. McAndrew | 2,791 | 5.68 | N/A | |
| UKIP | Malcolm Shakesby | 861 | 1.75 | N/A | |
| Natural Law | Gerald T.H. Napper | 161 | 0.33 | +0.03 | |
| Majority | 77 | 0.16 | -23.04 | ||
| Turnout | 49,182 | 73.97 | |||
| Conservative hold | Swing | ||||
| Party | Candidate | Votes | % | ± | |
|---|---|---|---|---|---|
| Conservative | Ian Bruce | 29,319 | 50.3 | −4.5 | |
| Liberal Democrats | Brian E.J. Ellis | 15,811 | 27.1 | −0.3 | |
| Labour | Alan Chedzoy | 12,298 | 21.1 | +3.8 | |
| Independent | JW Hagel | 673 | 1.2 | N/A | |
| Natural Law | MRF Griffiths | 191 | 0.3 | N/A | |
| Majority | 13,508 | 23.2 | −4.2 | ||
| Turnout | 58,292 | 76.9 | +1.4 | ||
| Conservative hold | Swing | −2.1 | |||
Elections in the 1980s
| Party | Candidate | Votes | % | ± | |
|---|---|---|---|---|---|
| Conservative | Ian Bruce | 30,184 | 54.84 | ||
| Liberal | Brian Ellis | 15,117 | 27.47 | ||
| Labour | Brenda Dench | 9,494 | 17.25 | ||
| Independent | Alistair Hayler | 244 | 0.44 | ||
| Majority | 15,067 | 27.38 | |||
| Turnout | 75.55 | ||||
| Conservative hold | Swing | ||||
| Party | Candidate | Votes | % | ± | |
|---|---|---|---|---|---|
| Conservative | Robert Gascoyne-Cecil | 28,631 | 57.10 | ||
| SDP | S.A. Head | 13,533 | 26.99 | ||
| Labour | D.J. Hewitt | 7,831 | 15.62 | ||
| Independent | B.O. Smith | 151 | 0.30 | ||
| Majority | 15,098 | 30.11 | |||
| Turnout | 72.68 | ||||
| Conservative hold | Swing | ||||
Elections in the 1970s
| Party | Candidate | Votes | % | ± | |
|---|---|---|---|---|---|
| Conservative | Robert Gascoyne-Cecil | 32,372 | 55.67 | ||
| Labour | Alan Chedzoy | 17,133 | 29.46 | ||
| Liberal | P St. J Howe | 8,649 | 14.87 | ||
| Majority | 15,239 | 26.20 | |||
| Turnout | 78.33 | ||||
| Conservative hold | Swing | ||||
| Party | Candidate | Votes | % | ± | |
|---|---|---|---|---|---|
| Conservative | Evelyn King | 24,351 | 45.88 | ||
| Labour | Alan Chedzoy | 17,652 | 33.26 | ||
| Liberal | C Sandy | 11,075 | 20.87 | ||
| Majority | 6,699 | 12.62 | |||
| Turnout | 75.38 | ||||
| Conservative hold | Swing | ||||
| Party | Candidate | Votes | % | ± | |
|---|---|---|---|---|---|
| Conservative | Evelyn King | 26,933 | 46.93 | ||
| Labour | Alan Chedzoy | 18,318 | 31.92 | ||
| Liberal | DT Broomfield | 12,140 | 21.15 | ||
| Majority | 8,615 | 15.01 | |||
| Turnout | 82.19 | ||||
| Conservative hold | Swing | ||||
| Party | Candidate | Votes | % | ± | |
|---|---|---|---|---|---|
| Conservative | Evelyn King | 27,580 | 52.06 | ||
| Labour | Richard May | 20,716 | 39.10 | ||
| Liberal | Keith Searby | 4,680 | 8.83 | ||
| Majority | 6,864 | 12.96 | |||
| Turnout | 78.98 | ||||
| Conservative hold | Swing | ||||
Elections in the 1960s
| Party | Candidate | Votes | % | ± | |
|---|---|---|---|---|---|
| Conservative | Evelyn King | 22,997 | 46.01 | ||
| Labour | Frederick W Morgan | 21,120 | 42.26 | ||
| Liberal | Geoffrey Maxwell Goode | 5,862 | 11.72 | ||
| Majority | 1,877 | 3.76 | |||
| Turnout | 81.00 | ||||
| Conservative hold | Swing | ||||
| Party | Candidate | Votes | % | ± | |
|---|---|---|---|---|---|
| Conservative | Evelyn King | 21,209 | 43.66 | ||
| Labour | Guy Barnett | 20,274 | 41.73 | ||
| Liberal | Terence Bourke | 7,100 | 14.61 | ||
| Majority | 935 | 1.92 | |||
| Turnout | 81.02 | ||||
| Conservative gain from Labour | Swing | ||||
| Party | Candidate | Votes | % | ± | |
|---|---|---|---|---|---|
| Labour | Guy Barnett | 13,783 | 33.51 | -1.16 | |
| Conservative | Angus Maude | 13,079 | 31.79 | -17.99 | |
| Liberal | Lawrence I Norbury-Williams | 8,910 | 21.66 | +6.11 | |
| Anti Common Market | Piers Debenham | 5,057 | 12.29 | N/A | |
| Independent | P. Burn | 181 | 0.44 | N/A | |
| Independent | M. Fudge | 82 | 0.20 | N/A | |
| Independent | J.C. O'Connor | 45 | 0.11 | N/A | |
| Majority | 704 | 1.71 | |||
| Turnout | 41,137 | ||||
| Labour gain from Conservative | Swing | ||||
Elections in the 1950s
| Party | Candidate | Votes | % | ± | |
|---|---|---|---|---|---|
| Conservative | Victor Montagu | 22,050 | 49.78 | ||
| Labour | Conrad F Ascher | 15,357 | 34.67 | ||
| Liberal | Lawrence I Norbury-Williams | 6,887 | 15.55 | ||
| Majority | 6,693 | 15.11 | |||
| Turnout | 78.82 | ||||
| Conservative hold | Swing | ||||
| Party | Candidate | Votes | % | ± | |
|---|---|---|---|---|---|
| Conservative | Victor Montagu | 22,119 | 50.71 | ||
| Labour | Frederick Newman Stacey | 16,702 | 38.29 | ||
| Liberal | Geoffrey Maxwell Goode | 4,798 | 11.00 | ||
| Majority | 5,417 | 12.42 | |||
| Turnout | 79.25 | ||||
| Conservative hold | Swing | ||||
| Party | Candidate | Votes | % | ± | |
|---|---|---|---|---|---|
| Conservative | Victor Montagu | 21,679 | 48.25 | ||
| Labour | Frederick Newman Stacey | 18,244 | 40.61 | ||
| Liberal | Wilfred Ewart Ward | 5,005 | 11.14 | ||
| Majority | 3,435 | 7.65 | |||
| Turnout | 83.98 | ||||
| Conservative hold | Swing | ||||
| Party | Candidate | Votes | % | ± | |
|---|---|---|---|---|---|
| Conservative | Victor Montagu | 20,014 | 45.51 | ||
| Labour | Frederick Newman Stacey | 17,471 | 39.73 | ||
| Liberal | Wyatt Trevelyan Rawson Rawson | 6,489 | 14.76 | ||
| Majority | 2,543 | 5.78 | |||
| Turnout | 84.38 | ||||
| Conservative hold | Swing | ||||
Elections in the 1940s

| Party | Candidate | Votes | % | ± | |
|---|---|---|---|---|---|
| Conservative | Victor Montagu | 14,626 | 42.72 | ||
| Labour | Philip Sidney Eastman | 12,460 | 36.40 | ||
| Liberal | Wilfred Ewart Ward | 7,149 | 20.88 | ||
| Majority | 2,166 | 6.33 | |||
| Turnout | 73.60 | ||||
| Conservative hold | Swing | ||||
| Party | Candidate | Votes | % | ± | |
|---|---|---|---|---|---|
| Conservative | Victor Montagu | unopposed | n/a | n/a | |
| Conservative hold | Swing | n/a | |||
General Election 1939/40:
Another general election was required to take place before the end of 1940. The political parties had been making preparations for an election to take place from 1939 and by the end of this year, the following candidates had been selected;
- Conservative: Robert Gascoyne-Cecil
- Liberal: Frederick William King
- Labour: Philip Sidney Eastman
Elections in the 1930s
| Party | Candidate | Votes | % | ± | |
|---|---|---|---|---|---|
| Conservative | Robert Gascoyne-Cecil | 17,637 | 57.88 | ||
| Labour | Arthur William Wiltshire | 8,580 | 28.16 | ||
| Liberal | Frederick William King | 4,255 | 13.96 | ||
| Majority | 9,057 | 29.72 | |||
| Turnout | 70.05 | ||||
| Conservative hold | Swing | ||||
| Party | Candidate | Votes | % | ± | |
|---|---|---|---|---|---|
| Conservative | Robert Gascoyne-Cecil | 21,284 | 70.73 | ||
| Labour | Arthur William Wiltshire | 8,809 | 29.27 | ||
| Majority | 12,475 | 41.45 | |||
| Turnout | 73.29 | ||||
| Conservative hold | Swing | ||||
Elections in the 1920s
| Party | Candidate | Votes | % | ± | |
|---|---|---|---|---|---|
| Unionist | Robert Gascoyne-Cecil | 14,632 | 49.2 | −21.3 | |
| Liberal | Cuthbert Plaistowe | 8,168 | 27.4 | N/A | |
| Labour | Arthur William Wiltshire | 6,950 | 23.4 | −6.1 | |
| Majority | 6,464 | 21.8 | −19.2 | ||
| Turnout | 29,750 | 75.5 | +9.4 | ||
| Registered electors | 39,396 | ||||
| Unionist hold | Swing | −7.6 | |||
| Party | Candidate | Votes | % | ± | |
|---|---|---|---|---|---|
| Unionist | Robert Yerburgh | 13,900 | 70.5 | +17.0 | |
| Labour | W Ridson | 5,821 | 29.5 | +12.0 | |
| Majority | 8,079 | 41.0 | +15.5 | ||
| Turnout | 19,721 | 66.1 | −5.5 | ||
| Registered electors | 29,845 | ||||
| Unionist hold | Swing | +2.5 | |||
| Party | Candidate | Votes | % | ± | |
|---|---|---|---|---|---|
| Unionist | Robert Yerburgh | 11,057 | 53.5 | −3.7 | |
| Liberal | Robert Comben | 5,973 | 29.0 | +7.0 | |
| Labour | David Wyndham Thomas | 3,602 | 17.5 | −3.3 | |
| Majority | 5,084 | 24.5 | −10.7 | ||
| Turnout | 20,632 | 71.6 | −3.6 | ||
| Registered electors | 28,810 | ||||
| Unionist hold | Swing | −5.4 | |||
| Party | Candidate | Votes | % | ± | |
|---|---|---|---|---|---|
| Unionist | Robert Yerburgh | 12,121 | 57.2 | −11.2 | |
| Liberal | Fred Maddison | 4,657 | 22.0 | N/A | |
| Labour | Henry Pavely | 4,394 | 20.8 | −10.8 | |
| Majority | 7,464 | 35.2 | −1.6 | ||
| Turnout | 21,172 | 75.2 | +17.3 | ||
| Registered electors | 28,149 | ||||
| Unionist hold | Swing | −0.2 | |||
Elections in the 1910s
| Party | Candidate | Votes | % | ± | |
|---|---|---|---|---|---|
| C | Unionist | Angus Hambro | 11,175 | 68.4 | N/A |
| Labour | Brett Morgan | 5,159 | 31.6 | N/A | |
| Majority | 6,016 | 36.8 | N/A | ||
| Turnout | 16,334 | 57.9 | N/A | ||
| Registered electors | 28,224 | ||||
| Unionist hold | Swing | N/A | |||
| C indicates candidate endorsed by the coalition government. | |||||
| Party | Candidate | Votes | % | ± | |
|---|---|---|---|---|---|
| Unionist | Angus Hambro | Unopposed | |||
| Unionist hold | |||||
| Party | Candidate | Votes | % | ± | |
|---|---|---|---|---|---|
| Conservative | Angus Hambro | 5,811 | 57.0 | +10.3 | |
| Liberal | Thomas Scarisbrick | 4,379 | 43.0 | −10.3 | |
| Majority | 1,432 | 14.0 | N/A | ||
| Turnout | 10,190 | 89.1 | +2.0 | ||
| Registered electors | 11,440 | ||||
| Conservative gain from Liberal | Swing | +10.3 | |||
Elections in the 1900s

| Party | Candidate | Votes | % | ± | |
|---|---|---|---|---|---|
| Liberal | Thomas Scarisbrick | 5,035 | 53.3 | +5.8 | |
| Conservative | William Brymer | 4,411 | 46.7 | −5.8 | |
| Majority | 624 | 6.6 | N/A | ||
| Turnout | 9,446 | 87.1 | +4.9 | ||
| Registered electors | 10,845 | ||||
| Liberal gain from Conservative | Swing | +5.8 | |||
| Party | Candidate | Votes | % | ± | |
|---|---|---|---|---|---|
| Conservative | William Brymer | 3,884 | 52.5 | N/A | |
| Liberal | Leslie Renton | 3,519 | 47.5 | N/A | |
| Majority | 365 | 5.0 | N/A | ||
| Turnout | 7,403 | 82.2 | N/A | ||
| Registered electors | 9,011 | ||||
| Conservative hold | Swing | N/A | |||
Elections in the 1890s
| Party | Candidate | Votes | % | ± | |
|---|---|---|---|---|---|
| Conservative | William Brymer | Unopposed | |||
| Conservative hold | |||||
| Party | Candidate | Votes | % | ± | |
|---|---|---|---|---|---|
| Conservative | William Brymer | 3,657 | 51.2 | −7.1 | |
| Liberal | Robert Edgcumbe | 3,489 | 48.8 | +7.1 | |
| Majority | 168 | 2.4 | −14.2 | ||
| Turnout | 7,146 | 86.0 | +4.5 | ||
| Registered electors | 8,310 | ||||
| Conservative hold | Swing | −7.1 | |||
| Party | Candidate | Votes | % | ± | |
|---|---|---|---|---|---|
| Conservative | William Brymer | 3,278 | 50.3 | −8.0 | |
| Liberal | Robert Edgcumbe | 3,238 | 49.7 | +8.0 | |
| Majority | 40 | 0.6 | −16.0 | ||
| Turnout | 6,516 | 84.0 | +2.5 | ||
| Registered electors | 7,757 | ||||
| Conservative hold | Swing | −8.0 | |||
Elections in the 1880s
| Party | Candidate | Votes | % | ± | |
|---|---|---|---|---|---|
| Conservative | Charles J. T. Hambro | 3,477 | 58.3 | +8.6 | |
| Liberal | Henry Parkman Sturgis | 2,486 | 41.7 | −8.6 | |
| Majority | 991 | 16.6 | N/A | ||
| Turnout | 5,963 | 81.5 | −3.6 | ||
| Registered electors | 7,316 | ||||
| Conservative gain from Liberal | Swing | +8.6 | |||
| Party | Candidate | Votes | % | ± | |
|---|---|---|---|---|---|
| Liberal | Henry Parkman Sturgis | 3,128 | 50.3 | N/A | |
| Conservative | Charles J. T. Hambro | 3,095 | 49.7 | N/A | |
| Majority | 33 | 0.6 | N/A | ||
| Turnout | 6,223 | 85.1 | N/A | ||
| Registered electors | 7,316 | ||||
| Liberal win (new seat) | |||||
Notes and references
- Notes
- A county constituency (for the purposes of election expenses and type of returning officer)
- As with all constituencies, the constituency elects one Member of Parliament (MP) by the first past the post system of election at least every five years.
- References
- "Electorate Figures - Boundary Commission for England". 2011 Electorate Figures. Boundary Commission for England. 4 March 2011. Archived from the original on 6 November 2010. Retrieved 13 March 2011.
- "The Redistribution Bill". The Times. 15 April 1885. p. 6.
- "Official Announcements – County of Dorset". Western Gazette. 17 July 1885. Retrieved 21 November 2015 – via British Newspaper Archive.
- Unemployment claimants by constituency The Guardian
- Leigh Rayment's Historical List of MPs – Constituencies beginning with "D" (part 2)
- Died 1891
- Called to the House of Lords, by a writ in acceleration, as Lord Cecil of Essendon in 1941
- Succeeded as the 10th Earl of Sandwich
- "Statement of Persons Nominated" (PDF).
- "Dorset South Results". BBC News. Retrieved 13 December 2019.
- "General election 8 June 2017". Dorsetforyou.com. Retrieved 13 May 2017.
- "Election Data 2015". Electoral Calculus. Archived from the original on 17 October 2015. Retrieved 17 October 2015.
- "Election Data 2010". Electoral Calculus. Archived from the original on 26 July 2013. Retrieved 17 October 2015.
- Grainger, Tom (20 April 2010). "Statement of Persons Nominated and Notice of Poll" (PDF). Acting Returning Officer. Weymouth & Portland Borough Council. Retrieved 24 April 2010.
- "Election Data 2005". Electoral Calculus. Archived from the original on 15 October 2011. Retrieved 18 October 2015.
- "Election Data 2001". Electoral Calculus. Archived from the original on 15 October 2011. Retrieved 18 October 2015.
- "Election Data 1997". Electoral Calculus. Archived from the original on 15 October 2011. Retrieved 18 October 2015.
- "Election Data 1992". Electoral Calculus. Archived from the original on 15 October 2011. Retrieved 18 October 2015.
- "Politics Resources". Election 1992. Politics Resources. 9 April 1992. Retrieved 6 December 2010.
- "Election Data 1987". Electoral Calculus. Archived from the original on 15 October 2011. Retrieved 18 October 2015.
- "Election Data 1983". Electoral Calculus. Archived from the original on 15 October 2011. Retrieved 18 October 2015.
- Craig, F. W. S. (1983). British parliamentary election results 1918-1949 (3 ed.). Chichester: Parliamentary Research Services. ISBN 0-900178-06-X.
- Debrett's House of Commons and the Judicial Bench, 1922
- British parliamentary election results, 1885-1918 (Craig)
- Craig, FWS, ed. (1974). British Parliamentary Election Results: 1885-1918. London: Macmillan Press. ISBN 9781349022984.
- The Constitutional Year Book, 1904, published by Conservative Central Office, page 143 (167 in web page), Dorsetshire
Sources
- BBC News article on the 2001 South Dorset election