North Swindon (UK Parliament constituency)
North Swindon is a constituency[n 1] represented in the House of Commons of the UK Parliament since 2010 by Justin Tomlinson, a Conservative.[n 2]
| North Swindon | |
|---|---|
| County constituency for the House of Commons | |
 Boundary of North Swindon in Wiltshire | |
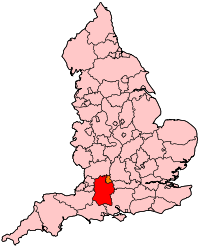 Location of Wiltshire within England | |
| County | Wiltshire |
| Electorate | 79,488 (December 2010)[1] |
| Current constituency | |
| Created | 1997 |
| Member of Parliament | Justin Tomlinson (Conservative) |
| Number of members | One |
| Created from | Swindon |
History
North Swindon was created in 1997 and has been a bellwether since then. However, during the 2010s, the Conservatives did win the constituency by much higher numbers than their national popular vote margin.
Boundaries
1997–2010: The Borough of Thamesdown wards of Blunsdon, Covingham, Gorse Hill, Haydon Wick, Highworth, Moredon, St Margaret, St Philip, Western, and Whitworth, and the District of North Wiltshire ward of Cricklade.
2010–present: The Borough of Swindon wards of Abbey Meads, Blunsdon, Covingham and Nythe, Gorse Hill and Pinehurst, Haydon Wick, Highworth, Moredon, Penhill, St Margaret, St Philip, and Western.
The seat's boundaries encompass an area that before its creation made up parts of the former Swindon constituency and pre-1997 versions of North Wiltshire and Devizes. In the 2010 boundary changes Cricklade became part of the North Wiltshire constituency while this seat acquired parts of the South Swindon constituency.
Constituency profile
The constituency covers much of urban and suburban Swindon, but also incorporates a substantial portion of the surrounding area, including Blunsdon and the market town of Highworth. North Swindon has an electorate of 79,488, the majority of whom live in the suburbs or close to Swindon's town centre. In 2001 52.9% of homes were into the categories of semi-detached or detached in the Swindon Local Authority area and seeing a 5.0% increase in flats/apartments in 2011 this figure had fallen slightly to 50.3%. In North Wiltshire a higher proportion of homes are detached (35.1%). In the same period those registered unemployed rose from 2.5% to 4.2% and those self-employed rose from 6.2% to 7.8%.[2] In 2010 the unemployment rate for Swindon South was 2.6%, compared to 3.5% in Swindon North. This is one indicator of social deprivation and compares a rate of 11.0% in Birmingham Ladywood, the constituency with the highest rate nationally.[3]
Members of Parliament
| Election | Member[4] | Party | |
|---|---|---|---|
| 1997 | Michael Wills | Labour | |
| 2010 | Justin Tomlinson | Conservative | |
Elections
Elections in the 2010s
| Party | Candidate | Votes | % | ± | |
|---|---|---|---|---|---|
| Conservative | Justin Tomlinson | 32,584 | 59.1 | ||
| Labour | Kate Linnegar | 16,413 | 29.8 | ||
| Liberal Democrats | Katie Critchlow | 4,408 | 8.0 | ||
| Green | Andy Bentley | 1,710 | 3.1 | ||
| Majority | 16,171 | 29.3 | |||
| Turnout | 55,115 | 66.9 | |||
| Conservative hold | Swing | ||||
| Party | Candidate | Votes | % | ± | |
|---|---|---|---|---|---|
| Conservative | Justin Tomlinson | 29,431 | 53.6 | ||
| Labour | Mark Dempsey | 21,096 | 38.4 | ||
| Liberal Democrats | Liz Webster | 1,962 | 3.6 | ||
| UKIP | Steve Halden | 1,564 | 2.8 | ||
| Green | Andy Bentley | 858 | 1.6 | ||
| Majority | 8,335 | 15.2 | |||
| Turnout | 54,911 | 68.5 | |||
| Conservative hold | Swing | ||||
| Party | Candidate | Votes | % | ± | |
|---|---|---|---|---|---|
| Conservative | Justin Tomlinson | 26,295 | 50.3 | ||
| Labour | Mark Dempsey [9] | 14,509 | 27.8 | ||
| UKIP | James Faulkner[10] | 8,011 | 15.3 | ||
| Green | Poppy Hebden-Leeder | 1,723 | 3.3 | ||
| Liberal Democrats | Janet Ellard[11] | 1,704 | 3.3 | ||
| Majority | 11,786 | 22.6 | |||
| Turnout | 64.5 | ||||
| Conservative hold | Swing | ||||
| Party | Candidate | Votes | % | ± | |
|---|---|---|---|---|---|
| Conservative | Justin Tomlinson | 22,408 | 44.6 | ||
| Labour | Victor Agarwal | 15,348 | 30.5 | ||
| Liberal Democrats | Jane Lock | 8,668 | 17.2 | ||
| UKIP | Stephen Halden | 1,842 | 3.7 | ||
| BNP | Reg Bates | 1,542 | 3.1 | ||
| Green | Bill Hughes | 487 | 1.0 | ||
| Majority | 7,060 | 14.0 | |||
| Turnout | 50,295 | 64.2 | |||
| Conservative gain from Labour | Swing | ||||
Elections in the 2000s
| Party | Candidate | Votes | % | ± | |
|---|---|---|---|---|---|
| Labour | Michael Wills | 19,612 | 43.7 | ||
| Conservative | Justin Tomlinson | 17,041 | 38.0 | ||
| Liberal Democrats | Mike Evemy | 6,831 | 15.2 | ||
| UKIP | Robert Tingey | 998 | 2.2 | ||
| Socialist Unity | Andy Newman | 208 | 0.5 | ||
| Independent | Ernest Reynolds | 195 | 0.4 | ||
| Majority | 2,571 | 5.7 | N/A | ||
| Turnout | 44,885 | 61.0 | |||
| Labour hold | Swing | ||||
| Party | Candidate | Votes | % | ± | |
|---|---|---|---|---|---|
| Labour | Michael Wills | 22,371 | 52.9 | ||
| Conservative | Nick Martin | 14,266 | 33.7 | ||
| Liberal Democrats | David Nation | 4,891 | 11.6 | ||
| UKIP | Brian Lloyd | 800 | 1.9 | ||
| Majority | 8,105 | 19.2 | N/A | ||
| Turnout | 42,328 | 61.0 | |||
| Labour hold | Swing | N/A | |||
Elections in the 1990s
| Party | Candidate | Votes | % | ± | |
|---|---|---|---|---|---|
| Labour | Michael Wills | 24,029 | 49.8 | N/A | |
| Conservative | Guy Opperman | 16,341 | 33.8 | N/A | |
| Liberal Democrats | Mike Evemy | 6,237 | 12.9 | N/A | |
| Referendum | Gillian Goldsmith | 1,533 | 3.2 | N/A | |
| Natural Law | Alexander Fisken | 130 | 0.3 | N/A | |
| Majority | 7,688 | 16.0 | N/A | ||
| Turnout | 73.66 | N/A | |||
| Labour win (new seat) | |||||
Neighbouring constituencies
Constituencies bordering Swindon North | ||||||||||
|---|---|---|---|---|---|---|---|---|---|---|
| ||||||||||
Notes and references
- Notes
- A county constituency (for the purposes of election expenses and type of returning officer)
- As with all constituencies, the constituency elects one Member of Parliament (MP) by the first past the post system of election at least every five years.
- References
- "Electorate Figures – Boundary Commission for England". 2011 Electorate Figures. Boundary Commission for England. 4 March 2011. Archived from the original on 6 November 2010. Retrieved 13 March 2011.
- "2011 census interactive maps". Archived from the original on 29 January 2016.
- "Unemployment claimants by constituency", The Guardian, 17 November 2010
- Leigh Rayment's Historical List of MPs – Constituencies beginning with "S" (part 6)
- Council, Swindon Borough. "Statement of Persons Nominated, Notice of Poll and Situation of Polling Stations North Swindon | Swindon Borough Council". www.swindon.gov.uk. Retrieved 16 November 2019.
- "ELECTION 2017: Labour choose North Swindon candidate". Swindon Advertiser.
- "Election Data 2015". Electoral Calculus. Archived from the original on 17 October 2015. Retrieved 17 October 2015.
- "Swindon North parliamentary constituency - Election 2017". BBC News.
- http://www.northswindonlabour.co.uk/markdempsey/mark-dempsey-selected-ppc-for-north-swindon
- "Swindon UKIP Branch".
- http://www.libdems.org.uk/general_election_candidates#South_West
- "Election Data 2010". Electoral Calculus. Archived from the original on 26 July 2013. Retrieved 17 October 2015.
- "Election 2010 - Constituency - Swindon North". BBC News.