Sea-level curve
The sea-level curve is the representation of the changes of the sea level throughout the geological history.
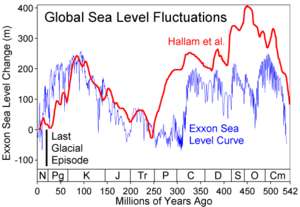
The first such curve is the Vail curve or Exxon curve. The names of the curve refer to the fact that in 1977 a team of Exxon geologists from Esso Production Research headed by Peter Vail published a monograph on global eustatic sea-level changes. Their sea-level curve was based on seismic and biostratigraphic data accumulated during petroleum exploration.[1]
The Vail curve (and the monograph itself) was the subject of debate among geologists, because it was based on undisclosed commercially confidential stratigraphic data, and hence not independently verifiable.[2] Because of this, there were later efforts to establish a sea-level curve based on non-commercial data.
In 1987–1988 a revised eustatic sea-level curve for the Mesozoic and Cenozoic eras was published, now known as the Haq sea-level curve, in reference to the Pakistani-American Oceanographer Bilal Haq.[1]
Subsequent revisions of the eustatic sea-level curve have been published by B. Haq since then for the Cretaceous, Jurassic, and Triassic, respectively in 2014, 2017, and 2018.
References
- Principles of Paleoclimatology, by Thomas M. Cronin (1999) ISBN 0-231-10955-5, pp. 381, 382
- "Climate Change", William James Burroughs p 87
See also
- Sea level rise
- Sea level change
- Past changes in sea level
- Marine terrace