San Quintin, Pangasinan
San Quintin, officially the Municipality of San Quintin, (Pangasinan: Baley na San Quintin; Ilocano: Ili ti San Quintin; Tagalog: Bayan ng San Quintin), is a 3rd class municipality in the province of Pangasinan, Philippines. According to the 2015 census, it has a population of 32,945 people.[3]
San Quintin | |
|---|---|
| Municipality of San Quintin | |
 | |
 Seal | |
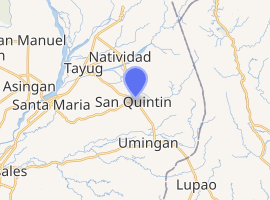
 Map of Pangasinan with San Quintin highlighted | |
| |
.svg.png) San Quintin Location within the Philippines | |
| Coordinates: 15°59′04″N 120°48′54″E | |
| Country | |
| Region | Ilocos Region (Region I) |
| Province | Pangasinan |
| District | 6th district |
| Founded | June 5, 1863 |
| Barangays | 21 (see Barangays) |
| Government | |
| • Type | Sangguniang Bayan |
| • Mayor | Clark Cecil P. Tiu |
| • Vice Mayor | Gerry C. Abenojar |
| • Congressman | Tyrone D. Agabas |
| • Electorate | 23,224 voters (2019) |
| Area | |
| • Total | 115.90 km2 (44.75 sq mi) |
| Elevation | 108.8 m (357.0 ft) |
| Population (2015 census)[3] | |
| • Total | 32,945 |
| • Density | 280/km2 (740/sq mi) |
| • Households | 8,002 |
| Economy | |
| • Income class | 3rd municipal income class |
| • Poverty incidence | 12.64% (2015)[4] |
| • Revenue (₱) | 94,034,287.75 (2016) |
| Time zone | UTC+8 (PST) |
| ZIP code | 2444 |
| PSGC | |
| IDD : area code | +63 (0)75 |
| Climate type | tropical monsoon climate |
| Native languages | Pangasinan Ilocano Tagalog |
| Website | sanquintinpangasinan |
Barangays
San Quintin is politically subdivided into 21 barangays.
- Alac
- Baligayan
- Bantog
- Bolintaguen
- Cabangaran
- Cabalaoangan
- Calomboyan
- Carayacan
- Casantamaria-an
- Gonzalo
- Labuan
- Lagasit
- Lumayao
- Mabini
- Mantacdang
- Nangapugan
- San Pedro
- Ungib
- Poblacion Zone I
- Poblacion Zone II
- Poblacion Zone III
Demographics
| Population census of San Quintin | ||
|---|---|---|
| Year | Pop. | ±% p.a. |
| 1903 | 8,092 | — |
| 1918 | 9,762 | +1.26% |
| 1939 | 12,833 | +1.31% |
| 1948 | 15,330 | +2.00% |
| 1960 | 16,444 | +0.59% |
| 1970 | 18,842 | +1.37% |
| 1975 | 20,381 | +1.59% |
| 1980 | 20,835 | +0.44% |
| 1990 | 24,293 | +1.55% |
| 1995 | 26,257 | +1.47% |
| 2000 | 28,258 | +1.59% |
| 2007 | 30,556 | +1.08% |
| 2010 | 32,626 | +2.41% |
| 2015 | 32,945 | +0.19% |
| Source: Philippine Statistics Authority[3][5][6][7] | ||

San Quintin Town Hall
Climate
| Climate data for San Quintin, Pangasinan | |||||||||||||
|---|---|---|---|---|---|---|---|---|---|---|---|---|---|
| Month | Jan | Feb | Mar | Apr | May | Jun | Jul | Aug | Sep | Oct | Nov | Dec | Year |
| Average high °C (°F) | 31 (88) |
31 (88) |
32 (90) |
34 (93) |
35 (95) |
34 (93) |
32 (90) |
32 (90) |
32 (90) |
32 (90) |
32 (90) |
31 (88) |
32 (90) |
| Average low °C (°F) | 22 (72) |
22 (72) |
22 (72) |
24 (75) |
24 (75) |
24 (75) |
24 (75) |
24 (75) |
24 (75) |
23 (73) |
23 (73) |
22 (72) |
23 (74) |
| Average precipitation mm (inches) | 13.6 (0.54) |
10.4 (0.41) |
18.2 (0.72) |
15.7 (0.62) |
178.4 (7.02) |
227.9 (8.97) |
368 (14.5) |
306.6 (12.07) |
310.6 (12.23) |
215.7 (8.49) |
70.3 (2.77) |
31.1 (1.22) |
1,766.5 (69.56) |
| Average rainy days | 3 | 2 | 2 | 4 | 14 | 16 | 23 | 21 | 24 | 15 | 10 | 6 | 140 |
| Source: World Weather Online[8] | |||||||||||||
References
- "Municipality". Quezon City, Philippines: Department of the Interior and Local Government. Retrieved 31 May 2013.
- "Province: Pangasinan". PSGC Interactive. Quezon City, Philippines: Philippine Statistics Authority. Retrieved 12 November 2016.
- Census of Population (2015). "Region I (Ilocos Region)". Total Population by Province, City, Municipality and Barangay. PSA. Retrieved 20 June 2016.
- "PSA releases the 2015 Municipal and City Level Poverty Estimates". Quezon City, Philippines. Retrieved 1 January 2020.
- Census of Population and Housing (2010). "Region I (Ilocos Region)". Total Population by Province, City, Municipality and Barangay. NSO. Retrieved 29 June 2016.
- Censuses of Population (1903–2007). "Region I (Ilocos Region)". Table 1. Population Enumerated in Various Censuses by Province/Highly Urbanized City: 1903 to 2007. NSO.
- "Province of Pangasinan". Municipality Population Data. Local Water Utilities Administration Research Division. Retrieved 17 December 2016.
- "San Quintin, Pangasinan: Average Temperatures and Rainfall". World Weather Online. Retrieved 31 October 2015.
External links
| Wikimedia Commons has media related to San Quintin, Pangasinan. |
- San Quintin Profile at PhilAtlas.com
- Municipal Profile at the National Competitiveness Council of the Philippines
- San Quintin at the Pangasinan Government Website
- Local Governance Performance Management System
- Philippine Standard Geographic Code
- Philippine Census Information
- Pangasinan.org : San Quintin Family and School Reunion Archives
Places adjacent to San Quintin, Pangasinan | ||||||||||
|---|---|---|---|---|---|---|---|---|---|---|
| ||||||||||
Lingayen (capital) | |
| Municipalities |
|
| Component cities | |
| Independent component city |
|
| Barangays | |
This article is issued from Wikipedia. The text is licensed under Creative Commons - Attribution - Sharealike. Additional terms may apply for the media files.